. 2023 Jun 5;220(6):e20221472.
doi: 10.1084/jem.20221472. Epub 2023 Mar 30.

Phagocytosis increases an oxidative metabolic and immune suppressive signature in tumor macrophages

Affiliations

Phagocytosis increases an oxidative metabolic and immune suppressive signature in tumor macrophages

Michael A Gonzalez et al. J Exp Med. .

Abstract

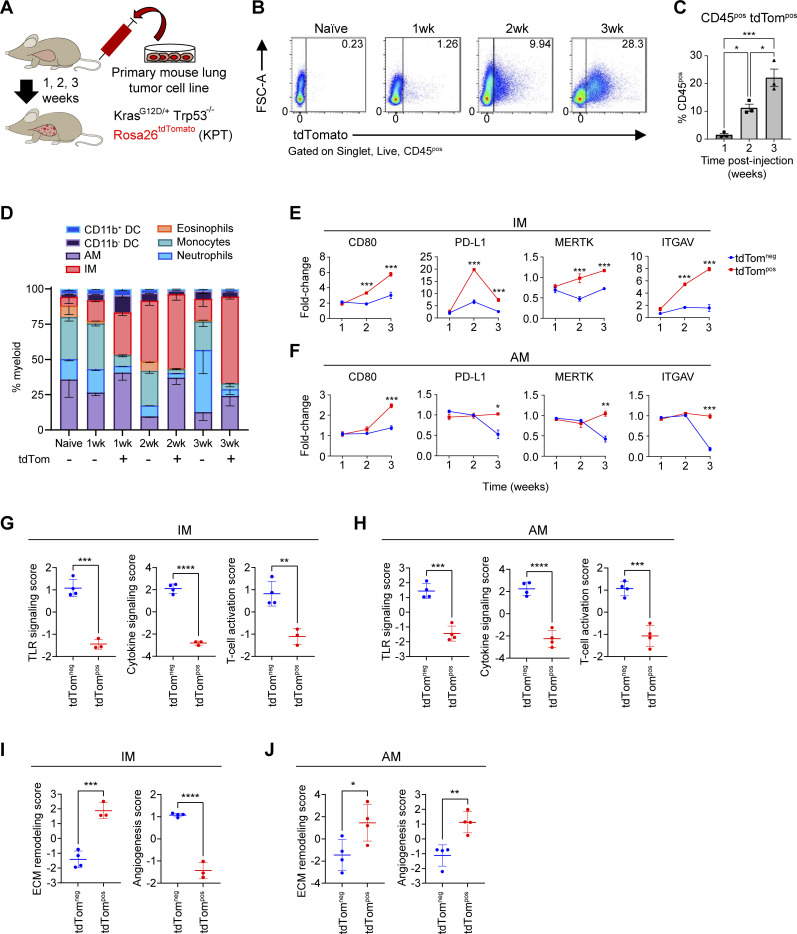
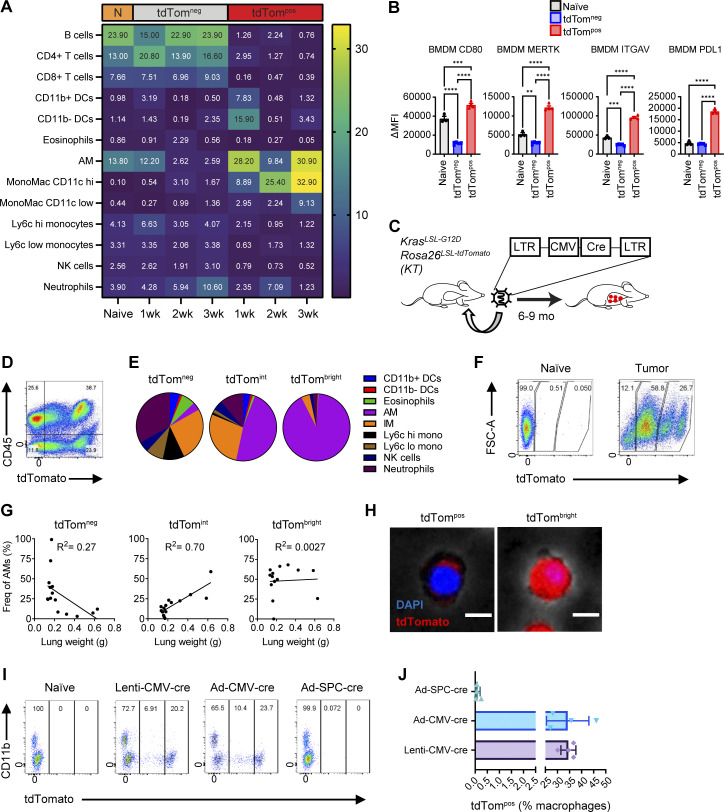
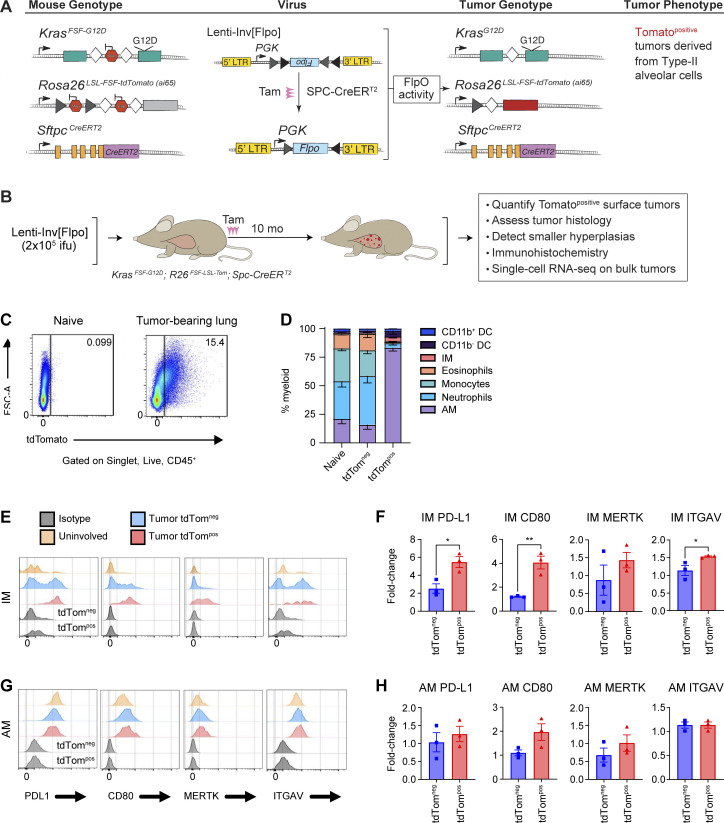
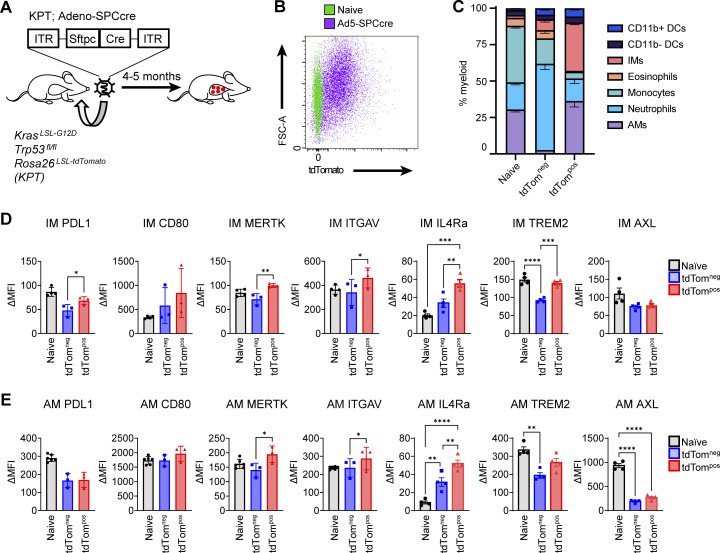
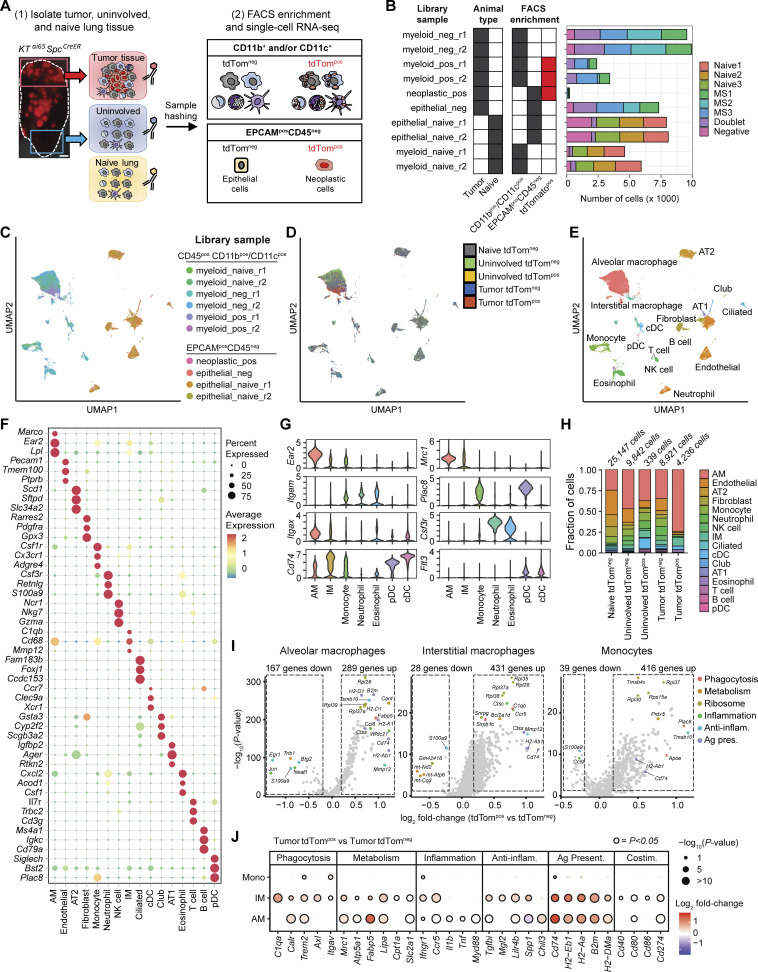
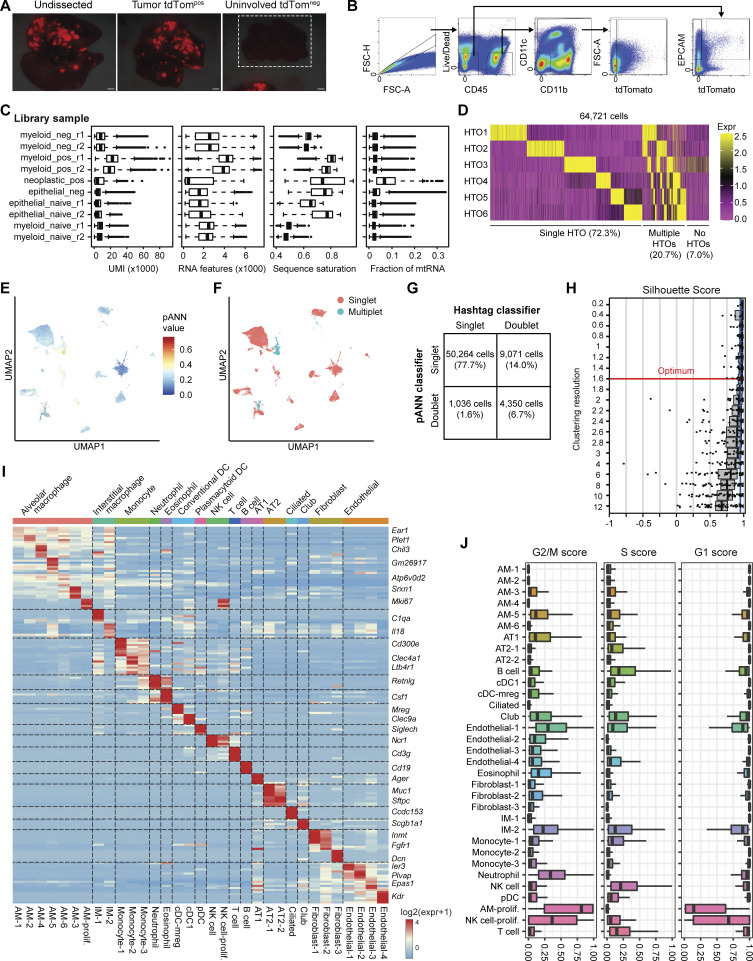
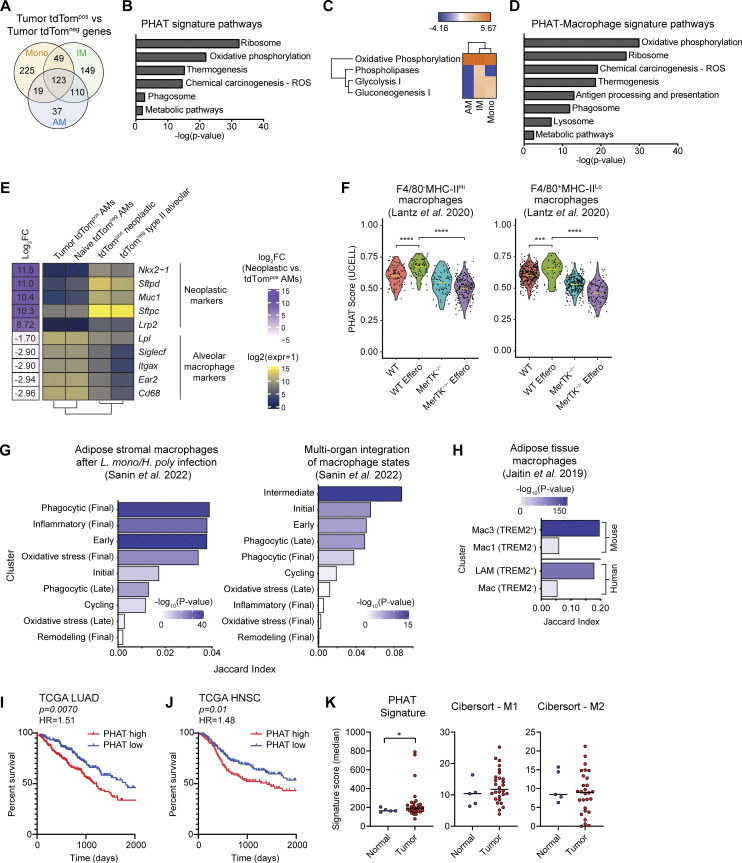
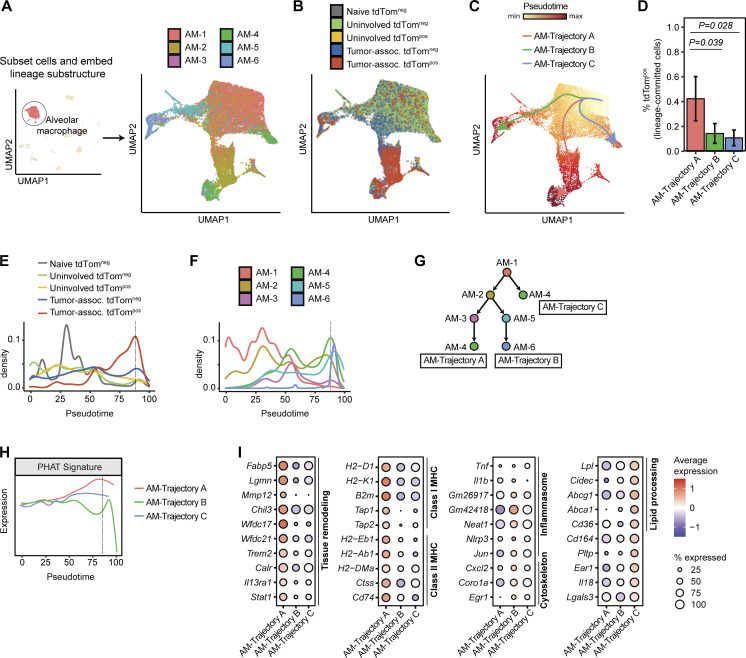
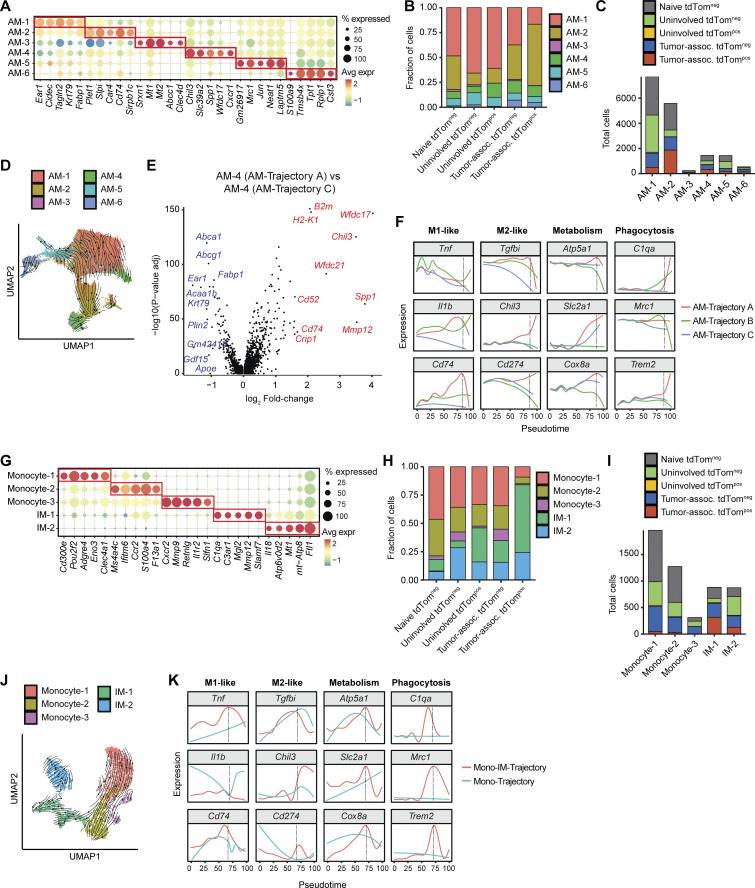
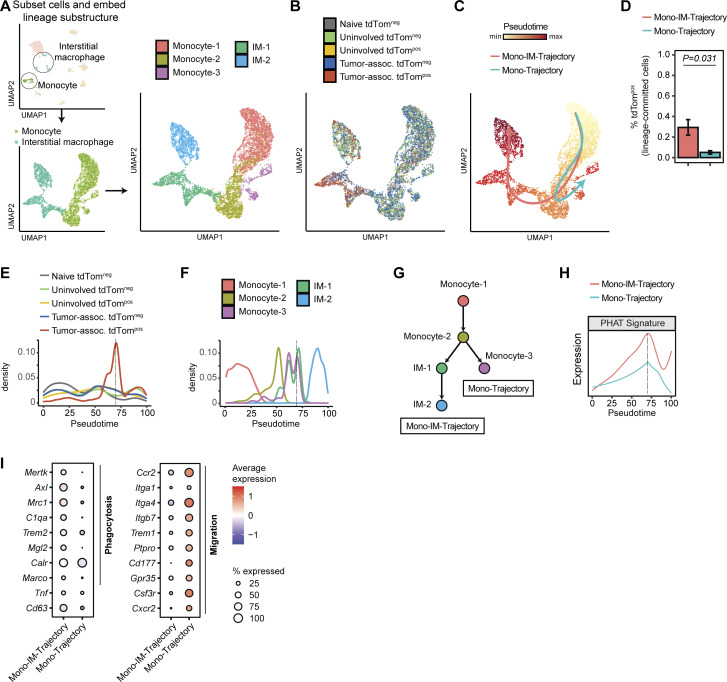
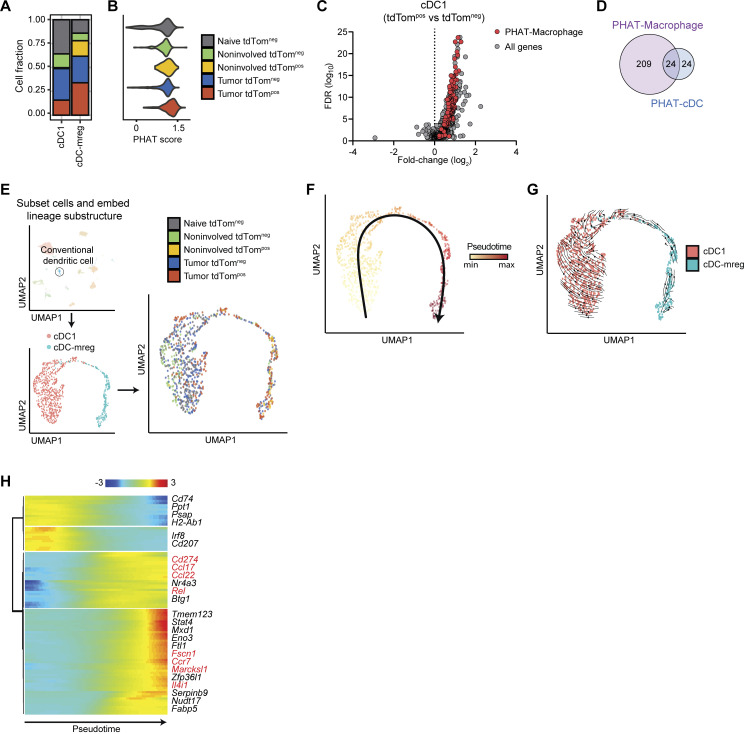
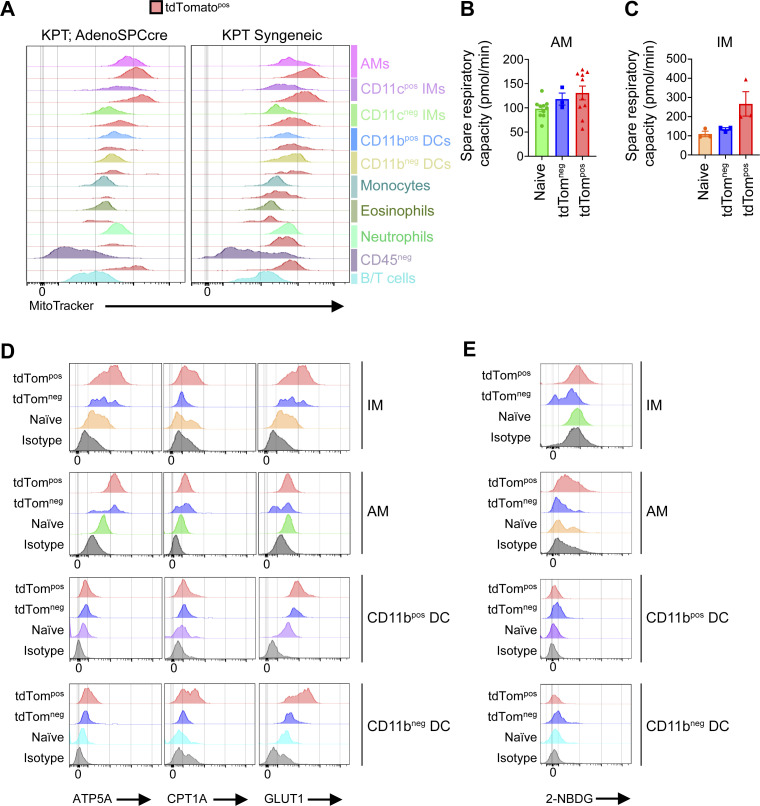
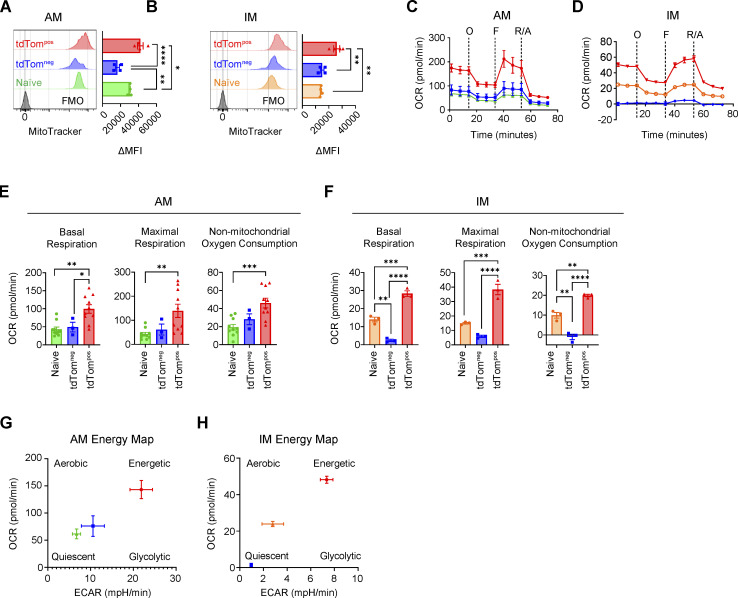
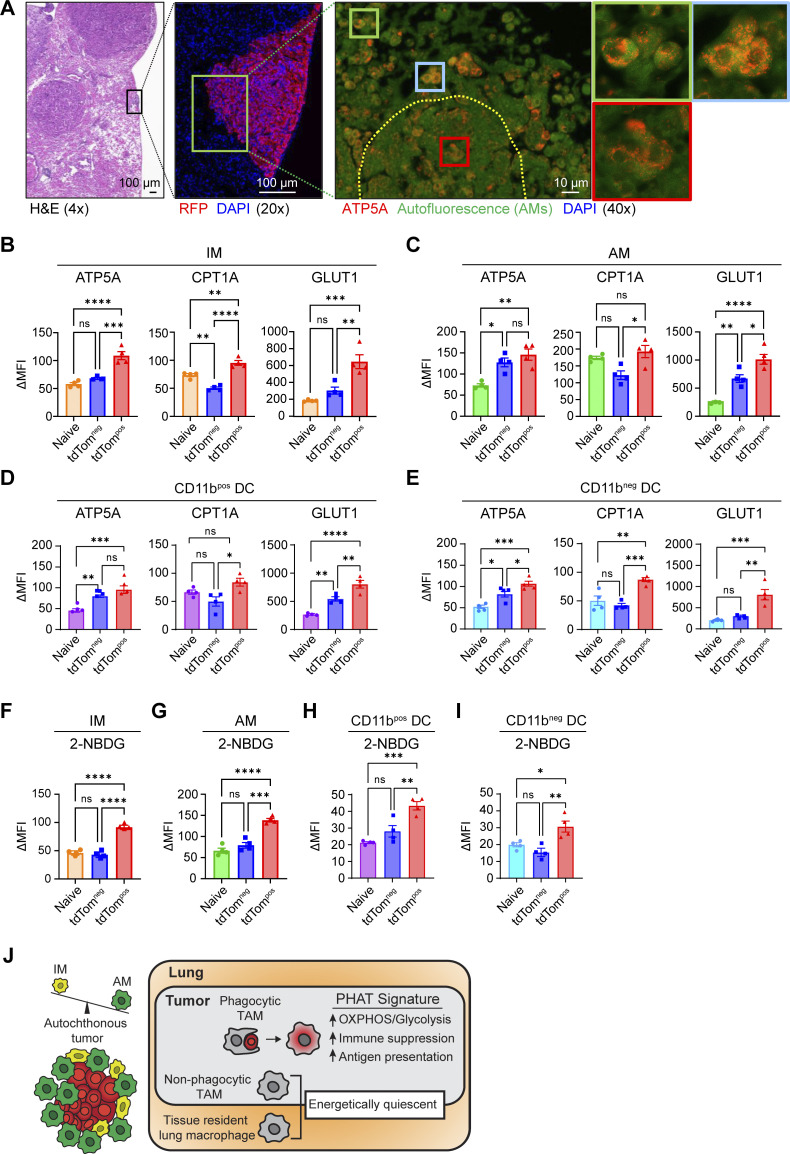
Phagocytosis is a key macrophage function, but how phagocytosis shapes tumor-associated macrophage (TAM) phenotypes and heterogeneity in solid tumors remains unclear. Here, we utilized both syngeneic and novel autochthonous lung tumor models in which neoplastic cells express the fluorophore tdTomato (tdTom) to identify TAMs that have phagocytosed neoplastic cells in vivo. Phagocytic tdTompos TAMs upregulated antigen presentation and anti-inflammatory proteins, but downregulated classic proinflammatory effectors compared to tdTomneg TAMs. Single-cell transcriptomic profiling identified TAM subset-specific and common gene expression changes associated with phagocytosis. We uncover a phagocytic signature that is predominated by oxidative phosphorylation (OXPHOS), ribosomal, and metabolic genes, and this signature correlates with worse clinical outcome in human lung cancer. Expression of OXPHOS proteins, mitochondrial content, and functional utilization of OXPHOS were increased in tdTompos TAMs. tdTompos tumor dendritic cells also display similar metabolic changes. Our identification of phagocytic TAMs as a distinct myeloid cell state links phagocytosis of neoplastic cells in vivo with OXPHOS and tumor-promoting phenotypes.


Conflict of interest statement

Disclosures: M.A. Gonzalez is a current employee of Gilead Sciences. D.R. Lu reported currently being an employee of Amgen, Inc. M. Yousefi reported other from Pionyr Immunotherapeutics outside the submitted work. C.G. Briseño reported other from Amgen, Inc. during the conduct of the study; other from Amgen, Inc. outside the submitted work; and being an employee of Amgen, Inc. J.E.V. Watson reported being an employee of Amgen, Inc. and holding Amgen, Inc. stock. V. Arias reported currently being employed at Amgen, Inc. C.M. Li reported non-financial support from Amgen, Inc. during the conduct of the study; and personal fees from Amgen, Inc. outside the submitted work. M.M. Winslow reported grants from NIH during the conduct of the study; and is a cofounder, advisor, and has equity in D2G Oncology, Inc. K.V. Tarbell reported personal fees from Amgen, Inc. during the conduct of the study; personal fees from Amgen, Inc. outside the submitted work; and being an employee of Amgen, Inc. In addition, Amgen, Inc. financially supported the research included in this manuscript. No other disclosures were reported.

Figures

Figure 1.
Figure 1.
TAMs have distinct phenotypes after phagocytosis in acute lung tumor mouse models. (A) Schematic of intravenous transplantation of a primary lung tumor cell line (KPT; SP110P) into recipient F1 C57BL/6J-129S1/Svlmj mice over a 3-wk time course. (B) Flow cytometry gating of CD45pos tdTompos and tdTomneg lung macrophages gated on cells at 1, 2, and 3 wk after i.v injection of KPT primary lung tumor cell line. (C) Ordinary one-way ANOVA (*, P ≤ 0.05; ***, P ≤ 0.001). Bar plots showing the percentage of CD45pos tdTompos cells in the acute lung tumor model after i.v. injection. (D) Myeloid cell composition within the tdTompos or tdTomneg immune cell fraction in naive and tumor-bearing mice. (E and F) Fold change MFI of immune-modulatory and phagocytosis cell surface markers on IMs (E) or AMs (F) relative to naive IMs or AMs, respectively. Unpaired t test (*, P ≤ 0.05; **, P ≤ 0.01; ***, P ≤ 0.001). (G–J) Pathway enrichment score of immune-activation gene modules (G and H) and tissue-reorganization gene modules (I and J) for tdTompos or tdTomneg IMs and AMs based on analysis of focused panels of Nanostring mRNA probes. Unpaired t test (*, P ≤ 0.05; **, P ≤ 0.01; ***, P ≤ 0.001; ****, P ≤ 0.0001). Data are representative of at least three independent experiments.
Figure S1.
Figure S1.
Identification of phagocytic versus transduced TAMs in syngeneic and autochthonous lung tumors in vivo. (A) Heatmap of immune cell frequencies within naive or syngeneic tumor-bearing mice. (B) MFIs of cell surface markers on tdTompos or tdTomneg BMDMs co-cultured with KPT SP110 cancer cells. (C) Schematic of lentiviral lung tumor initiation in KrasstopflG12D Rosa26stopfl-tdTomato mice. Ordinary one-way ANOVA (*, P ≤ 0.05; **, P ≤ 0.01; ***, P ≤ 0.001; ****, P ≤ 0.0001). (D) Flow cytometry plot of total live cells isolated from KT tumor-bearing mice. (E) Pie charts of the frequencies of myeloid cell subsets gated on tdTom-negative (tdTomneg), tdTom-intermediate (tdTomint), or tdTom-bright (tdTombright) CD45pos CD11b/cpos cells. (F) Flow cytometry plots of tdTombright, tdTomint, and tdTomneg lung macrophages gated on CD64pos CD24neg cells at in autochthonous lung tumors. (G) Scatter plots of the frequencies of tdTomneg, tdTomint, or tdTombright AMs and lung weights with linear regression calculations. (H) Fluorescent cell imaging of AMs from autochthonous lung tumors sorted from tdTomint or tdTombright. Scale bar, 10 μm. (I) Flow cytometry plots of total macrophages gated on CD64pos CD11b/cpos CD45pos cells isolated from lungs of KTai65;SpcCreER mice transduced with indicated viral vectors. (J) Frequencies of tdTompos macrophages from mice in I. Data are representative of at least three independent experiments.
Figure 2.
Figure 2.
Alveolar macrophages are the primary phagocytic myeloid cell in autochthonous lung tumors. (A) Schematic of genetic recombination events in KTai65;SpcCreER mice to achieve specific oncogenic transformation and fluorescent labeling of type II alveolar cells. (B) Schematic detailing the formation and characterization of the epithelial-specific autochthonous mouse model. (C) Flow cytometry plot of macrophages isolated from naive lung or KTai65;SpcCreER tumors. (D) Stacked bar graph of myeloid cell frequencies from naive lung or KTai65;SpcCreER tumors. (E and G) Histogram plots of MFIs of surface markers in IMs (E) or AMs (G). (F and H) Fold-change expression of cell surface markers from IMs (F) or AMs (H) in KTai65;SpcCreER tumors compared to IMs or AMs from naive lung, respectively. Unpaired t test (*, P ≤ 0.05; **, P ≤ 0.01). Data are representative of three independent experiments.
Figure S2.
Figure S2.
Phagocytic TAMs have distinct cell surface phenotype in adenoviral autochthonous lung tumors in vivo. (A) Schematic of adenoviral lung tumor initiation in KrasLSL-G12D Trp53fl/fl Rosa26LSL-tdTomato mice. (B) Flow cytometry plots of tdTompos lung macrophages gated on CD64pos CD24neg cells isolated from autochthonous lung tumors. (C) Stacked bar graph of the frequencies of myeloid cell subsets gated on tdTompos or tdTomneg CD45pos CD11b/cpos cells in Adeno-SPCcre tumors. (D and E) MFIs of cell surface markers on tdTompos or tdTomneg IMs (D) or AMs (E) from autochthonous Ad-SPCcre lung tumors. Ordinary one-way ANOVA (*, P ≤ 0.05; **, P ≤ 0.01). Data are representative of at least three independent experiments.
Figure 3.
Figure 3.
Single-cell transcriptomic profiling identifies distinct and shared enrichment of metabolic and immune pathways in phagocytic tumor monocytes and macrophage subsets. (A) Schematic of scRNA-seq experiment detailing oligonucleotide-based sample hashing of microdissected tumors and adjacent normal tissue from KTai65;SpcCreER mice as well as FACS strategy for cell enrichment. Scale bar, 10 mm. (B) Stacked bar plot showing the number of single cells recovered from each library preparation and antibody hashtag classification. Hashtag labels are represented by animal identifiers. (C–E) UMAP projections of all cell types profiled by scRNA-seq. Cells are colored either by scRNA-seq library sample (C), by tissue of origin and tdTomato status (D), or by classified cell type (E). (F) Bubble plot showing expression of top three marker genes for each major cell type identified. Marker genes were determined by Wilcoxon test. (G) Violin plots of marker genes used to differentiate myeloid cell types. Marker genes were determined by Wilcoxon test. (H) Frequency of cell types for each grouping corresponding to tissue origin and phagocytic status. (I) Volcano plots of significantly enriched genes determined by MAST in tumor tdTompos AMs, IMs, or monocytes identified after differential expression analysis. Top differentially expressed genes are colored by gene function. Anti-inflam. = anti-inflammatory; Ag. present. = antigen presentation. (J) Differential expression of selected genes organized by function in tumor tdTompos versus tumor tdTomneg monocytes, IMs, and AMs. Anti-inflam. = anti-inflammatory; Ag. present. = antigen presentation; Costim. = costimulatory; P value = FDR-adjusted P value.
Figure S3.
Figure S3.
Dissection, FACS, and scRNA-seq quality filtering of autochthonous KTai65;SpcCreER lung tumors. (A) Fluorescent images of whole lung and dissected lung isolated from SPCcreER mice. White box around the uninvolved tdTomneg image depicts uninvolved lung tissue, and a tdTompos tumor is shown in the same image to show light intensity settings of the fluorescence camera. Scale bar, 10 mm. (B) Gating strategy for cell sorting for scRNA-seq of tdTompos or tdTomneg myeloid and neoplastic cells from SPCcreER tumor-bearing mice or naive controls. (C) Sequencing quality metrics for each FACS-enriched 10X Chromium library preparation sample after removal of outlier and low-quality cell barcodes (see Materials and methods). Box plot lines correspond to the median and the interquartile range. (D) Heatmap showing log-normalized expression values of each of the six antibody hashtags used for each cell barcode. (E and F) UMAP projection of filtered cell barcodes colored by pArtificial Nearest Neighbors (pANN) score (E) and the resulting pANN classification of singlets vs. multiplets (F). (G) Confusion matrix showing the detection of cell barcode singlets and doublets by antibody-based sample hashing and by the pANN classifier. (H) Silhouette distribution plots for subsampled cells at different clustering resolution parameters of the Louvain algorithm, calculated using chooseR. Red line depicts optimal resolution parameter used for cell state classification. (I) Heatmap of all cell clusters identified and the averaged log-normalized expression of distinguishing marker genes. (J) Cell-cycle scores for G1, S, and G2/M phases of each cell state. Box plot lines correspond to the median and the interquartile range.
Figure 4.
Figure 4.
PHAT gene signature defined using an autochthonous model correlates with other phagocytosis-associated macrophage populations and with decreased survival in human LUAD. (A) Venn diagram of genes upregulated (fold change > 1.2; FDR < 0.05) in PHAT AMs, IMs, and monocytes. (B) DAVID KEGG Pathway analysis of 123 PHAT signature genes shared in tdTompos AM, IMs, and monocytes. (C) Ingenuity Pathway Analysis of metabolic pathway z-score enrichment above twofold threshold in tdTompos AMs, IMs, and monocytes relative to tdTomneg AMs, IMs, and monocytes. (D) DAVID KEGG Pathway analysis of 233 PHAT-Macrophage signature genes shared in tdTompos AM and IM. (E) Heatmap showing log-normalized RNA-seq expression values of neoplastic cell and alveolar macrophage markers for sorted tumor tdTompos AMs, naive tdTomneg AMs, tdTompos neoplastic cells, and tdTomneg type II alveolar cells. Log fold-change values between phagocytic tdTompos AMs and neoplastic cells were determined using DESeq2 and are listed to the left of the heatmap. (F) Violin plots depicting PHAT signature score for WT and MerTK/ (kinase-deficient) efferocytic murine macrophage subsets co-cultured with apoptotic cells (Lantz et al. 2020). Statistical significance was determined by unpaired Wilcoxon test. (G) Left: Jaccard index values measuring marker gene overlap between the PHAT-IM signature and adipose stromal murine macrophage subsets after classical (Listeria monocytogenes) and type II (Heligmosomoides polygyrus) immune challenges (Sanin et al. 2022). Right: Jaccard index values measuring marker gene overlap between the PHAT signature and murine macrophage subsets integrated across nine tissues and multiple inflammatory conditions (Sanin et al. 2022). (H) Jaccard index values measuring marker gene overlap between the PHAT-IM signature and murine and human adipose tissue macrophage subsets (Jaitin et al. 2019). LAM = lipid-associated macrophage. P values for G and H were determined using Fisher’s exact test. (I and J) Kaplan–Meier survival curve of 396 LUAD patients (I) or 390 head and neck squamous cell carcinoma (HNSC) patients (J), stratified by high (>60th percentile) or low (<40th percentile) PHAT signature enrichment (TCGA). P values were calculated by Cox regression. HR = hazard ratio. (K) Enrichment of PHAT, M1 CIBERSORT, or M2 CIBERSORT signatures in myeloid cells isolated from tumor or normal tissue (UCSF Immunoprofiler dataset). One-tailed t test with two-sample unequal variance, tumor vs. normal.
Figure 5.
Figure 5.
Phagocytic AMs have distinct expression of genes involved in tissue remodeling in vivo. (A and B) UMAP projection of AMs following spectral embedding using diffusion maps. Cells are colored by AM cell state (A) or tissue and phagocytic status (B). (C) Trajectory inference of AMs using Slingshot. (D). Frequency of tdTompos cells for each maturation trajectory identified by Slingshot (n = 3 animals per group, Wilcoxon rank sum test). (E and F) Density plots across pseudotime for AMs grouped by tissue and phagocytic status (E) or by AM cell state (F). Dotted black line depicts the pseudotime value with highest frequency of tdTompos tumor cells. (G) Schematic depicting the relative maturation relationship between AM cell states as inferred by Slingshot and RNA velocity. (H) Density plot of expression of PHAT signature across pseudotime for each AM trajectory. Dotted black line depicts the pseudotime value with highest frequency of tdTompos tumor cells. (I) Bubble plots showing differentially expressed genes (Log2FC > 1.2 and P < 0.05) for each AM trajectory. Statistical significance between different trajectories was determined using MAST.
Figure S4.
Figure S4.
Alveolar macrophage and interstitial macrophage transcriptional heterogeneity differs across lung tissue type and phagocytosis status. (A) Top five marker genes defining each AM cell state from KTai65;SpcCreER tumors and naive tissue. Marker genes were determined by Wilcoxon test. (B) Frequency of each AM cell state delineated by tissue and tdTom cell sorting status. (C) Absolute numbers of each monocyte and IM cell state, delineated by tissue and tdTom (phagocytic) status. (D) UMAP projection showing trajectory inference of AMs using dynamic RNA velocity modeling. Arrows represent the direction of AM maturation. (E) Volcano plot showing differential expression (MAST) between AM-4 cell state between AM-Trajectory A and AM-Trajectory C. Top 10 genes upregulated in AM-Trajectory A and AM-Trajectory C are shown in red and blue, respectively. (F) Density plot of selected genes across pseudotime for each AM trajectory. (G) Top five marker genes defining each monocyte and IM cell state from SPCcreER tumors and naive tissue. Marker genes were determined by Wilcoxon test. (H) Frequency of each monocyte and IM cell state delineated by tissue and tdTom (phagocytic) status. (I) Absolute numbers of each AM cell state, delineated by tissue and tdTom (phagocytic) status. (J) UMAP projecting showing trajectory inference of Mono-IM trajectories using dynamic RNA velocity modeling. Arrows represent the direction of Mono-IM maturation. (K) Density plot of selected genes across pseudotime for each IM-Mono trajectory.
Figure 6.
Figure 6.
Phagocytic interstitial macrophages acquire differentiated metabolic and immune states from monocytes. (A and B) UMAP projections of monocytes and interstitial macrophages following spectral embedding using diffusion maps, highlighting cell state (A) and tissue and phagocytic status (B). (C) Trajectory inference of monocytes and IMs using Slingshot. (D) Frequency of tdTompos cells for each maturation trajectory identified by Slingshot (n = 3 animals per group, Wilcoxon rank sum test). (E and F) Density plots across pseudotime for monocytes and IMs grouped by tissue and phagocytic status (E) and cell state (F). Dotted black line depicts the pseudotime value with highest frequency of tdTompos tumor cells. (G) Schematic depicting the relative maturation relationship between Mono-IM cell states as inferred by Slingshot and RNA velocity. (H) Density plot of expression of PHAT signature across pseudotime for each IM trajectory. Dotted black line depicts the pseudotime value with highest frequency of tdTompos tumor cells. (I) Bubble plots showing differentially expressed genes (log2FC > 1.2 and P < 0.05) for each monocyte/IM trajectory. Statistical significance between different trajectories was determined using MAST.
Figure 7.
Figure 7.
Tumor-associated tdTompos dendritic cells acquire an mregDC phenotype. (A) Cell frequency plots for each cDC cell state, delineated by tissue and phagocytic status. (B) Violin plot showing PHAT signature scores for cDC grouped by tissue and phagocytic status. (C) Volcano plot of differentially expressed genes between tdTompos and tdTomneg DC1s (cDC.Xcr1). PHAT-Macrophage signature genes are highlighted in red. Statistical significance was determined using MAST. (D) Venn diagram showing overlapping genes between PHAT-cDC signature and PHAT-Macrophage signature. (E–G) UMAP projections of cDCs, highlighting cDC subsets (E, left), tissue/phagocytic status (E, right), pseudotime-based trajectory inference using Slingshot (F), and dynamic RNA velocity trajectory inference (G). (H) Heatmap of genes that are differentially expressed along cDC trajectory. Gene groupings were determined by hierarchical clustering of genes by expression pattern. Genes highlighted in red depict mreg-DC marker genes reported by Maier et al., (2020). Statistical significance of genes across the single cDC trajectory was determined by Wald test after fitting the data using a generalized additive model.
Figure S5.
Figure S5.
Phagocytic tumor monocytes and macrophage subsets have increased mitochondrial content and cellular respiration. (A) MFI of MitoTracker staining within tdTompos (red) or tdTomneg immune cell populations isolated from autochthonous KPT;AdenoSPCcre or KPT syngeneic lung tumors. (B and C) Spare respiratory capacity calculated from basal OCR and OCR after oligomycin treatment in AMs (B) or IMs (C). (D) Histogram plots of intracellular flow cytometry staining of metabolic enzymes (ATP5A, CPT1A, and GLUT1) by MET-FLOW in IMs, AMs, CD11bpos DCs, or CD11bneg DCs sorted from KT;Adeno-SPCcre lung tumors or naive lungs. (E) Histogram plots showing intracellular accumulation of 2-NBDG quantified by flow cytometry in IMs, AMs, CD11bpos DCs, or CD11bneg DCs sorted from KT;Adeno-SPCcre tumors or naive lung. Data are representative of three independent experiments.
Figure 8.
Figure 8.
Phagocytic TAMs have increased oxygen consumption ex vivo. (A and B) MitoTracker staining of tdTompos or tdTomneg AMs (A) or IMs (B) sorted by FACS from Adeno-SPCcre lung tumors. (C and D) Extracellular flux analysis of the OCR of sorted AMs (C) or IMs (D) with inhibitors or agonists of the OXPHOS pathway. (E and F) Quantification of the basal, maximal, or non-mitochondrial respiration in sorted tdTompos or tdTomneg AMs (E) or IMs (F). (G and H) Extracellular flux quantification of basal OCR and ECAR for sorted AMs (D) or IMs (E) isolated from AdenoSPCcre lung tumors ex vivo. Ordinary one-way ANOVA (*, P ≤ 0.05; **, P ≤ 0.01; ***, P ≤ 0.001; ****, P ≤ 0.0001). Data are representative of three independent experiments.
Figure 9.
Figure 9.
Phagocytic tumor macrophages upregulate both OXPHOS and glycolytic metabolism in vivo. (A) H&E and immunofluorescence imaging of autochthonous lung tumors stained for RFP, ATP5A, and DAPI. (B–E) Quantification of ΔMFI from tdTomneg and tdTompos IM (B), AM (C), CD11b-pos DC (D), and CD11b-neg DC (E) after intracellular MET-FLOW staining for metabolic enzymes. (F–I) Quantification of ΔMFI from tdTomneg and tdTompos IM (F), AM (G), CD11b-pos DC (H), and CD11b-neg DC (I) after intracellular quantification of 2-NBDG using flow cytometry. (J) Schematic detailing the predominance of AM populations found in autochthonous lung tumors and the metabolic and immune phenotypes of the PHAT signature found in phagocytic TAMs. Ordinary one-way ANOVA (*, P ≤ 0.05; **, P ≤ 0.01; ***, P ≤ 0.001; ****, P ≤ 0.0001; n.s., P > 0.05). Data are representative of three independent experiments.

References

    1. A-Gonzalez, N., Bensinger S.J., Hong C., Beceiro S., Bradley M.N., Zelcer N., Deniz J., Ramirez C., Díaz M., Gallardo G., et al. . 2009. Apoptotic cells promote their own clearance and immune tolerance through activation of the nuclear receptor LXR. Immunity. 31:245–258. 10.1016/j.immuni.2009.06.018 - DOI - PMC - PubMed
    1. A-Gonzalez, N., Quintana J.A., García-Silva S., Mazariegos M., González de la Aleja A., Nicolás-Ávila J.A., Walter W., Adrover J.M., Crainiciuc G., Kuchroo V.K., et al. . 2017. Phagocytosis imprints heterogeneity in tissue-resident macrophages. J. Exp. Med. 214:1281–1296. 10.1084/jem.20161375 - DOI - PMC - PubMed
    1. Ahl, P.J., Hopkins R.A., Xiang W.W., Au B., Kaliaperumal N., Fairhurst A.M., and Connolly J.E.. 2020. Met-Flow, a strategy for single-cell metabolic analysis highlights dynamic changes in immune subpopulations. Commun. Biol. 3:305. 10.1038/s42003-020-1027-9 - DOI - PMC - PubMed
    1. Allard, B., Panariti A., and Martin J.G.. 2018. Alveolar macrophages in the resolution of inflammation, tissue repair, and tolerance to infection. Front. Immunol. 9:1777. 10.3389/fimmu.2018.01777 - DOI - PMC - PubMed
    1. Andreatta, M., and Carmona S.J.. 2021. UCell: Robust and scalable single-cell gene signature scoring. Comput. Struct. Biotechnol. J. 19:3796–3798. 10.1016/j.csbj.2021.06.043 - DOI - PMC - PubMed

Publication types