. 2023 May 1;222(5):e202103098.
doi: 10.1083/jcb.202103098. Epub 2023 Mar 30.

Endothelial depletion of Atg7 triggers astrocyte-microvascular disassociation at blood-brain barrier

Affiliations

Endothelial depletion of Atg7 triggers astrocyte-microvascular disassociation at blood-brain barrier

Hui Liu et al. J Cell Biol. .

Abstract

Microvascular basement membrane (BM) plays a pivotal role in the interactions of astrocyte with endothelium to maintain the blood-brain barrier (BBB) homeostasis; however, the significance and precise regulation of the endothelial cell-derived BM component in the BBB remain incompletely understood. Here, we report that conditional knockout of Atg7 in endothelial cells (Atg7-ECKO) leads to astrocyte-microvascular disassociation in the brain. Our results reveal astrocytic endfeet detachment from microvessels and BBB leakage in Atg7-ECKO mice. Furthermore, we find that the absence of endothelial Atg7 downregulates the expression of fibronectin, a major BM component of the BBB, causing significantly reduced coverage of astrocytes along cerebral microvessels. We reveal Atg7 triggers the expression of endothelial fibronectin via regulating PKA activity to affect the phosphorylation of cAMP-responsive element-binding protein. These results suggest that Atg7-regulated endothelial fibronectin production is required for astrocytes adhesion to microvascular wall for maintaining the BBB homeostasis. Thus, endothelial Atg7 plays an essential role in astrocyte-endothelium interactions to maintain the BBB integrity.


Conflict of interest statement

Disclosures: The authors declare no competing interests exist.

Figures
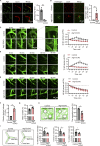
Figure 1.
Figure 1.
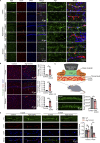
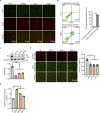
Endothelial deletion of Atg7 causes BBB leakage in mice. (A) The brain slices were prepared from the Atg7-ECKO mice, with wild-type littermate as control. Immunostaining was performed with the antibodies recognizing Atg7 (green) and CD31 (red). The stained slices were mounted and visualized by confocal microscopy. The representative images of the cortex were presented (left). Scale bar, 10 μm. The vascular expression of Atg7 was quantified as relative level of Atg7 fluorescence intensity in the CD31 positive area (mean ± SD; right). n = 6. ***, P < 0.001. Unpaired two-tailed Student’s t test for comparison of two groups. (B) Immunofluorescence was performed with the brain slices from the Atg7-ECKO mice, with wild-type littermate as control. The slices were stained with antibodies against fibrinogen (green) and CD31 (red). The stained slices were mounted and visualized by confocal microscopy, and then the representative images of the cortex were presented (left). Scale bar, 20 μm. The fibrinogen positive area outside the blood vessels in the brain parenchyma was quantified (right). Data were shown as mean ± SD, n = 5. **, P < 0.01. Unpaired two-tailed Student’s t test for comparison of two groups. (C–E) The 2-mo-old Atg7-ECKO mice were used for in vivo two-photon imaging, with wild-type littermate as control. The thinned-skull cranial windows were prepared and covered with glass coverslip. The mice were anesthetized and head-fixed for imaging under two-photon microscope. The 40 kD (C), 70 kD (D), and 150 kD (E) FITC-dextran (0.25 mg/g body weight, dissolved in saline) were injected to the tail vein immediately before imaging. Time-lapse images were acquired with water immersion 20× objective excited by an 800 nm laser beam at indicated time points. Representative time-lapse images of the parietal cortex were provided (left). The area with dotted line indicated the extravascular FITC-dextran in the brain parenchyma. Scale bar, 50 μm. The relative changes of the extravascular FITC-dextran over time were measured as ΔF/F0 = (Ftime − F0)/F0, where Ftime is the fluorescence intensity at each time points and F0 is the initial fluorescence intensity (right). Data were shown as mean ± SD, n = 6. (F) 70-kD FITC-dextran (0.25 mg/g body weight) dissolved in saline was injected to the mice through the tail vein. 50 min later, the brains were harvested and homogenized, and the fluorescence intensity of FITC-dextran was measured by microplate reader. Data were normalized to control and presented as mean ± SD, n = 3. **, P < 0.01. Unpaired two-tailed Student′s t test for comparison of two groups. (G) The mice brain was harvested and weighed for wet weight. Then the brain was dried for 4 d at 85°C to measure the dry weight. Brain water content was calculated as (wet weight − dry weight)/wet weight × 100%. Data were shown as mean ± SD, n = 6. *, P < 0.05. Unpaired two-tailed t test for comparison of two groups. (H) The NOR test was performed to assess recognition memory performance in the Atg7-ECKO mice, with wild-type littermate as control. 24 h after habituation, the mice were trained in a 10-min-long session during which they were placed at the center of the box in the presence of two identical objects. 1 h after training, the mice were placed in the same box for the test session, in which one of the objects was replaced by a novel object. The representative motion tracks of the test session were showed (left). The recognition index was calculated by the ratio of the time spent exploring the novel object to the total time spent exploring both the novel and familiar objects (right). Data were shown as mean ± SD, n = 6. *, P < 0.05. Unpaired two-tailed Student’s t test for comparison of two groups. (I) The Y maze test was performed to assess spatial memory of the Atg7-ECKO mice, with wild-type littermate as control. The mice were trained for 10 min in both starting and familiar arms. 1 h later, the mice were returned to the maze at the starting arm, with free access to all three arms, and were allowed 5 min to explore the maze. The representative motion tracks of the test session were provided (left). The exploration ambulation, time, number in the novel arm was quantified in percent of both novel and familiar arms (right). Data were shown as mean ± SD, n = 6. *, P < 0.05. Unpaired two-tailed Student’s t test for comparison of two groups.
Figure S1.
Figure S1.
Identification and characterization of the mice with endothelial deletion of Atg7. (A) The brain slices were prepared from the Atg7-ECKO mice, with wild-type littermate as control. Immunostaining was performed with the antibodies recognizing Atg7 (green) and CD31 (red). DAPI (blue) was used for counterstaining. The stained slices were mounted and visualized by confocal microscopy. The representative images of the cortex, hippocampus, and striatum were presented (left). Scale bar, 50 μm. The zoomed-in views (right) are the areas indicated by the dotted lines on the left. Scale bar, 10 μm. (B) Immunofluorescence was performed with the brain slices from the Atg7-ECKO mice, with wild-type littermate as control. The slices were stained with antibodies against fibrinogen (green) and CD31 (red). DAPI (blue) was used for counterstaining. The stained slices were mounted and visualized by confocal microscopy. The representative images of the cortex, hippocampus, and striatum were presented (left). Scale bar, 50 μm. The fibrinogen positive area outside the blood vessels in the brain parenchyma was quantified (right). Data were shown as mean ± SD, n = 4. **, P < 0.01. ***, P < 0.001. Unpaired two-tailed Student’s t test for comparison of two groups. (C) Schematic diagram of the two-photon imaging system for in vivo imaging of cerebral blood vessels in mice. Mice were anesthetized and the cranium was firmly secured in a stereotaxic frame. The dental drill was then used to create a thinned-skull circular cranial window (4 mm in diameter) over the parietal cortex. A sterile 3 mm glass coverslip was then placed above the thinned-skull and sealed with 3 M Vetbond tissue adhesive. After recovering for 3 d, in vivo time-lapse images were acquired at 5, 10, 15, 20, 30, 40, 50, 60, 70, 80, 90 min after FITC-dextran injection with two-photon microscope (Zeiss LSM880). (D) The brain slices were prepared from the Atg7-ECKO mice, with wild-type littermate as control. Immunostaining was performed with the antibodies recognizing NeuN (a neuronal marker, green). The stained slices were mounted and visualized by confocal microscopy. The representative images of the hippocampus were presented (left). Scale bar, 50 μm. The number of NeuN+ cells was quantified (right). Data were shown as mean ± SD, n = 4. *, P < 0.05. Unpaired two-tailed Student’s t test for comparison of two groups. (E) The brain slices were prepared from the Atg7-ECKO mice, with wild-type littermate as control. Immunostaining was performed with the antibodies recognizing fibronectin (FN; green) and CD31 (red). DAPI (blue) was used for counterstaining. The stained slices were mounted and visualized by confocal microscopy. The representative images of the cortex were presented (left). Scale bar, 20 μm. The vascular expression of fibronectin was quantified as relative level of fibronectin fluorescence intensity in the CD31 positive area (mean ± SD, n = 3; right). The ns represents no statistical significance. *, P < 0.05. Unpaired two-tailed Student’s t test for comparison of two groups.
Figure 2.
Figure 2.
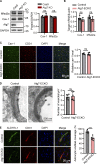
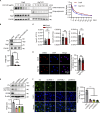
Detachment of astrocytic endfeet from cerebral microvessels in mice with endothelial deletion of Atg7. (A) The brain microvessel lysate were obtained from Atg7-ECKO mice, with wild-type littermate as control. The expression of occludin and claudin-5 were analyzed by Western blot, with β-actin as an internal loading control. The band densities were quantified by ImageJ software and normalized to the control. Data were shown as mean ± SD (n = 3). The ns represents no statistical significance. Unpaired two-tailed Student’s t test for comparison of two groups. (B) Brain microvessels were isolated from Atg7-ECKO mice, with wild-type littermate as control. The mRNA levels of occludin and claudin-5 were analyzed by RT-qPCR, with β-actin used as an internal control. Data were shown as the mean ± SD (n = 3). The ns represents no statistical significance. Unpaired two-tailed Student’s t test for comparison of two groups. (C) The brain slices were prepared from the Atg7-ECKO mice, with wild-type littermate as control. Immunostaining was performed with the antibodies against CD13 (green, a pericyte marker) and CD31 (red). DAPI (blue) was used for counterstaining. The stained slices were mounted and visualized by z-stack confocal imaging with 63× objective. The representative images of the cortex were presented (left). The zoomed-in views (middle) show the 3D reconstruction of CD13+ pericytes (green) covering CD31+ vessels (red). The pericyte coverage along the vessels was quantified by dividing the total area of the vessels by the area of the pericyte in contact with the vessels (right). For quantifications, 30 vessels from five mice were analyzed in each group (right). Data were shown as mean ± SD (n = 5). The ns represents no statistical significance. Unpaired two-tailed Student’s t test for comparison of two groups. (D and E) Similar experiments were performed as in C, except that the CD13 antibody was replaced by GFAP (astrocyte marker; D) or AQP4 (astrocytic endfeet marker; E). For quantifications, 30 vessels from six or four mice were analyzed in each group. Data were shown as mean ± SD (n = 6, D; n = 4, E). **, P < 0.01. Unpaired two-tailed Student’s t test for comparison of two groups. (F) The brain cortex samples from the Atg7-ECKO mice were subjected to TEM analysis, with wild-type littermate as control. Representative electron micrograph of perivascular astrocytes was provided (left). The zoomed-in views (middle) show astrocytic endfeet (shaded in red) covering vessels. L, the lumen of the blood microvessels. The astrocytic endfeet coverage around the vessels was calculated as the length of the lumen in contact with the red shaded part divided by the total length of the lumen (right). For quantifications, 30 vessels from six mice were analyzed in each group (right). Data were shown as mean ± SD (n = 6). ***, P < 0.001. Unpaired two-tailed Student’s t test for comparison of two groups. Source data are available for this figure: SourceData F2.
Figure S2.
Figure S2.
Atg7 deletion in HBMECs reduces the expression of fibronectin but not occludin and claudin-5. (A) Atg7-knockout (KO) of HBMECs were constructed using CRISPR/Cas9-mediated genome editing in vitro. HBMECs were infected by lentivirus containing the cDNA of Cas9 together with sgRNA targeting the first exon of Atg7. 48 h after infection, blasticidin (3 μg/ml) and puromycin (1 μg/ml) were used for screening of positive infected cells. The cells were collected for protein extraction, and Western blot was performed to detect the knockout effect of Atg7 in HBMECs. Lentivirus containing the cDNA of Cas9 alone was used as a control. (B) The cells were lysed, and Western blot was performed to determine the protein levels of occludin and claudin-5 in Atg7 KO HBMECs, with HBMECs transfected with Cas9 alone as control. β-Actin was used as an internal loading control. The band densities were quantified by ImageJ software and normalized to the control. Data were shown as mean ± SD (n = 3). The ns represents no statistical significance. Unpaired two-tailed Student’s t test for comparison of two groups. (C) The subcellular fractions, including membrane, cytoplasm, and nucleus fractions, were extracted from the Atg7-KO HBMECs and the control cells using the Minute Plasma Membrane Protein Isolation and Cell Fractionation Kit (Invent Biotechnologies) according to the manufacturer’s instructions. Western blot was performed to determine subcellular distribution of occludin and claudin-5 in the cells. Na+/K+ ATPase α1, lamin A+C, and β-tubulin were detected as the marker for membrane, cytoplasm, and nucleus, respectively. The band densities were quantified by ImageJ software. The distribution of occludin and claudin-5 in each fraction was calculated as the percentage of total. Data were shown as mean ± SD (n = 3). The ns represents no statistical significance. Unpaired two-tailed Student’s t test for comparison of two groups. Source data are available for this figure: SourceData FS2.
Figure S3.
Figure S3.
Atg7 deletion has no effect on caveolae-mediated transcytosis. (A) The cells were lysed, and Western blot was performed to determine the protein levels of Cav-1 and Mfsd2a in Atg7-knockout (KO) HBMECs, with HBMECs transfected with Cas9 alone as control. GAPDH was used as an internal loading control. The band densities were quantified by ImageJ software and normalized to the control. Data were shown as mean ± SD (n = 3). The ns represents no statistical significance. Unpaired two-tailed Student’s t test for comparison of two groups. (B) Brain microvessels were isolated from Atg7-ECKO mice, with wild-type littermate as control. The mRNA levels of Cav-1 and Mfsd2a were analyzed by qRT-PCR, with β-actin used as an internal control. Data were shown as the mean ± SD (n = 3). The ns represents no statistical significance. Unpaired two-tailed Student’s t test for comparison of two groups. (C) The brain slices were prepared from the Atg7-ECKO mice, with wild-type littermate as control. Immunostaining was performed with the antibodies recognizing Cav-1 (green) and CD31 (red). DAPI (blue) was used for counterstaining. The stained slices were mounted and visualized by confocal microscopy. The representative images of the cortex were presented (left). Scale bar, 50 μm. The vascular expression of Cav-1 was quantified as relative level of Cav-1 fluorescence intensity in the CD31 positive area (mean ± SD; right). n = 6. The ns represents no statistical significance. Unpaired two-tailed Student’s t test for comparison of two groups. (D) The cerebral cortex from the Atg7-ECKO mice were subjected to TEM analysis, with wild-type littermate as control. Representative electron micrograph of caveolae vesicles (arrows) in the endothelium were provided (left). Scale bar, 500 nm. The number of vesicles was quantified (right). 30 vessels from six mice were used for statistical analysis. Data were shown as mean ± SD, n = 6. The ns represents no statistical significance. Unpaired two-tailed Student’s t test for comparison of two groups. (E) The brain slices were prepared from the Atg7-ECKO mice, with wild-type littermate as control. Immunostaining was performed with the antibodies recognizing ALDH1L1 (green) and CD31 (red). DAPI (blue) was used for counterstaining. The stained slices were mounted and visualized by confocal microscopy. The representative images of the cortex were presented (left). Scale bar, 20 μm. The astrocytic endfeet coverage along the vessels was quantified by dividing the total area of the vessels by the area of the astrocytes in contact with the vessels (right). Data were shown as mean ± SD (n = 6). ***, P < 0.001. Unpaired two-tailed Student’s t test for comparison of two groups. Source data are available for this figure: SourceData FS3.
Figure 3.
Figure 3.
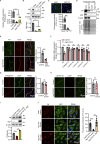
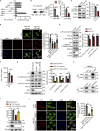
Knockout of Atg7 downregulates fibronectin in brain endothelial cells. (A) The mRNA levels of fibronectin (FN) in the CRISPR/Cas9-mediated Atg7-knockout (KO) HBMECs were determined by RT-qPCR, with Cas9-only as control. The β-actin was used as an internal control. Data were shown as mean ± SD (n = 3). ***, P < 0.001. Statistics were calculated by one-way ANOVA coupled with Dunnett’s post hoc test. (B) The cells were lysed and Western blot was performed to determine the protein levels of fibronectin in Atg7-knockout HBMECs, with β-actin as an internal loading control. The band densities were quantified by ImageJ software and normalized to the Cas9-only control cells. Data were shown as mean ± SD (n = 3). ***, P < 0.001. Statistics were calculated by one-way ANOVA coupled with Dunnett’s post hoc test. (C) The Atg7-KO HBMECs were seeded on coverslips and immunofluorescence was performed with antibody against fibronectin (green), with HBMECs transfected with Cas9 alone as control. DAPI (blue) was used for counterstaining. The representative images were presented (top). The fluorescence intensity of fibronectin was quantified (bottom). Data were shown as the mean ± SD (n = 6). ***, P < 0.001. Unpaired two-tailed Student’s t test for comparison of two groups. (D) The extracellular matrix (ECM) protein and total protein of the HBMECs were extracted, and Western blot was performed to determine the levels of fibronectin and Atg7 using β-actin as an internal loading control. The result of Coomassie blue staining was shown on the bottom, indicating consistent loading. (E) The brain slices were prepared from the Atg7-ECKO mice, with wild-type littermate as control. Immunostaining was performed with the antibodies recognizing fibronectin (green) and CD31 (red). DAPI (blue) was used for counterstaining. The stained slices were mounted and visualized by confocal microscopy. The representative images of the cortex were presented (left). The vascular expression of fibronectin was quantified as relative level of fibronectin fluorescence intensity in the CD31 positive area (mean ± SD, n = 6; right). ***, P < 0.001. Unpaired two-tailed Student’s t test for comparison of two groups. (F) Brain microvessels were isolated from Atg7-ECKO mice, with wild-type littermate as control. The mRNA levels of fibronectin, collagen IV, laminin subtypes (laminin α4, α5, β1, and γ1) were determined by RT-qPCR. β-Actin was used as an internal control. Data were shown as the mean ± SD (n = 3). **, P < 0.01. The ns represents no statistical significance. Unpaired two-tailed Student’s t test for comparison of two groups. (G and H) Similar experiments were performed as in E, except that the fibronectin antibody was replaced by collagen IV (G) or laminin β1 (H). The ns represents no statistical significance (n = 6). Unpaired two-tailed Student’s t test for comparison of two groups. (I and J) Full-length (FL) Atg7 cDNA was transfected to Atg7-KO HBMECs by adenovirus containing GFP, with adenovirus empty vector as control. 48 h after transfection, (I) the cells were lysed, and Western blot was performed to analyze the expression of fibronectin, using β-actin as an internal loading control. The band densities were quantified by ImageJ software and normalized to the control cells transfected with empty vector. Data were shown as mean ± SD (n = 3). **, P < 0.01. ***, P < 0.001. Statistics were calculated by one-way ANOVA coupled with Dunnett’s post hoc test. (J) Left: Immunofluorescence was conducted with antibody against fibronectin (red). DAPI (blue) was used for counterstaining (left). The cells were analyzed for fluorescence intensity of fibronectin (right, at least 20 cells per group). Data were shown as mean ± SD. ***, P < 0.001. Statistics were calculated by one-way ANOVA coupled with Dunnett’s post hoc test. Source data are available for this figure: SourceData F3.
Figure 4.
Figure 4.
Atg7-regulated fibronectin in endothelial cells is required for astrocyte adhesion and BBB integrity. (A) The cDNA encoding full length Atg7 or Atg7(C572S) mutant was transfected to Atg7-knockout (KO) HBMECs by adenovirus containing GFP, with empty vector as control. 48 h after transfection, the astrocytes stained with PKH26 dye were added to the wells of plate seeded with HBMECs to allow the adhesion to endothelial cells for 30 min. Then the culture medium was removed, washed twice with PBS, and replaced with imaging solution. The living cells were then imaged by fluorescence microscopy. The representative images were provided (left). The astrocytes adhered to the HBMECs was quantified (right). Data were shown as the mean ± SD (n = 6). **, P < 0.01. ***, P < 0.001. Statistics were calculated by one-way ANOVA coupled with Dunnett’s post hoc test. (B) Schematic diagram of the in vitro BBB model comprised of HBMECs grown on the upside of the membrane in the Transwell insert with astrocytes grown on the underside of the Transwell membrane. The 3.0 μm pores at the Transwell membrane allow the penetration of astrocytic processes to contact with the HBMECs (top). The in vitro BBB model comprised of Atg7-KO HBMECs co-cultured with astrocytes was established, with Cas9-only HBMECs co-cultured with astrocytes as control. When indicated, the Transwell membrane was precoated with recombinant fibronectin (FN). 4 d later, FITC-dextran with different molecular weight (40, 70, and 150 kD) was added to the upper chamber at a concentration of 1 mg/ml. 1 h later, the medium in the lower chamber was collected and fluorescence intensity was detected by microplate reader. Data are shown as the mean ± SD (n = 6; bottom). ***, P < 0.001. The ns represents no statistical significance. Statistics were calculated by one-way ANOVA coupled with Dunnett’s post hoc test. (C–G) The GFP-tagged AAV-BR1 vectors containing shRNA against fibronectin or scramble shRNA control were injected into the tail vein of wild-type mice at a dose of 5 × 10¹¹ genomic particles in total volume of 150 μl saline. 4 wk later, (C) the brain was harvested and sections were obtained for immunostaining with the antibodies recognizing fibronectin (red) and CD31 (gray). DAPI (blue) was used for counterstaining. The representative images of the cortex were shown (left). The vascular expression of fibronectin was quantified as relative level of fibronectin fluorescence intensity in the CD31 positive area (right; mean ± SD, n = 6). For quantifications, 30 vessels from six mice were analyzed in each group (right). ***, P < 0.001. Unpaired two-tailed Student’s t test for comparison of two groups. (D and E) The brain sections were obtained for immunostaining with the antibodies against GFAP (red; D), or AQP4 (red; E). GFP indicate the microvessels infected with AAV-BR1 virus. The stained slices were mounted and visualized by z-stack confocal imaging with 63× objective. The representative images of the cortex were presented (left). The zoomed-in views (middle) show the 3D reconstruction of astrocytes covering vessels. The astrocytic coverage at the vessels was quantified by dividing the total area of the vessels by the area of the astrocyte in contact with the vessels (right). For quantifications, 30 vessels from six mice were analyzed in each group. Data were shown as the mean ± SD (n = 6). ***, P < 0.001. Unpaired two-tailed Student’s t test for comparison of two groups. (F and G) 40 kD (F) or 70 kD (G) Texas-red-dextran (0.08 mg/g body weight, dissolved in saline) was injected to mice through the tail vein. 30 min later, the brains were harvested and the brain slices were prepared for confocal microscopy. Representative confocal images of the cortex are provided (left). The extravascular Texas-red-dextran in mice brain was quantified (right). Data were shown as mean ± SD (n = 6). ***, P < 0.001. Unpaired two-tailed Student’s t test for comparison of two groups.
Figure 5.
Figure 5.
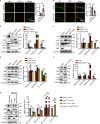
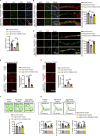
Atg7-regulated fibronectin expression is autophagy independent. (A and B) The brain microvessels were isolated from Atg7-ECKO mice, with wild-type littermate as control. Immunostaining was performed with the antibodies against p62 (A) or LC3 (B; green) together with CD31 antibody (red). DAPI (blue) was used for counterstaining. The vascular expression of p62 or LC3 was quantified as relative level of p62 or LC3 fluorescence intensity in the CD31 positive area (mean ± SD; right). n = 6. ***, P < 0.001. Unpaired two-tailed Student’s t test for comparison of two groups. (C–E) The stable HBMEC cell lines with knockout of Atg genes were established. Then the cells were lysed and Western blot was performed to determine the protein levels of fibronectin (FN), p62, and LC3 in HBMECs with knockout of Atg7 (C), Atg5 (D), or Atg6 (E). β-Actin or GAPDH was used as an internal loading control. Representative images were presented (left). The band densities were quantified by ImageJ software and normalized to the Cas9-only control cells (right). Data were shown as mean ± SD (n = 3). *, P < 0.05. **, P < 0.01. ***, P < 0.001. Statistics were calculated by one-way ANOVA coupled with Dunnett’s post hoc test. (F) The stable HBMEC cell line with the endogenous Atg7 gene genetically replaced with Atg7(C572S) were established. The cells were lysed and Western blot was performed to determine the protein levels of fibronectin, p62, and LC3, with β-actin as an internal loading control. The band densities were quantified by ImageJ software and normalized to the Cas9-only control cells. Data were shown as mean ± SD (n = 3). **, P < 0.01. ***, P < 0.001. The ns represents no statistical significance. Unpaired two-tailed Student’s t test for comparison of two groups. (G) The adenovirus containing cDNA encoding full-length (FL) Atg7 or Atg7(C572S) mutant was introduced to Atg7-knockout (KO) HBMECs, respectively, with adenovirus empty vector as control. 48 h later, the cells were lysed and Western blot was performed to analyze the expression of Atg7, fibronectin, p62, and LC3, with GAPDH as an internal loading control. The band densities were quantified by ImageJ software and normalized to the control cells transfected with empty vector. Data were shown as mean ± SD (n = 3). ***, P < 0.001. The ns represents no statistical significance. Statistics were calculated by one-way ANOVA coupled with Dunnett’s post hoc test. Source data are available for this figure: SourceData F5.
Figure S4.
Figure S4.
Endothelial knockdown of fibronectin reduces astrocyte adhesion and increases the permeability of in vitro BBB model. (A) Recombinant GFP-tagged AAV-BR1 virus were injected into the tail vein at a dose of 5 × 10¹¹ genomic particles in total volume of 150 μl saline. 4 wk after AAV infection, the brain, kidney, liver, and heart were harvested, and sections were obtained for immunofluorescence staining with CD31 antibody (red). Representative confocal images were provided. Scale bar, 50 μm. (B) Recombinant GFP-tagged AAV-BR1 virus were injected into the tail vein of mice as in A, and mice infected with 150 μl saline served as the control group. 4 wk after AAV infection, the brain tissue was harvested and the cell suspension was subjected to flow cytometry with antibody recognizing CD31 and GFP. The transduction efficiency of AAV-BR1 virus in brain endothelial cells was quantified by the proportion of GFP positive cells in CD31 positive cells. Data were shown as the mean ± SD (n = 3). ***, P < 0.001. Unpaired two-tailed Student’s t test for comparison of two groups. (C and D) HBMECs were transfected with siRNAs against fibronectin (FN) or non-silencing control siRNA (NC). 48 h after transfection, (C) cell lysates were subjected to Western blot analysis to detect the cellular expression of fibronectin. β-Actin was used as an internal loading control. The band densities were quantified by ImageJ software and normalized to the NC group. Data were shown as the mean ± SD (n = 3). ***, P < 0.001. Statistics were calculated by one-way ANOVA coupled with Dunnett’s post hoc test. (D) Astrocytes stained with PKH26 dye were added to the well of 24-well plate seeded with HBMECs to allow the adhesion to endothelial cells for 30 min. After that, the culture medium was removed, plates were washed twice with PBS, and imaging solution was added to the plates. Finally, cells were imaged by fluorescence microscopy. The representative images were provided (left). Scale bar, 100 μm. The number of astrocytes adhered to the HBMECs was quantified (right). Data were shown as the mean ± SD (n = 6). ***, P < 0.001. Statistics were calculated by one-way ANOVA coupled with Dunnett’s post hoc test. (E) In vitro BBB model consisting of HBMECs and astrocytes was constructed. 24 h later, siRNAs against fibronectin of HBMECs or negative control siRNA (NC) were transfected to HBMECs. 72 h after transfection, 40-kD FITC-dextran was added into the upper chamber of the Transwell at a concentration of 1 mg/ml, with 600 μl serum-free basal medium added to the lower chamber. After incubation for 1 h, the medium in the lower chamber was collected to detect the fluorescence intensity using microplate reader. Data were shown as the mean ± SD (n = 5). *, P < 0.05. Statistics were calculated by one-way ANOVA coupled with Dunnett’s post hoc test. Source data are available for this figure: SourceData FS4.
Figure S5.
Figure S5.
The fibronectin reduction induced by Atg7 depletion is independent of autophagy inhibition. (A) Brain microvessels were isolated from Atg7-ECKO mice, with wild-type littermate as control. The protein levels of Atg7 and p62 were analyzed by Western blot, with β-actin used as an internal control. Data were shown as the mean ± SD (n = 3). *, P < 0.05. Unpaired two-tailed Student’s t test for comparison of two groups. (B and C) HBMECs were infected by lentivirus containing the cDNA of Cas9 together with sgRNA targeting the exon of Atg5 (B) or Atg6 (C). 48 h after infection, blasticidin (3 μg/ml) and puromycin (1 μg/ml) were used for screening of positive infected cells. The cells were collected for protein extraction, and Western blot was performed to detect the knockout (KO) effect of Atg5 (B) or Atg6 (C) in HBMECs. Lentivirus containing the cDNA of Cas9 alone was used as a control. (D and E) The HBMECs were treated with CQ (chloroquine, 10 μM) for 24 h, with the cells treated with vehicle as control. (D) The mRNA levels of fibronectin were determined by RT-PCR using β-actin as an internal control. Data were shown as the mean ± SD (n = 3). ***, P < 0.001. The ns represents no statistical significance. Statistics were calculated by one-way ANOVA coupled with Dunnett’s post hoc test. (E) The cells were lysed, and Western blot was performed to determine the protein levels of fibronectin and Atg7 using β-actin as an internal loading control. The band densities were quantified by ImageJ software and normalized to the control. Data were shown as mean ± SD (n = 3). ***, P < 0.001. The ns represents no statistical significance. Statistics were calculated by one-way ANOVA coupled with Dunnett’s post hoc test. (F) HBMECs cell lines with the endogenous Atg7 gene genetically replaced with Atg7(C572S) were constructed using CRISPR/Cas9 technology. The cells were collected for RNA extraction, and the extracted RNA was reverse transcribed into cDNA. The primers were designed for the Atg7 mutation site and the cDNA was used as template for PCR, and the amplified products were cloned into T vector for DNA sequencing. The sequencing results of wild-type Atg7 and Atg7(C572S) mutant cells were presented. Source data are available for this figure: SourceData FS5.
Figure S6.
Figure S6.
Analysis of the post-transcriptional regulation of fibronectin by Atg7 and the identification of CREB-dependent fibronectin expression. (A) The Atg7 KO HBMECs and control cells were treated with cycloheximide (CHX, 20 μg/ml) for indicated of times. The cell lysates were subjected to Western blot analysis to detect the expression of fibronectin (FN) and Atg7 (left). β-Actin was used as an internal loading control. The band densities were quantified by ImageJ software and normalized to the vehicle control. The rate of decay of fibronectin expression was plotted (right). Data were shown as the mean ± SD (n = 3). (B) The HBMECs were treated with MG132 (10 μM), with the cells treated with vehicle as control. The cell lysates were subjected to Western blot analysis to detect the expression of fibronectin and Atg7 (top). β-Actin was used as an internal loading control. The band densities were quantified by ImageJ software and normalized to the Cas9 group (bottom). Data were shown as the mean ± SD (n = 3). ***, P < 0.001. The ns represents no statistical significance. Statistics were calculated by one-way ANOVA coupled with Dunnett’s post hoc test. (C) The HBMEC lysates were subjected to the ChIP assay using the EST1, GATA2, and HOXB13 antibody, respectively. The immunoprecipitated DNA fragments were amplified by qPCR using the primers flanking the promoter regions of fibronectin gene. Data were shown as the mean ± SD (n = 3). The ns represents no statistical significance. Unpaired two-tailed Student’s t test for comparison of two groups. (D) The HBMECs were seeded on coverslips and immunofluorescence was performed with antibody against CREB (red). DAPI (blue) was used for counterstaining. The representative images were presented (left). The fluorescence intensity of CREB was quantified (right). A total of 40 cells were analyzed per group. Data were shown as the mean ± SD. The ns represents no statistical significance. Unpaired two-tailed Student’s t test for comparison of two groups. (E and F) HBMECs were transfected with siRNAs against CREB or non-silencing control siRNA (NC). 48 h after transfection, (E) cell lysates were subjected to Western blot analysis to detect the expression of fibronectin, CREB, and p-CREB (ser133), respectively (left). β-Actin was used as an internal loading control. The band densities were quantified by ImageJ software and normalized to the NC group (right). Data were shown as the mean ± SD. **P < 0.01. Statistics were calculated by one-way ANOVA coupled with Dunnett’s post hoc test. (F) Immunofluorescence was performed to analyze the cellular expression of fibronectin (green). DAPI (blue) was used for counterstaining (left). The fluorescence intensity of fibronectin was quantified (right). Data were shown as the mean ± SD. ***, P < 0.001. Statistics were calculated by one-way ANOVA coupled with Dunnett’s post hoc test. Source data are available for this figure: SourceData FS6.
Figure 6.
Figure 6.
Atg7 depletion downregulates fibronectin through inhibition of PKA/CREB signaling. (A) The pGL3-basic vectors carrying different truncations of the fibronectin (FN) promoter were cotransfected with pRL-TK into HEK293T cells. After 48 h, the cells were lysed and the luciferase activity was detected. (B) The cell lysates were subjected to ChIP assay using CREB (p-Ser133) antibody. The immunoprecipitated DNA fragments were amplified by qPCR using the primers flanking two different fragments within the promoter region of fibronectin gene. Data were shown as the mean ± SD (n = 3). ***, P < 0.001. Unpaired two-tailed Student’s t test for comparison of two groups. (C) The Atg7-knockout (KO) HBMECs were lysed, and then Western blot was performed to analyze the expression of CREB and phosphorylated CREB using antibodies against CREB and CREB (p-Ser133), respectively, with the Cas9-only HBMECs as control. The band densities were quantified by ImageJ software. The ratio of CREB (p-Ser133)/CREB was calculated and normalized to the Cas9-only control. Data were shown as the mean ± SD (n = 3). ***, P < 0.001. Unpaired two-tailed Student’s t test for comparison of two groups. (D) Full-length (FL) Atg7 cDNA was transfected to Atg7-KO HBMECs by adenovirus containing GFP, with empty adenovirus vector as control. Left: Immunofluorescence was conducted with antibody against CREB (p-Ser133; red). DAPI (blue) was used for counterstaining. Right: Fluorescence intensity of the CREB (p-Ser133) was quantified. A total of 30 cells were analyzed per group. Data were shown as the mean ± SD. ***, P < 0.001. Statistics were calculated by one-way ANOVA coupled with Dunnett’s post hoc test. (E) Western blot was performed to analyze the expression of PKA-C, p-PKA-C, AKT, p-AKT, ERK1/2, and p-ERK1/2 using the corresponding antibodies in Atg7-KO HBMEC, with the Cas9-only HBMECs as control. The band densities were quantified by ImageJ software. The relative protein levels were calculated and normalized to the Cas9-only control. Data were shown as the mean ± SD (n = 3). *, P < 0.05. The ns represents no statistical significance. Unpaired two-tailed Student’s t test for comparison of two groups. (F) The Atg7 KO HBMECs were lysed, and then the active form of PKA was measured using PKA Kinase Activity Assay, with the Cas9-only HBMECs as control. Data were shown as the mean ± SD (n = 4). **, P < 0.01. Unpaired two-tailed Student’s t test for comparison of two groups. (G) The HBMECs were treated with 8-Bromo-cAMP (50 μM) for 24 h, with the cells treated with vehicle as control. The cells were lysed, and Western blot was performed to determine the protein levels of fibronectin, CREB, p-CREB (Ser133), PKA-C, p-PKA-C (Thr197) using GAPDH as an internal loading control. The band densities were quantified by ImageJ software and normalized to the control. Data were shown as mean ± SD (n = 3). *, P < 0.05. ***, P < 0.001. Statistics were calculated by one-way ANOVA coupled with Dunnett’s post hoc test. (H) HBMECs lysates were immunoprecipitated with Atg7 (top) and PKA-C (bottom) antibody, respectively, and then the precipitated proteins were analyzed by Western blot using antibodies against Atg7 and PKA-C. IB, immunoblot. (I and J) The constitutively active CREB (S133D) mutant was transfected to Atg7-KO HBMECs by adenovirus containing GFP with empty adenovirus vector as control. 48 h after transfection, (I) cell lysates were subjected to Western blot analysis to detect the expression of fibronectin and Atg7, respectively. β-Actin was used as an internal loading control. The band densities were quantified by ImageJ software and normalized to the control group transfected by empty vector. Data were shown as the mean ± SD. **, P < 0.01, ***, P < 0.001. Statistics were calculated by one-way ANOVA coupled with Dunnett’s post hoc test. (J) Left: Immunofluorescence was performed to analyze the cellular expression of fibronectin (red). DAPI (blue) was used for counterstaining. Right: Fluorescence intensity of fibronectin was quantified. Data were shown as the mean ± SD. ***, P < 0.001. Statistics were calculated by one-way ANOVA coupled with Dunnett’s post hoc test. Source data are available for this figure: SourceData F6.
Figure 7.
Figure 7.
Exogenous expression of active CREB in brain endothelium protects the BBB from Atg7-knockout-induced disruption. (A–G) Recombinant GFP-tagged AAV-BR1 virus expressing constitutively active CREB (S133D) or empty vector virus were injected into the tail vein of mice at a dose of 5 × 10¹¹ genomic particles in total volume of 150 μl saline. 4 wk after injection, (A) the brain was harvested and sections were obtained for immunofluorescence staining. Representative confocal images (top) of brain cortex tissue sections stained with fibronectin (FN; red), CD31 (gray) were presented. DAPI (blue) was stained for counterstaining. The vascular expression of fibronectin was quantified as relative level of fibronectin fluorescence intensity in the CD31 positive area (mean ± SD, n = 6; bottom). ***, P < 0.001. Statistics were calculated by one-way ANOVA coupled with Dunnett’s post hoc test. (B and C) The brain sections were obtained for immunofluorescence staining. Immunostaining was performed with the antibodies against GFAP (B) or AQP4 (C; red) and CD31 (gray). DAPI (blue) was stained for counterstaining. The stained slices were mounted and visualized by z-stack confocal imaging with 63× objective. The representative images of the cortex were presented (left). The zoomed-in views (middle) show the 3D reconstruction of astrocytes covering vessels. The astrocytic endfeet coverage along the vessels was quantified by dividing the total area of the vessels by the area of the astrocytes in contact with the vessels (right). Data were shown as the mean ± SD (n = 6). **, P < 0.01; ***, P < 0.001. Statistics were calculated by one-way ANOVA coupled with Dunnett’s post hoc test. (D and E) (D) 40-kD or (E) 70-kD Texas-red-dextran (0.08 mg/g body weight, dissolved in saline) was injected to mice through the tail vein. 30 min later, the brains were harvested and brain slices were prepared for confocal microscopy. Representative confocal images of the cortex were provided (left). Scale bar, 50 μm. The extravascular Texas-red-dextran in mice brain was calculated and normalized to control (right). Data were shown as mean ± SD (n = 6). ***, P < 0.001. Statistics were calculated by one-way ANOVA coupled with Dunnett’s post hoc test. (F) The NOR test was performed to assess recognition memory performance in the mice. 24 h after habituation, the mice were trained in a 10-min-long session during which they were placed at the center of the box in the presence of two identical objects. 1 h after training, the mice were placed in the same box for the test session, in which one of the objects was replaced by a novel object. The representative motion tracks of the test session were shown (top). The recognition index was calculated by the ratio of the time spent exploring the novel object to the total time spent exploring both the novel and familiar objects (bottom). Data were shown as mean ± SD, n = 6. *, P < 0.05. Statistics were calculated by one-way ANOVA coupled with Dunnett’s post hoc test. (G) The Y maze test was performed to assess spatial memory of the mice. The mice were trained for 10 min in both start and familiar arms. 1 h later, the mice were returned to the maze at the starting arm, with free access to all three arms, and were allowed 5 min to explore the maze. The representative motion tracks of the test session were provided (top). The exploration time, ambulation, number of the novel arm was quantified in percent of both novel and familiar arms (bottom). Data were shown as mean ± SD, n = 6. *, P < 0.05. Statistics were calculated by one-way ANOVA coupled with Dunnett’s post hoc test.
Figure S7.
Figure S7.
Expression of active CREB in BMECs rescues the increased permeability induced by Atg7 knockout. (A) 70-kD FITC-dextran (0.25 mg/g body weight, dissolved in saline) was injected to mice through the tail vein. 50 min later, brains were harvested and homogenized, and the fluorescence intensity of FITC-dextran was measured by microplate reader. Data were shown as mean ± SD (n = 3). *, P < 0.05. Statistics were calculated by one-way ANOVA coupled with Dunnett’s post hoc test. (B) The in vitro BBB model was constructed with HBMECs grown on the upside of the membrane (3 μm pore) in the Transwell insert and astrocytes grown on the underside of the Transwell membrane. 24 h later, the full-length Atg7 cDNA or the constitutively active CREB (S133D) mutant were transfected to the Atg7-knockout (KO) HBMECs by adenovirus containing GFP, with empty vector as control. 72 h later, 70-kD FITC-dextran was added to the upper chamber at a concentration of 1 mg/ml, with 600 μl serum-free basal medium added to the lower chamber. 1 h later, the medium in the lower chamber was collected and the fluorescence intensity was detected by microplate reader. Data were shown as the mean ± SD (n = 3) **, P < 0.01; ***, P < 0.001. Statistics were calculated by one-way ANOVA coupled with Dunnett’s post hoc test.

References

    1. Abbott, N.J., Rönnbäck L., and Hansson E.. 2006. Astrocyte-endothelial interactions at the blood-brain barrier. Nat. Rev. Neurosci. 7:41–53. 10.1038/nrn1824 - DOI - PubMed
    1. Andreone, B.J., Chow B.W., Tata A., Lacoste B., Ben-Zvi A., Bullock K., Deik A.A., Ginty D.D., Clish C.B., and Gu C.. 2017. Blood-brain barrier permeability is regulated by lipid transport-dependent suppression of caveolae-mediated transcytosis. Neuron. 94:581–594.e5. 10.1016/j.neuron.2017.03.043 - DOI - PMC - PubMed
    1. Armulik, A., Genové G., Mäe M., Nisancioglu M.H., Wallgard E., Niaudet C., He L., Norlin J., Lindblom P., Strittmatter K., et al. . 2010. Pericytes regulate the blood-brain barrier. Nature. 468:557–561. 10.1038/nature09522 - DOI - PubMed
    1. Ben-Zvi, A., Lacoste B., Kur E., Andreone B.J., Mayshar Y., Yan H., and Gu C.. 2014. Mfsd2a is critical for the formation and function of the blood-brain barrier. Nature. 509:507–511. 10.1038/nature13324 - DOI - PMC - PubMed
    1. Daneman, R., and Prat A.. 2015. The blood-brain barrier. Cold Spring Harb. Perspect. Biol. 7:a020412. 10.1101/cshperspect.a020412 - DOI - PMC - PubMed

Publication types