. 2023 Aug;43(6):1229-1240.
doi: 10.1007/s10875-023-01475-x. Epub 2023 Mar 30.

Increased Plasma Levels of Triglyceride-Enriched Lipoproteins Associate with Systemic Inflammation, Lipopolysaccharides, and Gut Dysbiosis in Common Variable Immunodeficiency

Affiliations

Increased Plasma Levels of Triglyceride-Enriched Lipoproteins Associate with Systemic Inflammation, Lipopolysaccharides, and Gut Dysbiosis in Common Variable Immunodeficiency

Magnhild E Macpherson et al. J Clin Immunol. 2023 Aug.

Abstract

Purpose: Triglycerides (TG) and their major transport lipoprotein in the circulation (VLDL) appear to be related to inflammation. Patients with common variable immunodeficiency (CVID) have inflammatory complications associated with gut microbial dysbiosis. We hypothesized that CVID patients have disturbed TG/VLDL profiles associated with these clinical characteristics.

Methods: We measured plasma concentrations of TGs, inflammatory markers, and lipopolysaccharide (LPS) in 95 CVID patients and 28 healthy controls. Additionally, in 40 CVID patients, we explored plasma lipoprotein profiling, fatty acid, gut microbial dysbiosis, and diet.

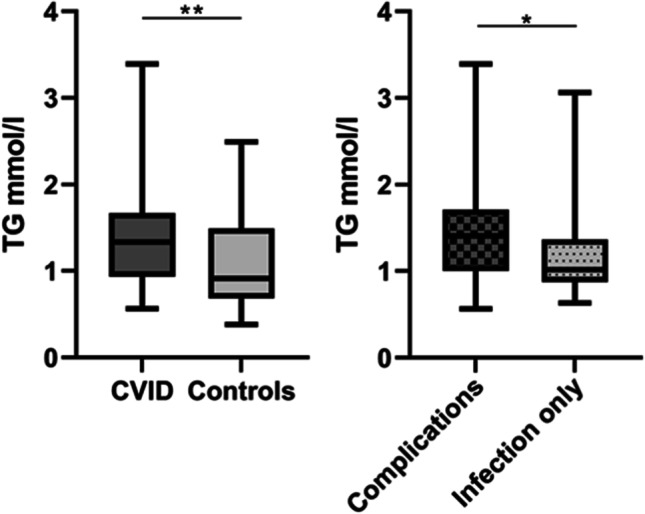
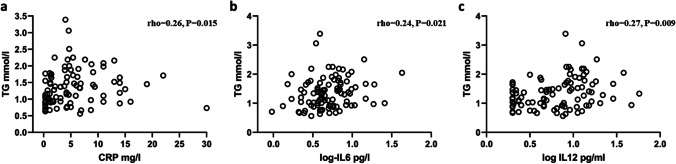
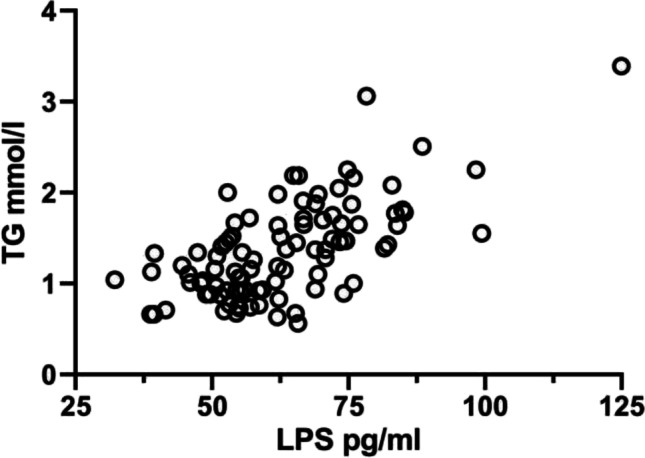
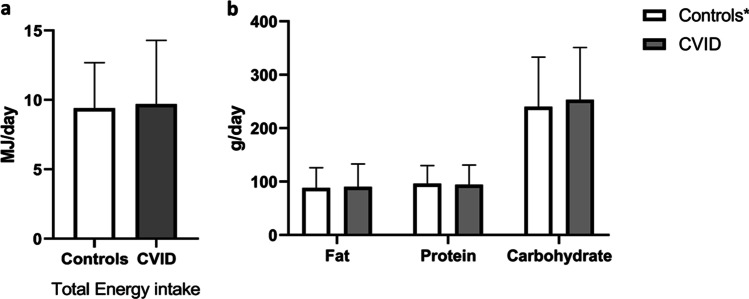
Results: TG levels were increased in CVID patients as compared to healthy controls (1.36 ± 0.53 mmol/l versus 1.08 ± 0.56 [mean, SD], respectively, P = 0.008), particularly in the clinical subgroup "Complications," characterized by autoimmunity and organ-specific inflammation, compared to "Infection only" (1.41 mmol/l, 0.71[median, IQR] versus [1.02 mmol/l, 0.50], P = 0.021). Lipoprotein profile analyses showed increased levels of all sizes of VLDL particles in CVID patients compared to controls. TG levels correlated positively with CRP (rho = 0.256, P = 0.015), IL-6 (rho = 0.237, P = 0.021), IL-12 (rho = 0.265, P = 0.009), LPS (r = 0.654, P = 6.59 × 10⁻¹³), CVID-specific gut dysbiosis index (r = 0.315, P = 0.048), and inversely with a favorable fatty acid profile (docosahexaenoic acid [rho = - 0.369, P = 0.021] and linoleic acid [rho = - 0.375, P = 0.019]). TGs and VLDL lipids did not appear to be associated with diet and there were no differences in body mass index (BMI) between CVID patients and controls.

Conclusion: We found increased plasma levels of TGs and all sizes of VLDL particles, which were associated with systemic inflammation, LPS, and gut dysbiosis in CVID, but not diet or BMI.

Keywords: CVID; Gut microbiota; LPS; Lipids; Metabolism; Triglycerides; VLDL.


Conflict of interest statement

The authors declare no competing interests.

Figures

Fig. 1
Fig. 1
TG levels in CVID patients and controls including CVID subgroups. Plasma levels of TG in common variable immunodeficiency (CVID) patients and controls. The CVID cohort was further divided into two subgroups: Infection only and Complications (non-infectious). Results are given as boxes representing the 25th to 75th percentile with lines indicating median and whiskers min–max values;*P > 0.05, **P < 0.01, using t-test or Mann–Whitney test between groups. Data is from the Main cohort (95 CVID and 28 healthy controls)
Fig. 2
Fig. 2
Correlation between TG levels and inflammatory markers in CVID. Panels show correlation between TG levels and CRP (a), IL-6 (b), and IL-12 (c) in 95 CVID patients. The IL-6 and IL-12 values were log transformed to improve visualization. Correlations were calculated by Spearman’s rank correlation test and are presented by rho. Data is from the Main cohort
Fig. 3
Fig. 3
Correlation between TG levels and LPS in CVID. The figure shows correlation between TG levels and LPS in CVID patients (n = 95). Comparisons are made by Pearson’s correlation test (correlation coefficient r). Data is from the Main cohort
Fig. 4
Fig. 4
Dietary intake of energy, fat, protein, and carbohydrates in CVID and healthy controls. Daily intake of total energy intake (a) and fat, protein, and carbohydrates (b) in the CVID patient cohort (n = 38) versus the Norwegian background population (Norkost3, n = 1787)*. The Norkost 3 study used a 24-h recall questionnaire, aiding accuracy of reported diet, while using a high “n” to reduce the seasonal and day-to-day variation. Results are shown as mean and SD. *P > 0.05. Data is from the Subset cohort

Similar articles

Cited by

References

    1. Cunningham-Rundles C. How I treat common variable immune deficiency. Blood. 2010;116(1):7–15. doi: 10.1182/blood-2010-01-254417. - DOI - PMC - PubMed
    1. Oksenhendler E, Gérard L, Fieschi C, Malphettes M, Mouillot G, Jaussaud R, et al. Infections in 252 patients with common variable immunodeficiency. Clin Infect Dis. 2008;46(10):1547–1554. doi: 10.1086/587669. - DOI - PubMed
    1. Macpherson ME, Hov JR, Ueland T, Dahl TB, Kummen M, Otterdal K, et al. Gut microbiota-dependent trimethylamine N-oxide associates with inflammation in common variable immunodeficiency. Front Immunol. 2020;11:574500. doi: 10.3389/fimmu.2020.574500. - DOI - PMC - PubMed
    1. Chapel H, Lucas M, Lee M, Bjorkander J, Webster D, Grimbacher B, et al. Common variable immunodeficiency disorders: division into distinct clinical phenotypes. Blood. 2008;112(2):277–286. doi: 10.1182/blood-2007-11-124545. - DOI - PubMed
    1. Resnick ES, Moshier EL, Godbold JH, Cunningham-Rundles C. Morbidity and mortality in common variable immune deficiency over 4 decades. Blood. 2012;119(7):1650–1657. doi: 10.1182/blood-2011-09-377945. - DOI - PMC - PubMed

Publication types