. 2023 May 15;133(10):e162253.
doi: 10.1172/JCI162253.

Complement C3a treatment accelerates recovery after stroke via modulation of astrocyte reactivity and cortical connectivity

Affiliations

Complement C3a treatment accelerates recovery after stroke via modulation of astrocyte reactivity and cortical connectivity

Anna Stokowska et al. J Clin Invest. .

Abstract

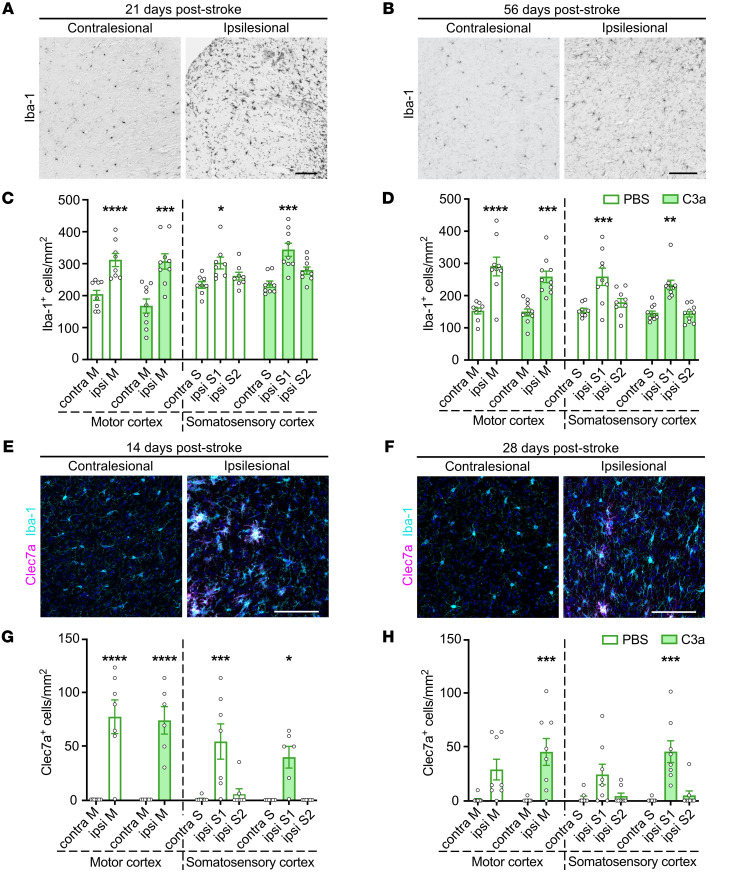
Despite advances in acute care, ischemic stroke remains a major cause of long-term disability. Approaches targeting both neuronal and glial responses are needed to enhance recovery and improve long-term outcome. The complement C3a receptor (C3aR) is a regulator of inflammation with roles in neurodevelopment, neural plasticity, and neurodegeneration. Using mice lacking C3aR (C3aR-/-) and mice overexpressing C3a in the brain, we uncovered 2 opposing effects of C3aR signaling on functional recovery after ischemic stroke: inhibition in the acute phase and facilitation in the later phase. Peri-infarct astrocyte reactivity was increased and density of microglia reduced in C3aR-/- mice; C3a overexpression led to the opposite effects. Pharmacological treatment of wild-type mice with intranasal C3a starting 7 days after stroke accelerated recovery of motor function and attenuated astrocyte reactivity without enhancing microgliosis. C3a treatment stimulated global white matter reorganization, increased peri-infarct structural connectivity, and upregulated Igf1 and Thbs4 in the peri-infarct cortex. Thus, C3a treatment from day 7 after stroke exerts positive effects on astrocytes and neuronal connectivity while avoiding the deleterious consequences of C3aR signaling during the acute phase. Intranasal administration of C3aR agonists within a convenient time window holds translational promise to improve outcome after ischemic stroke.

Keywords: Complement; Neuroscience; Stroke.


Conflict of interest statement

Conflict of interest: AS, M Pekny, and M Pekna hold US and European patent “C3a receptor agonists for use against ischemic brain injury, stroke, traumatic brain injury, spinal cord injury and neurodegenerative disorders” (US 11,266,715, EP 3541402).

Figures

Figure 1
Figure 1. C3aR–/– mice have increased astrocyte reactivity and reduced density of microglia in peri-infarct cortex.
(A) Representative images of ipsilesional and contralesional cortex of C3aR+/+ and C3aR–/– mice in which astrocytes are visualized with antibodies against GFAP on P21. Scale bar: 100 μm. (B) Schematic of cortical regions chosen for analysis (left) and relative GFAP-positive area in proximal peri-infarct and contralesional cortex (right). C3aR+/+, n = 8; C3aR–/–, n = 10. Ctx, cortex; CC, corpus callosum; Str, striatum; contra, contralesional; ipsi, ipsilesional; M, motor cortex; S, somatosensory cortex. (C) Representative images of ipsilesional and contralesional cortex of C3aR+/+ and C3aR–/– mice stained with antibodies against Iba-1 on P21. Scale bar: 100 μm. (D) Schematic of cortical regions chosen for analysis (left) and density of Iba-1–positive cells in the proximal peri-infarct and contralesional cortex (right). C3aR+/+, n = 8; C3aR–/–, n = 8. (EG) Recovery of motor function of C3aR+/+ (n = 10) and C3aR–/– (n = 14) mice as assessed by changes in distance walked in the beam test between P2 and P7 (E), P7 and P14 (F), and P14 and P21 (G). Bar plots represent mean ± SEM. Two-way ANOVA with Šidák’s planned comparisons (B and D): *P < 0.05, **P < 0.01, ***P < 0.001, ****P < 0.0001 for ipsilesional vs. contralesional comparisons; #P < 0.05 for between-genotype comparisons. Two-way ANOVA with repeated measures and Šidák’s planned comparisons (E and F): *P < 0.05.
Figure 2
Figure 2. Overexpression of C3a reduces astrocyte reactivity but increases microglia density in peri-infarct cortex.
(A) Representative images of ipsilesional and contralesional cortex of WT and GFAP-C3a mice in which astrocytes are visualized with antibodies against GFAP on P21. Scale bar: 100 μm. (B) Relative GFAP-positive area in proximal peri-infarct and contralesional cortex. WT, n = 9; GFAP-C3a, n = 9. Contra, contralesional; ipsi, ipsilesional; M, motor cortex; S, somatosensory cortex. Regions for analysis were chosen as shown in Figure 1B. (C) Representative images of ipsilesional and contralesional cortex of WT and GFAP-C3a mice stained with antibodies against Iba-1 on P21. Scale bar: 100 μm. (D) Density of Iba-1–positive cells in proximal peri-infarct and contralesional cortex. WT, n = 9; GFAP-C3a, n = 9. Regions for analysis were chosen as shown in Figure 1D. (EG) Recovery of motor function of WT (n = 13) and GFAP-C3a (n = 12) mice assessed by changes in distance walked in the beam test between P2 and P7 (E), P7 and P14 (F), and P14 and P21 (G). Bar plots represent mean ± SEM. Two-way ANOVA with Šidák’s planned comparisons (B and D): *P < 0.05, ***P < 0.001, ****P < 0.0001 for ipsilesional vs. contralesional comparisons; #P < 0.05, ##P < 0.01, ###P < 0.001 for between-genotype comparisons. Two-way ANOVA with repeated measures and Šidák’s planned comparisons (E and G): *P < 0.05.
Figure 3
Figure 3. Intranasal C3a reduces astrocyte reactivity in peri-infarct cortex.
(A) Study design. (B and C) Representative images of ipsilesional and contralesional cortex of mice treated with PBS or C3a. Astrocytes were visualized with antibodies against GFAP on P21 (B) and P56 (C). Scale bars: 100 μm. (D) Schematic of cortical regions chosen for analysis. Ctx, cortex; CC, corpus callosum; Str, striatum; ipsi, ipsilesional; M, motor cortex; S, somatosensory cortex. (E and F) Relative GFAP-positive area in proximal peri-infarct and contralesional cortex of mice treated with PBS or C3a on P21 (E) or P56 (F). PBS, n = 9; C3a, n = 8–9. (G) Association between GFAP expression in ipsilesional motor cortex on P56 and improvement in grid walk test, defined as the difference in percentage of right (affected) front paw foot faults, between P7 and P56. r, Pearson’s correlation coefficient; rho, Spearman’s correlation coefficient. Line represents the linear regression fit. Bar plots represent mean ± SEM. Two-way ANOVA with Šidák’s planned comparisons: **P < 0.01, ***P < 0.001, ****P < 0.0001 for ipsilesional vs. contralesional comparisons; ##P < 0.01, ###P < 0.001 for between-treatment comparisons.
Figure 4
Figure 4. Intranasal C3a does not affect the density of microglia in peri-infarct cortex.
(A and B) Representative images of contralesional and ipsilesional cortex stained with antibodies against Iba-1 on P21 (A) and P56 (B). Cortical regions were chosen for analysis as shown in Figure 3D. Scale bars: 100 μm. (C and D) Density of Iba-1–positive cells in the proximal peri-infarct and contralesional cortex of mice treated with PBS or C3a on P21 (C) or P56 (D). PBS, n = 8–9; C3a, n = 9–10. (E and F) Representative images of contralesional and ipsilesional motor cortex stained with antibodies against Iba-1 and Clec7a on P14 (E) and P28 (F). Cortical regions were chosen for analysis as shown in Figure 3D. Scale bars: 100 μm. (G and H) Density of Clec7a-positive cells in the proximal peri-infarct and contralesional cortex of mice treated with PBS or C3a on P14 (G) or P28 (H). P14: PBS, n = 6; C3a, n = 6. P28: PBS, n = 10; C3a, n = 10. Bar plots represent mean ± SEM. Contra, contralesional; ipsi, ipsilesional; M, motor cortex; S, somatosensory cortex. Two-way ANOVA with Šidák’s planned comparisons: *P < 0.05, **P < 0.01, ***P < 0.001, ****P < 0.0001 for ipsilesional vs. contralesional comparisons.
Figure 5
Figure 5. C3a treatment modulates stroke-induced astrocyte responses in peri-infarct cortex.
(A) Experimental design. Ctx, cortex; CL, contralesional; IL, ipsilesional. (B) Volcano plot showing genes differentially expressed (adjusted P value < 0.1) in peri-infarct cortex of C3a- versus PBS-treated mice on P14. Green boxes indicate reactivity markers characteristic of DAAs. (C) Gene set enrichment analysis of differentially expressed genes in peri-infarct cortex of C3a- versus PBS-treated mice at P14. (D) Heatmap of cell type fractions estimated by deconvolution analysis. (E) Heatmap of astrocyte subpopulation fractions estimated by deconvolution analysis. Values in heatmap cells are group averages. (F) Sample variance and statistical analysis for the estimated contribution of the DAA and GFAPlo subpopulations. n = 4 per group and time point. (G) Gene ontologies for the most highly expressed genes (gene expression profile score > 90 counts per million) in DAAs (top) and GFAPlo astrocytes (bottom). FDR, false discovery rate. (H) Representative images of P21 peri-infarct cortex immunostained with antibodies against GFAP and vimentin (Vim) and the fraction of GFAP-positive astrocytes with overlapping Vim immunoreactivity in PBS- and C3a-treated mice on P21. PBS, n = 10; C3a, n = 10. Scale bars: 50 μm (upper), 10 μm (lower). Bar plots represent mean ± SEM. Two-way ANOVA with Holm-Šidák post hoc test (F and H): *P < 0.05, **P < 0.01, ****P < 0.0001 for IL vs. CL comparisons; #P < 0.05, ##P < 0.01, ###P < 0.001, ####P < 0.0001 for comparisons between treatments and time points.
Figure 6
Figure 6. Intranasal C3a modulates post-stroke cortical connectivity.
(A) Study design. (B) 3D illustration of T2-weighted MRI (T2w-MRI) with the infarct (in red) and stroke incidence maps of PBS- and C3a-treated mice. (C) Infarct location based on quantitative lesion mapping using T2w-MRI: primary somatosensory area (SSp) upper limb (SSp-ul), lower limb (SSp-ll), nose (SSp-n), mouth (SSp-m), barrel field (SSp-bfd), unassigned (SSp-un); primary and secondary motor area (MOp and MOs). (D) Infarct volume based on quantitative lesion mapping using T2w-MRI on P7. (E) Regions selected for fiber tracking analysis. (F and G) Number of fibers from ipsilesional MOp (F) and SSp-ul (G) to the most strongly connected regions before stroke (BL) and on P7. (H and I) Number of fibers from ipsilesional MOp (H) and supplemental somatosensory area (SSs) (I) to primary somatosensory cortex before stroke (BL) and on P56. (J) DTI global density (ratio of connections to the maximum possible number of connections for all 96 brain regions) before stroke (BL) and on P7, P28, and P56. (K and L) Recovery of motor function as assessed by change in the frequency of foot faults in the grid walk test (K) and paw drags per touch in the cylinder test (L) between P7 and P56. (M) Representative images of ipsilesional motor cortex of PBS- and C3a-treated mice in which astrocytes are visualized with antibodies against GFAP on P56. Scale bar: 100 μm. Relative GFAP-positive area in proximal peri-infarct and contralesional cortex of PBS- and C3a-treated mice (P56). PBS, n = 7; C3a, n = 10. Bar plots represent mean ± SEM. Two-way mixed effects analysis with false discovery rate correction (FJ); 2-way mixed effects analysis with Šidák’s corrections (K and L); 2-way ANOVA with Šidák’s planned comparisons (M); *P < 0.05, **P < 0.01, ***P < 0.001 for comparison between time points or ipsilesional vs. contralesional; #P < 0.05, ##P < 0.01, ###P < 0.001 for between-treatment comparison.
Figure 7
Figure 7. Intranasal C3a treatment upregulates the expression of genes encoding IGF-1 and THBS4 in peri-infarct cortex.
(A) C3aR is expressed by astrocytes (arrows) and microglia (arrowheads) in the peri-infarct region on P7. Astrocytes are visualized by antibody against S100β; microglia are visualized by antibody against TMEM119. Scale bars: 100 μm (left), 20 μm (right). (B) Relative expression of Igf1 in peri-infarct and contralesional cortex of mice treated with PBS or C3a for 7 days starting on P7. Bar plots represent mean ± SEM. PBS, n = 5; C3a, n = 5. (C) Relative expression of Thbs4 in peri-infarct and contralesional cortex of mice treated with PBS or C3a for 21 days starting on P7. PBS, n = 3; C3a, n = 3. Bar plots represent mean ± SEM. Two-way ANOVA with Šidák’s planned comparisons: *P < 0.05. (D and E) IGF-1 (D) and THBS4 (E) immunoreactivity (arrows) within and in the vicinity of astrocytes visualized by antibodies against GFAP or S100β in peri-infarct cortex on P7 (IGF-1) or P28 (THBS4). Insets show higher magnification images of cells delineated by dashed squares. Scale bars: 20 μm (main), 10 μm (insets).

References

    1. Feigin VL, et al. World Stroke Organization (WSO): Global Stroke Fact Sheet 2022. Int J Stroke. 2022;17(1):18–29. doi: 10.1177/17474930211065917. - DOI - PubMed
    1. Go AS, et al. Heart disease and stroke statistics—2013 update: a report from the American Heart Association. Circulation. 2013;127(1):e6–e245. - PMC - PubMed
    1. Pekna M, et al. Modulation of neural plasticity as a basis for stroke rehabilitation. Stroke. 2012;43(10):2819–2828. doi: 10.1161/STROKEAHA.112.654228. - DOI - PubMed
    1. Pekny M, et al. Astrocyte activation and reactive gliosis—a new target in stroke? Neurosci Lett. 2019;689:45–55. doi: 10.1016/j.neulet.2018.07.021. - DOI - PubMed
    1. Clarkson AN, et al. Reducing excessive GABA-mediated tonic inhibition promotes functional recovery after stroke. Nature. 2010;468(7321):305–309. doi: 10.1038/nature09511. - DOI - PMC - PubMed

Publication types