. 2023 May 15;133(10):e153837.
doi: 10.1172/JCI153837.

Modulating fast skeletal muscle contraction protects skeletal muscle in animal models of Duchenne muscular dystrophy

Affiliations

Modulating fast skeletal muscle contraction protects skeletal muscle in animal models of Duchenne muscular dystrophy

Alan J Russell et al. J Clin Invest. .

Abstract

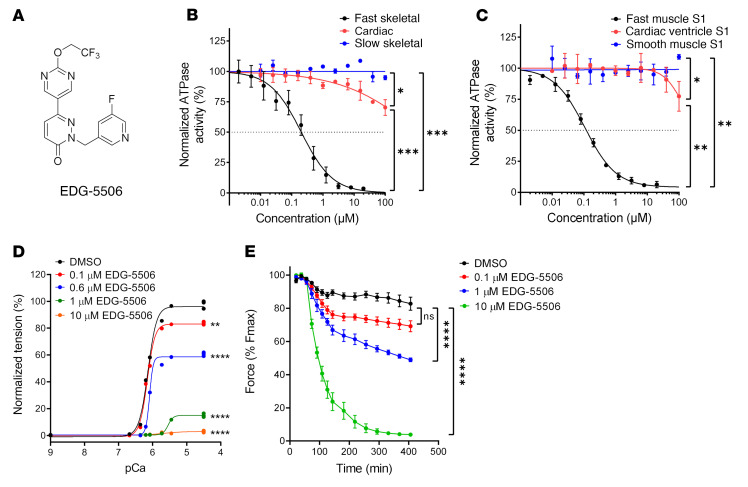
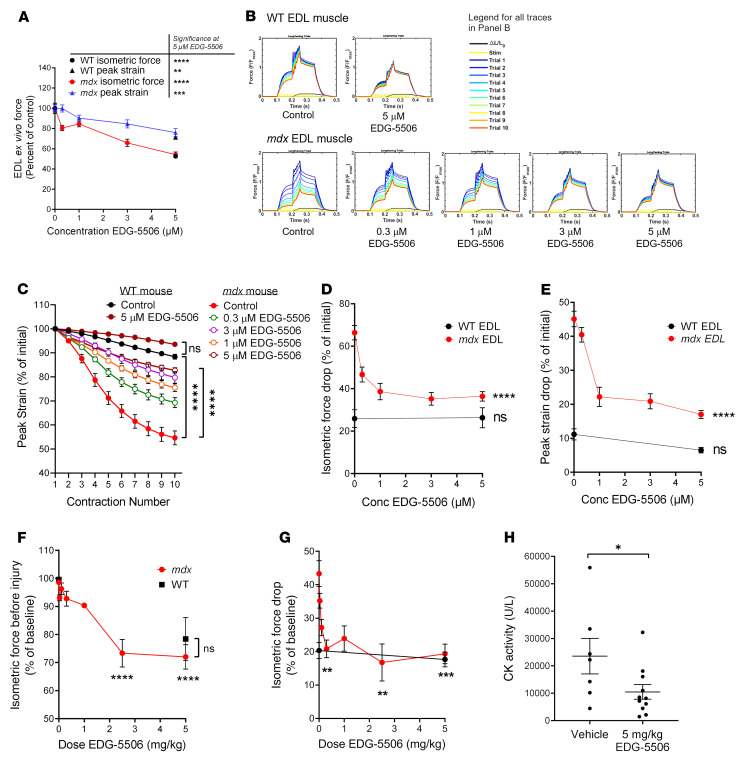
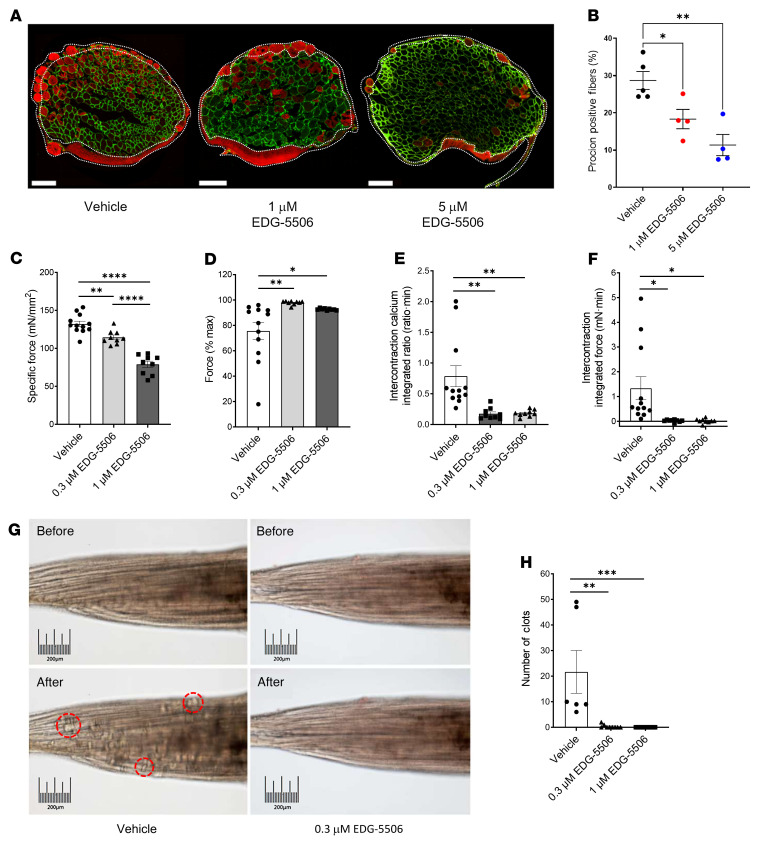
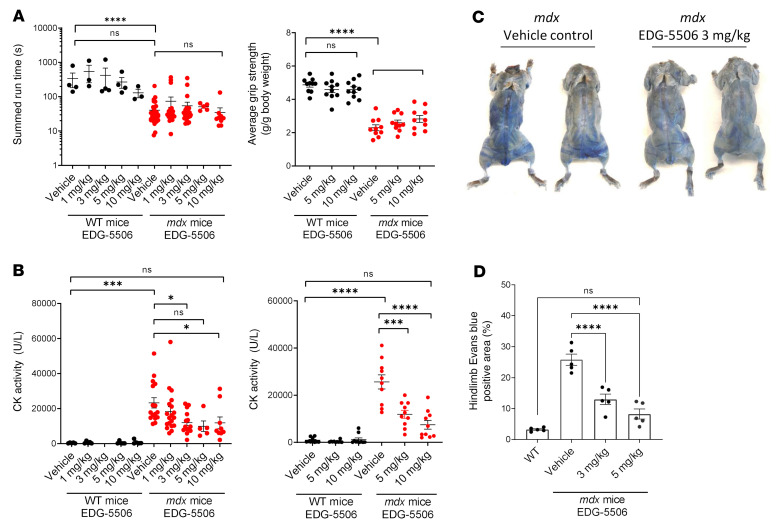
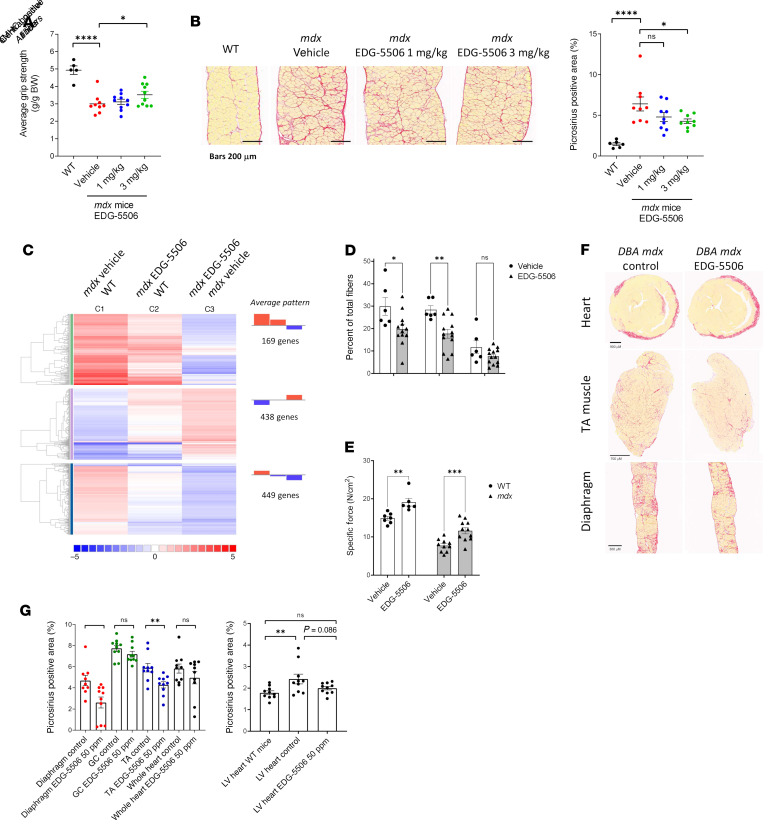
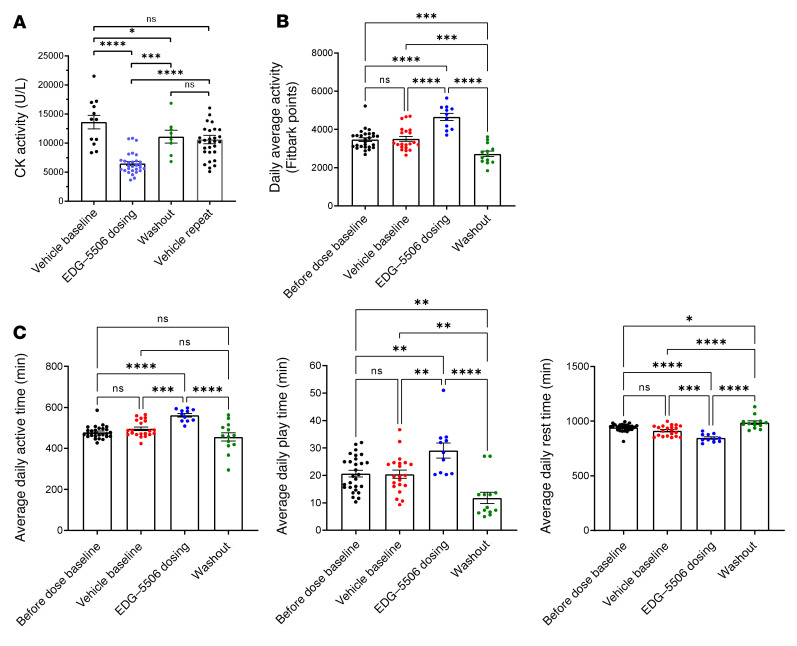
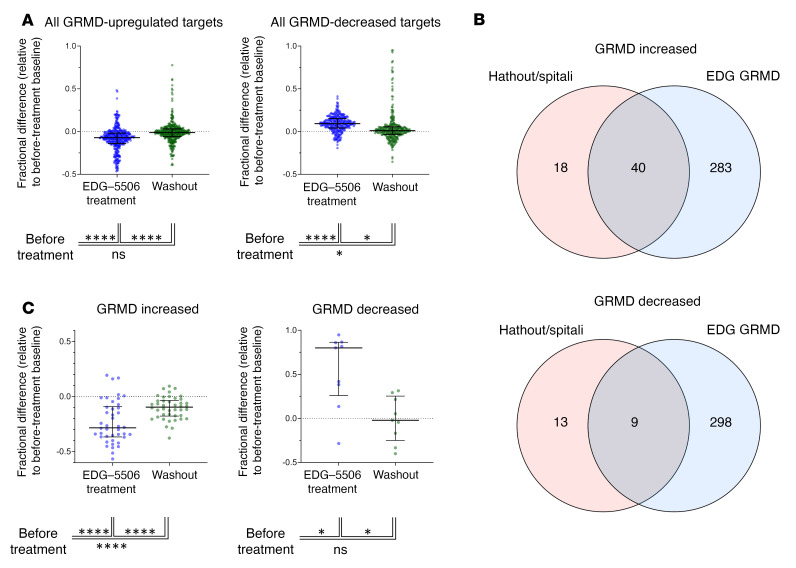
Duchenne muscular dystrophy (DMD) is a lethal muscle disease caused by absence of the protein dystrophin, which acts as a structural link between the basal lamina and contractile machinery to stabilize muscle membranes in response to mechanical stress. In DMD, mechanical stress leads to exaggerated membrane injury and fiber breakdown, with fast fibers being the most susceptible to damage. A major contributor to this injury is muscle contraction, controlled by the motor protein myosin. However, how muscle contraction and fast muscle fiber damage contribute to the pathophysiology of DMD has not been well characterized. We explored the role of fast skeletal muscle contraction in DMD with a potentially novel, selective, orally active inhibitor of fast skeletal muscle myosin, EDG-5506. Surprisingly, even modest decreases of contraction (<15%) were sufficient to protect skeletal muscles in dystrophic mdx mice from stress injury. Longer-term treatment also decreased muscle fibrosis in key disease-implicated tissues. Importantly, therapeutic levels of myosin inhibition with EDG-5506 did not detrimentally affect strength or coordination. Finally, in dystrophic dogs, EDG-5506 reversibly reduced circulating muscle injury biomarkers and increased habitual activity. This unexpected biology may represent an important alternative treatment strategy for Duchenne and related myopathies.

Keywords: Muscle Biology; Neuromuscular disease; Skeletal muscle; Therapeutics.


Conflict of interest statement

Conflict of interest: AJL, MD, BB, YQ, AKP, BLNS, KH, SL, MM, SS, BR, AVD, and KK are employees of and own stock or options to purchase stock for Edgewise Therapeutics. LAL and HLS are scientific advisors for Edgewise Therapeutics and own options to purchase stock.

Figures

Figure 1
Figure 1. EDG-5506 is a selective inhibitor of fast skeletal myosin ATPase and force generation in fast skeletal muscle.
(A) Chemical structure of EDG-5506. (B) Myofibril ATPase activity curves for EDG-5506, with myofibrils isolated from rabbit fast skeletal muscle, bovine cardiac ventricle, and slow bovine masseter muscle. (C) Purified myosin S1 ATPase activity curves for EDG-5506, with rabbit fast skeletal muscle (psoas muscle), pig cardiac muscle, and smooth muscle myosin S1 isolated from chicken gizzard. ATPase activity in the myofibrils is measured at the pCa50 (calcium concentration where ATPase activity is 50% of maximum) value for free calcium for each muscle type (n = 2). (D) Representative force-calcium curve in single permeabilized fast skeletal muscle fibers (rabbit psoas) with EDG-5506. (E) Percentage of initial force with time after addition of EDG-5506 in WT mouse EDL muscle ex vivo. Force was recorded at 250 Hz. Each point represents mean peak force ± 1 SEM (n = 4). *P < 0.05; **P < 0.01; ***P < 0.001; ****P < 0.0001. Significance was calculated by 1-way ANOVA with Dunnett’s multiple-comparison test.
Figure 2
Figure 2. Strength loss during eccentric contraction of dystrophic muscle is dependent upon contraction via myosin.
(A–E) WT and mdx mouse EDL muscle force ex vivo (n = 5–14). (A) Change in isometric and peak strain as a function of EDG-5506 concentration. Change in isometric force (circles) is represented as a percentage of initial force after 1-hour incubation with EDG-5506. Significance was calculated from the comparison of 5 μM EDG-5506 versus control. Peak strain (triangles) is represented as a percentage of peak strain obtained with vehicle treatment derived from the first eccentric contraction. Definitions of these metrics are provided in Supplemental Figure 2A. (B) Example force traces during 10 lengthening contractions of mdx and WT mouse EDL muscle ex vivo after incubation with the indicated concentrations of EDG-5506. (C) Normalized peak strain with each contraction of the injury protocol (n = 4–8). (D) Isometric force drop from the first to the last contraction as a function of EDG-5506 concentration. (E) Peak strain drop from the first to the last contraction as a function of EDG-5506 concentration. (F–H) WT and mdx mouse TA muscle force in situ (WT, n = 6; mdx vehicle, n = 17; mdx EDG-5506, n = 3–5 each). (F) Change in isometric force as a function of EDG-5506 dose, represented as a percentage of initial force 3 hours after oral gavage of vehicle or EDG-5506. (G) Isometric force drop 10 minutes after 2 lengthening contractions, represented as a percentage of preinjury force. All indicated comparisons were made again using 0 μM EDG-5506 (data not shown). (H) CK activity 1 hour after in situ injury (n = 7–11). Data are shown as the mean ± SEM. Significance was calculated by 1-way ANOVA with Dunnett’s multiple-comparison test. *P < 0.05; **P < 0.01; ***P < 0.001; ****P < 0.0001. All indicated comparisons were made against results obtained after treatment with vehicle (0 μM EDG-5506).
Figure 3
Figure 3. Membrane injury arising from contraction of dystrophic muscle is dependent upon contraction via myosin.
(A) Representative immunofluorescence images of procion orange-positive fibers after eccentric contraction in mdx EDL muscle. Green channel, laminin; red channel, procion orange (n = 4). Scale bar: 200 μm. White dotted areas indicate possible nonspecific staining that was excluded during analysis. (B) Quantification of procion-positive fibers. (C) Specific force prior to injury in mdx lumbrical muscles after 1-hour incubation with EDG-5506. (D) Force change from the first to the last repeated tetanic contraction of mdx lumbrical muscles. (E) Average intercontraction fura-2 fluorescence ratio during repeated tetanic contraction. (F) Average intercontraction force during repeated tetanic contraction. (G) Representative muscle images after 12 contractions. Example clots are highlighted in red. Scale bar: 200 μm. (H) Quantification of muscle clots from retracted fibers (n = 8–12). Data are shown as the mean ± SEM. Significance was calculated by 1-way ANOVA with Dunnett’s multiple-comparison test. *P < 0.05; **P < 0.01; ***P < 0.001; ****P < 0.0001.
Figure 4
Figure 4. Normalization of membrane permeability with EDG-5506 in mdx mice without detrimental effects on strength and coordination in vivo.
(A) Left: Rotarod performance. Right: Forelimb grip strength 4 hours after oral administration of EDG-5506 (n = 10–31). (B) Plasma CK activity from blood taken 1 hour after rotarod (left) or grip strength tests (right) (n = 10–19). (C) Representative whole-body images of nonexercised mdx mice 24 hours after intravenous administration of Evans blue dye. Mice were treated for 3 weeks with vehicle or EDG-5506 (these images were reproduced as part of Supplemental Figure 4C). (D) Quantitation of Evans blue dye–positive area in the hind limbs of treated mice (n = 5) (1–10 mg/kg represents approximately 0.079–0.79 μmol EDG-5506/mouse). Significance was calculated by 1-way ANOVA with Dunnett’s multiple-comparison test. *P < 0.05; ***P < 0.001; ****P < 0.0001.
Figure 5
Figure 5. Longer-term exposure of protective levels of myosin inhibition are sufficient to decrease muscle degeneration and fibrosis in mdx mice.
(A) Average grip strength (experimenter blinded) measured after 5 weeks of dosing in mdx mice (n = 5–10). (B) Left: Representative images. Right: Quantification of collagen (stained with picrosirius red) in mdx mouse diaphragm after 8 weeks of treatment (n = 9–10). Scale bar: 200 μm. (C) RNA-Seq meta-analysis. Colors are graded by log2 fold change (WT, n = 2; mdx vehicle, EDG-5506, n = 3). (D) Histological quantification of central nuclei and eMHC-positive fibers in soleus muscle sections from post-weaning mdx mice after 3 weeks EDG-5506 administration. (E) Specific force in the soleus muscle ex vivo in postweaning mdx and WT mice after 3 weeks of treatment with EDG-5506 or vehicle. (F) Representative histology sections examining muscle fibrosis in DBA/2 mdx mice after 12 weeks of treatment with control or EDG-5506 chow (50 ppm or 0.13 mmol/Kg chow). Scale bar: 900 μm (heart); 700 μm (anterior tibialis [TA] muscle); 300 μm (diaphragm). (G) Quantification of collagen (picrosirius red area). Left: Collagen quantification in select muscles (GC, gastrocnemius). Right: Collagen quantification in the left ventricle (LV; n = 9–10). Data are shown as the mean ± SEM. Significance was calculated by 1-way ANOVA with Dunnett’s multiple-comparison test. *P < 0.05; **P < 0.01; ***P < 0.001; ****P < 0.0001.
Figure 6
Figure 6. Selective inhibition of active contraction in fast skeletal muscle decreases CK and increases habitual activity in DMD dogs.
(A) Plasma CK activity in 7-month-old DMD dogs (n = 4) before, during, and after 14 days oral gavage with EDG-5506. Each data point represents CK activity from an individual blood draw (2–3 draws during the vehicle baseline, 5–8 draws during the dosing period, and 2 draws during the vehicle washout). In a separate study, the same 4 dogs were dosed daily with vehicle, and blood CK was at regular intervals for 14 days (indicated as vehicle repeat, 6–9 blood draws per dog). Data are shown as the mean ± SEM. (B) Average daily activity measures from an electronic activity monitor (FitBark) in the same DMD dogs (n = 3, 15 months old) before, during, and after an 11-day oral gavage with EDG-5506 (2 mg/kg daily for 4 days, then every other day). Each data point represents the daily average activity for the 3 dogs. (C) Timed function data from the same activity monitors. Average daily active time, average daily play time, and average daily rest time. Each point represents average activity for 1 day (2 mg/kg represents approximately 68.2 μmol EDG-5506/dog). Significance was calculated by 1-way ANOVA with Tukey’s multiple-comparison correction. *P < 0.05; **P < 0.01; ***P < 0.001; ****P < 0.0001.
Figure 7
Figure 7. Selective inhibition of contraction in fast skeletal muscle reverses proteomic signatures associated with disease in DMD dogs.
(A) Effect of EDG-5506 treatment on plasma proteins identified by Somascan as increased (left) or decreased (right) in DMD dogs compared with healthy littermates. Fractional change was then calculated for each target during the treatment and washout period, relative to the predose baseline. Data are shown as the median ± interquartile range. (B) Overlap of GRMD increased and decreased proteins with those from a common data set from a patient with DMD (43). (C) Effect of treatment with EDG-5506 on common DMD-elevated (left) or -reduced (right) proteins. Data are shown as the median ± interquartile range. See Supplemental Data File 3 for full analysis. Significance was calculated by 1-way ANOVA with Tukey’s multiple-comparison correction. *P < 0.05; **P < 0.01; ***P < 0.001; ****P < 0.0001.

References

    1. Petrof BJ. The molecular basis of activity-induced muscle injury in Duchenne muscular dystrophy. Mol Cell Biochem. 1998;179(1–2):111–123. - PubMed
    1. Gao QQ, McNally EM. The dystrophin complex: structure, function, and implications for therapy. Compr Physiol. 2015;5(3):1223–1239. - PMC - PubMed
    1. Vanderbrouck C, et al. Involvement of TRPC in the abnormal calcium influx observed in dystrophic (mdx) mouse skeletal muscle fibers. J Cell Biol. 2002;158(6):1089–1096. doi: 10.1083/jcb.200203091. - DOI - PMC - PubMed
    1. Burr AR, Molkentin JD. Genetic evidence in the mouse solidifies the calcium hypothesis of myofiber death in muscular dystrophy. Cell Death Differ. 2015;22(9):1402–1412. doi: 10.1038/cdd.2015.65. - DOI - PMC - PubMed
    1. Godi C, et al. Longitudinal MRI quantification of muscle degeneration in Duchenne muscular dystrophy. Ann Clin Transl Neurol. 2016;3(8):607–622. doi: 10.1002/acn3.319. - DOI - PMC - PubMed

Publication types