. 2023 Mar 31;379(6639):eadf4721.
doi: 10.1126/science.adf4721. Epub 2023 Mar 31.

Brassinosteroid gene regulatory networks at cellular resolution in the Arabidopsis root

Affiliations

Brassinosteroid gene regulatory networks at cellular resolution in the Arabidopsis root

Trevor M Nolan et al. Science. .

Abstract

Brassinosteroids are plant steroid hormones that regulate diverse processes, such as cell division and cell elongation, through gene regulatory networks that vary in space and time. By using time series single-cell RNA sequencing to profile brassinosteroid-responsive gene expression specific to different cell types and developmental stages of the Arabidopsis root, we identified the elongating cortex as a site where brassinosteroids trigger a shift from proliferation to elongation associated with increased expression of cell wall-related genes. Our analysis revealed HOMEOBOX FROM ARABIDOPSIS THALIANA 7 (HAT7) and GT-2-LIKE 1 (GTL1) as brassinosteroid-responsive transcription factors that regulate cortex cell elongation. These results establish the cortex as a site of brassinosteroid-mediated growth and unveil a brassinosteroid signaling network regulating the transition from proliferation to elongation, which illuminates aspects of spatiotemporal hormone responses.


Conflict of interest statement

Competing interests:

P.N.B. is the co-founder and Chair of the Scientific Advisory Board of Hi Fidelity Technologies, a company that works on crop root growth.

Figures

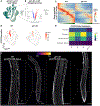
Fig. 1.
Fig. 1.. scRNA-seq identifies brassinosteroid-induction of cell wall-related genes in the cortex.
(A) Spatiotemporal response to 2-hour BL treatment vs BRZ control among each combination of cell type and developmental stage of the Arabidopsis root. Color on UMAP projection indicates the number of differentially expressed genes (DEGs). (B) Volcano plot of BL DEGs in the elongating cortex. Color indicates the direction of regulation. Known markers of brassinosteroid response including DWF4, RD26, XTH4, and IAA19 are indicated. C/VIF2 and CSI1 (described in this study) are also indicated. (C) pC/VIF2-H2B-Venus reporter grown on 1 μM BRZ for 7 days and transferred to 1 μM BRZ or 100 nM BL for 4 hours. Inset shows C/VIF2 signals in the elongating cortex that increase with BL treatment. Propidium iodide-staining is shown in grey, with the color gradient indicating relative C/VIF2-H2B-Venus levels. Scale bars, 100 μm. (D-E) UMAP of BL treatment scRNA-seq time course. Mock BRZ control represents time 0. Colors indicate cell type (D) or developmental stage annotation (E).
Fig. 2.
Fig. 2.. Waddington-OT traces the induction of cell wall-related genes along cortex trajectories associated with the switch to elongation.
(A) Density plot showing cell wall gene expression score. The shaded region with cell wall expression scores >=1 indicates “responsive cortex cells”. (B) Bar plot showing the percentage of responsive cells in the cortex versus other cell types over the time course. Color indicates developmental stage annotation, also depicted in the root schematic. Illustration adapted from the Plant Illustrations repository. Only transition and elongation zones are plotted, as other zones represent less than 2% of responsive cells. (C) WaddingtonOT (WOT) probabilities for cortex responsive state along the BL time course. The BL 2-hour time point was used as a reference, therefore all cells have a probability of either 1 or 0 at this time point. (D-E) Triangle plots with cells plotted according to WOT cortex responsive, cortex non-responsive, or other state probabilities for each time point along the BL time course. Color indicates the cell type (D) or developmental stage (E) annotation. (F) Expression trends for select transcription factors differentially expressed along WOT cortex responsive trajectories.
Fig. 3.
Fig. 3.. Triple receptor mutant bri1-T gene expression changes in cortex and distinct patterns in pGL2-BRI1-GFP/bri1-T.
(A) 7-day old WT, bri1-T and pGL2-BRI1-GFP/bri1-T roots grown under control conditions. Propidium iodide-staining is shown in grey, and GFP in green. Scale bars, 100 μm. (B) UMAP projection of scRNA-seq from 14,334 wild-type cells, 12,649 bri1-T cells and 7,878 pGL2-BRI1-GFP/bri1-T cells. Two biological replicates of scRNA-seq were performed for each genotype. Colors indicate cell type annotation. (C) UMAP projection colored by developmental stage annotation. (D) UMAP colored by DEGs for each cell type/developmental stage combination of bri1-T compared to WT. (E) Volcano plot of DEGs in the elongating cortex from bri1-T compared to WT showing down-regulation of cell wall-related genes in bri1-T. Color indicates the direction of regulation. (F-G) UMAP colored by DEGs for each cell type/developmental stage combination of pGL2-BRI1-GFP/bri1-T compared to WT (F) or pGL2:BRI1-GFP/bri1-T compared to bri1-T (G).
Fig. 4.
Fig. 4.. Tissue-specific CRISPR of BRI1 confirms role for cortex in brassinosteroid-mediated cell expansion.
(A) Overview of BRI1 tissue-specific CRISPR approach. A bri1 mutant complemented with pBRI1-BRI1-mCitrine (1) was used as background to introduce tissue-specific Cas9 along with gRNAs targeting BRI1 (2). This allows for visualization of BRI1 knockout in specific cell layers, such as the cortex when pCO2-BRI1-CRISPR is used (3). (B) Appearance of Cas9-tagRFP in the cortex is associated with loss of BRI1-mCitrine signal, confirming tissue-specific knockout. (C) Confocal images of BRI1 tissue-specific CRISPR lines. Control indicates a broad expression pattern of BRI1-mCitrine in pBRI1-BRI1-mCitrine/bri1. BRI1-mCitrine signals are shown in green, and propidium iodide staining (PI) in magenta (upper panels). White arrows specify tissues with absence of BRI1-mCitrine signal; epidermis for pWER-BRI1-CRISPR and cortex for pCO2-BRI1-CRISPR. Mature root longitudinal and cross sections illustrate changes in cell length (middle panels) and width (lower panels), respectively. Cortex cells are pseudocolored to indicate their position. (D) Quantification of meristematic cortex cell length, defined as the first 20 cells of individual roots starting from the quiescent center. Control indicates pBRI1-BRI1-mCitrine/bri1 complemented line. (E) Quantification of mature cortex cell length. For (D) and (E), all individual data points are plotted. Magenta horizontal bars represent the means, and error bars represent s.d. Significant differences between each line and wild type were determined by one-way ANOVA and Dunnett’s multiple comparison tests. *** P < 0.001, ** P < 0.01 and * P < 0.05. n.s. not significant. Scale bars, (B) and upper panels (C) 50 μm, middle panels (C) 100 μm and lower panels (C) 25 μm. TSKO, tissue-specific knockout.
Fig. 5.
Fig. 5.. HAT7 and GTL1 are brassinosteroid-responsive regulators along cortex trajectories
(A) Upset plot showing a comparison of genes up-regulated by BL in the cortex, down-regulated in the cortex of bri1-T, and differentially expressed along wild-type cortex trajectories. The red color indicates 163 genes common to all three sets. (B) Gene expression trends for 163 core brassinosteroid DEGs along cortex trajectories. Scaled expression along cortex pseudotime is plotted for each time point of the brassinosteroid time series and for wild type versus bri1-T. Lower bar indicates pseudotime progression calculated by CytoTRACE. (C-E) Gene expression trends for HAT7, GTL1, or C/VIF2 along the developmental zones of the cortex for each time point of the brassinosteroid time course. Color bar indicates the scaled expression level in the cortex. (F-G) 7-day-old roots expressing pHAT7-HAT7-mCitrine (F) or pGTL1-GTL1-mCitrine (G) reporters under control conditions show an increased expression as cortex cells elongate. Propidium iodide-staining is shown in grey, with the color gradient indicating relative mCitrine levels. Scale bars, 100 μm.
Fig. 6.
Fig. 6.. HAT7 and GTL1 are top-ranked regulators in cortex GRNs and affect brassinosteroid-related phenotypes.
(A) Top 10 transcription factors in the CellOracle BL 2-hour elongating cortex GRN ranked by out-degree. Ranking is indicated by the number inside the circle. Color indicates transcription factor family, with light grey corresponding to any family other than HAT7 or GTL1. (B) Subnetwork showing cell wall-related genes that are predicted targets of HAT7 and GTL1 in the CellOracle elongating cortex GRN. HB13, HB20, and HB23 are included in the subnetwork since they are connected to HAT7 and cell-wall-related genes. Node size is proportional to degree. (C) Quantification of mature cortex cell length. Red horizontal bars represent the means, and error bars represent s.d. Significant differences between each line and wild type were determined by one-way ANOVA and Dunnett’s multiple comparison tests. ***P< 0.001. (D) Propidium iodide-staining of 7-day-old WT, hat7 hb13 hb20 hb23 (line 1–2), and gtl1 df1 roots. Insets show cortex cells entering the elongation zone. Scale bars, 100 μm.
Fig. 7.
Fig. 7.. scRNA-seq reveals cell-type-specific expression underlying gtl1 df1 phenotypes
(A) UMAP projection of scRNA-seq from 74,810 WT, gtl1, df1, and gtl1 df1 cells. Two biological replicates were profiled for each genotype. Color indicates DEGs for each cell type/developmental stage combination of gtl1 df1 compared to WT. (B) Volcano plot of DEGs in the elongating cortex from gtl1 df1 compared to WT. Color indicates the direction of regulation. (C) Gene expression trends along cortex trajectories for down-regulated DEGs in gtl1 df1 compared to WT. Each row represents the scaled expression of a gene along cortex pseudotime. The lower bar indicates pseudotime progression calculated by CytoTRACE. (D) Expression of C/VIF2 in wild type and gtl1 df1 scRNA-seq. The color scale represents log normalized, corrected UMI counts. (E) C/VIF2 expression levels plotted along the developmental zones of the cortex for WT, gtl1, df1, and gtl1 df1. The color bar indicates the scaled expression level. (F) 7-day-old root images of a pC/VIF2-H2B-Venus reporter in wild type or gtl1 df1 under control conditions. Propidium iodide-staining is shown in grey, with the color gradient indicating relative mCitrine levels. Scale bars, 100 μm.

References

    1. Pierre-Jerome E, Drapek C, Benfey PN, Regulation of Division and Differentiation of Plant Stem Cells. Annu. Rev. Cell Dev. Biol 34, 289–310 (2018). - PMC - PubMed
    1. Shahan R, Nolan TM, Benfey PN, Single-cell analysis of cell identity in the Arabidopsis root apical meristem: insights and opportunities. J. Exp. Bot (2021), doi:10.1093/jxb/erab228. - DOI - PMC - PubMed
    1. Levine M, Davidson EH, Gene regulatory networks for development. Proc. Natl. Acad. Sci. U. S. A 102, 4936–4942 (2005). - PMC - PubMed
    1. Moreno-Risueno MA, Busch W, Benfey PN, Omics meet networks—using systems approaches to infer regulatory networks in plants. Curr. Opin. Plant Biol 13, 126–131 (2010). - PMC - PubMed
    1. Seyfferth C, Renema J, Wendrich JR, Eekhout T, Seurinck R, Vandamme N, Blob B, Saeys Y, Helariutta Y, Birnbaum KD, De Rybel B, Advances and Opportunities of Single-Cell Transcriptomics for Plant Research. Annu. Rev. Plant Biol (2021), doi:10.1146/annurev-arplant-081720-010120. - DOI - PMC - PubMed

MeSH terms