. 2023 Mar 30;19(3):e1011283.
doi: 10.1371/journal.ppat.1011283. eCollection 2023 Mar.

Characterisation of the antiviral RNA interference response to Toscana virus in sand fly cells

Affiliations

Characterisation of the antiviral RNA interference response to Toscana virus in sand fly cells

Akira J T Alexander et al. PLoS Pathog. .

Abstract

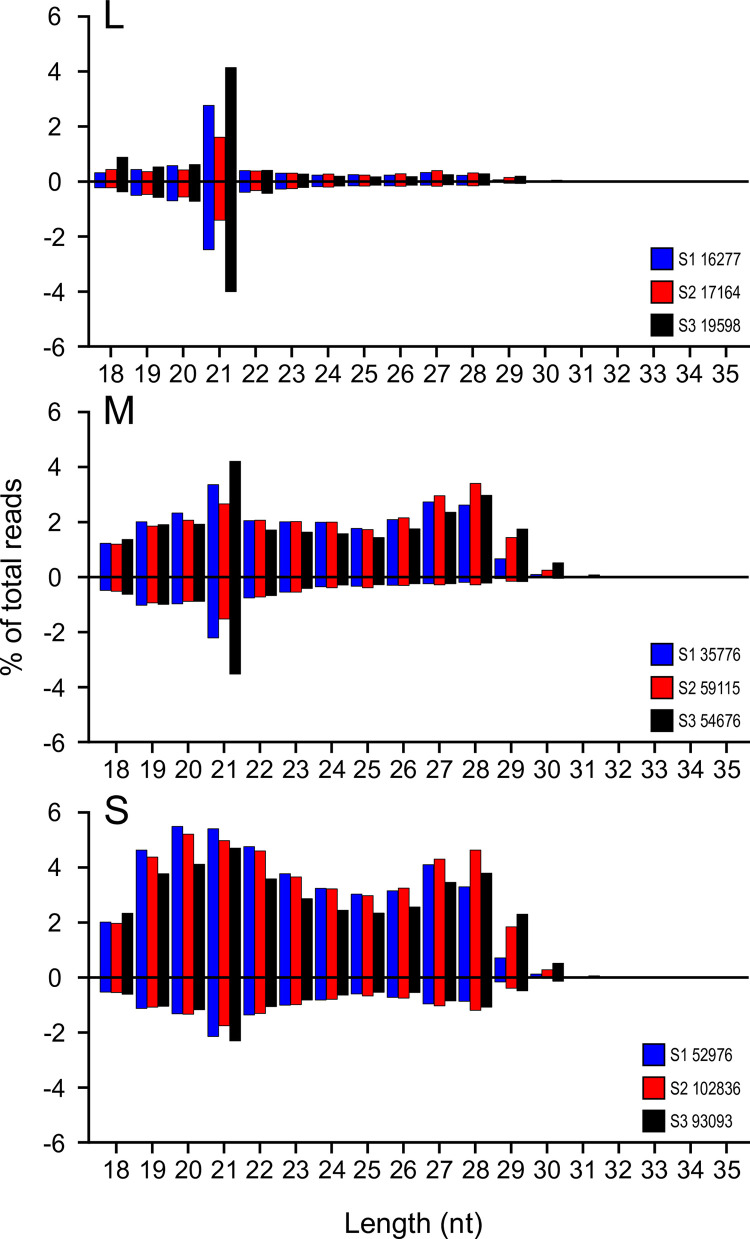
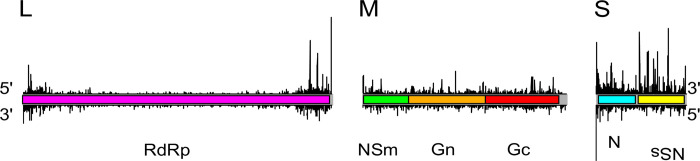
Toscana virus (TOSV) (Bunyavirales, Phenuiviridae, Phlebovirus, Toscana phlebovirus) and other related human pathogenic arboviruses are transmitted by phlebotomine sand flies. TOSV has been reported in nations bordering the Mediterranean Sea among other regions. Infection can result in febrile illness as well as meningitis and encephalitis. Understanding vector-arbovirus interactions is crucial to improving our knowledge of how arboviruses spread, and in this context, immune responses that control viral replication play a significant role. Extensive research has been conducted on mosquito vector immunity against arboviruses, with RNA interference (RNAi) and specifically the exogenous siRNA (exo-siRNA) pathway playing a critical role. However, the antiviral immunity of phlebotomine sand flies is less well understood. Here we were able to show that the exo-siRNA pathway is active in a Phlebotomus papatasi-derived cell line. Following TOSV infection, distinctive 21 nucleotide virus-derived small interfering RNAs (vsiRNAs) were detected. We also identified the exo-siRNA effector Ago2 in this cell line, and silencing its expression rendered the exo-siRNA pathway largely inactive. Thus, our data show that this pathway is active as an antiviral response against a sand fly transmitted bunyavirus, TOSV.


Conflict of interest statement

The authors have declared that no competing interests exist.

Figures

Fig 1
Fig 1. FFLuc activity in transfected PP9 versus PP9ad cell lines.
PP9 and PP9ad cells were transfected with pGL3-Pub. At 72 h.p.t., cells were harvested and FFLuc activity was measured and normalized to untransfected. Shown is the relative light output from pGL3-PUb transfected cells, using TransIT-LT1. The figure shows data from three independent experiments, each conducted with three technical replicates. Data presented reflect mean values and error bars depict standard error of the mean (SEM).
Fig 2
Fig 2. The PP9ad cell line is susceptible to rTOSV infection.
(A) Titration of rTOSV following PP9ad infection with rTOSV (MOI 5 PFU/cell) up to 48 h post infection (h.p.i.). Mean titre with standard deviation (SD) of three samples are presented. (B) Protein lysates from rTOSV-infected PP9ad cells were assessed for the presence of N protein (TOSV N) by western botting at 24 and 48 h.p.i. ⍺-Tubulin was used as a loading control. Figures are representative of two independent experiments; lysate from uninfected cells was used as negative control.
Fig 3
Fig 3. Consensus between translated P. papatasi transcriptomics derived and PP9ad cell Ago2 sequences.
The Ago2 amino acid sequences differed in the N terminal region mainly, as shown in partial sequence indicated; the PP9ad cDNA encoding a longer protein.
Fig 4
Fig 4. Neighbour-joining tree of dipteran Ago2 protein sequences.
Full length Ago2 sequences were obtained for the Order Diptera from NCBI (see S2 Table for accession numbers) and aligned with the PP9ad-derived Ago2 consensus sequence. The phylogeny was reconstructed using the neighbour-joining method and Jukes-Cantor substitution model and rooted on Locusta migratoria. The phylogram is the result of 500 bootstrap replications. The branch lengths are drawn to scale and the scale bar in the bottom left represents 1.5 substitutions per site.
Fig 5
Fig 5. The PP9ad cell line contains an exo-siRNA pathway.
PP9ad cells were transfected with a combination of reporter plasmids and dsRNAs, and harvested for reporter expression by luciferase assay, or to determine gene expression by quantitative PCR. (A) Effects on normalised FFLuc expression in PP9ad cells when transfections of reporter plasmids were supplemented with 100 ng dsRNA targeting eGFP (dseGFP) or FFluc (dsFFLuc). FFLuc expression was normalized to a RLuc internal control (unpaired t test, T = 4.21, P = 0.014). (B) PP9ad cells were transfected with either 100 ng dsRNA targeting eGFP (dseGFP) or Ago2 (dsAgo2) 24 h prior to transfection with pGL3-PUb and pPUb-RLuc expression plasmids and 20 ng dseGFP or dsFFLuc as indicated (ANOVA, F = 1869.21, P = <0.001). FFLuc expression was normalized to a RLuc internal control. (C) The relative abundance of Ago2 present in PP9ad cells transfected with either 100 ng dseGFP or dsAgo2 was determined. Cells were harvested and relative abundance of Ago2 determined by RT-qPCR at 48 h.p.t. (unpaired t test, T = 4.48, P = 0.021). Data are representative of three independent replicates and presented as the mean value ± SD.
Fig 6
Fig 6. Depletion of Ago2 in rTOSV-infected PP9ad cell cultures leads to an increase in virus replication.
PP9ad cells were either mock transfected or transfected with 100 ng of dseGFP or dsAgo2 for 24 h before being infected with rTOSV at a MOI of 10 PFU/cell. At 48 h.p.i., cells were harvested. (A-B) Cell lysates were probed with anti-TOSV N and anti-⍺-tubulin antibodies, the ratio of TOSV N RLU:⍺-tubulin RLU was calculated and presented for the dseGFP and dsAgo2 samples. (C) Viral titres in cell culture supernatants were titrated by plaque assay. Data analysed by unpaired t-test, P = 0.001 (C). Figure shows data from seven independent blots (B) and six independent infections for titrations (C), data are presented as the mean value ± SD.
Fig 7
Fig 7. Overall coverage of small RNAs mapping to rTOSV segments.
The PP9ad cell line was infected with rTOSV at a MOI of 10 PFU/cell or mock infected. At 3 d.p.i., cells were harvested and small RNAs were isolated and the overall distribution of small RNA sequences mapping to the genomic (black, negative reads) or antigenomic (blue, positive reads) viral S, M and L RNA segments. Data presented as mean ± SD from three independent experimental repeats.
Fig 8
Fig 8. Size distribution of reads mapping to rTOSV L, M and S segments.
Read lengths are indicated from 18 to 35 nt; with percentages of total reads per length mapping to the antigenome (positive numbers, y axis) or genome (negative numbers, y axis) indicated. Total read numbers per genome segment from each independent experiment (S1-3) are indicated.
Fig 9
Fig 9. The distribution of 21 nt vsiRNA reads mapped to rTOSV segments.
Graphs show the distribution by genomic coverage of 21 nt vsiRNAs along each rTOSV segment length, normalised as a percentage of total reads, per replicate as indicated by colour. Read numbers mapping genome sense are indicated by (-) and antigenome by (+).
Fig 10
Fig 10. Summary of 21 nt vsiRNA distribution in PP9ad cells in response to rTOSV infection.
These graphs show the nucleotide positions for which all three replicates had 21 nt vsiRNAs sequences starting; the data was all scaled across segments by replicate to take differences in read quantity into account and shows the mean of the triplicate. Reads mapping to antigenome on top and genome, below.
Fig 11
Fig 11. Z-scores and sequence logo analysis of 24–29 nt small RNAs produced in rTOSV-infected PP9ad cells.
(A) Z-score of combined genomic and antigenomic 24–29 nt small RNAs mapping to rTOSV L, M or S segments. Expected for vpiRNAs would be a prominent peak at the 10 nt overlap position if these were present. Individual replicates are indicated by colour, S1-3. (B) Sequence logo analysis, as determined by seqLogo of nucleotide predominance of the first 15 nt of each of 24–29 nt small RNAs (mapping to L, M or S genome or antigenome segments, as indicated) of all replicates combined.

References

    1. Ayhan N, Charrel RN. An update on Toscana virus distribution, genetics, medical and diagnostic aspects. Clin Microbiol Infect. 2020;26(8):1017–23. Epub 2020/01/07. doi: 10.1016/j.cmi.2019.12.015 . - DOI - PubMed
    1. Charrel RN, Bichaud L, de Lamballerie X. Emergence of Toscana virus in the mediterranean area. World J Virol. 2012;1(5):135–41. Epub 2013/11/01. doi: 10.5501/wjv.v1.i5.135 ; PubMed Central PMCID: PMC3782275. - DOI - PMC - PubMed
    1. Elliott RM, Brennan B. Emerging phleboviruses. Curr Opin Virol. 2014;5:50–7. Epub 2014/03/13. doi: 10.1016/j.coviro.2014.01.011 ; PubMed Central PMCID: PMC4031632. - DOI - PMC - PubMed
    1. Wuerth JD, Weber F. Phleboviruses and the Type I Interferon Response. Viruses. 2016;8(6). Epub 2016/06/25. doi: 10.3390/v8060174 ; PubMed Central PMCID: PMC4926194. - DOI - PMC - PubMed
    1. Woelfl F, Leger P, Oreshkova N, Pahmeier F, Windhaber S, Koch J, et al.. Novel Toscana Virus Reverse Genetics System Establishes NSs as an Antagonist of Type I Interferon Responses. Viruses. 2020;12(4). Epub 2020/04/09. doi: 10.3390/v12040400 ; PubMed Central PMCID: PMC7232479. - DOI - PMC - PubMed

Publication types

Substances