. 2023 Mar 30;18(3):e0283537.
doi: 10.1371/journal.pone.0283537. eCollection 2023.

A new multiplex SARS-CoV-2 antigen microarray showed correlation of IgG, IgA, and IgM antibodies from patients with COVID-19 disease severity and maintenance of relative IgA and IgM antigen binding over time

Affiliations

A new multiplex SARS-CoV-2 antigen microarray showed correlation of IgG, IgA, and IgM antibodies from patients with COVID-19 disease severity and maintenance of relative IgA and IgM antigen binding over time

Marie Le Berre et al. PLoS One. .

Abstract

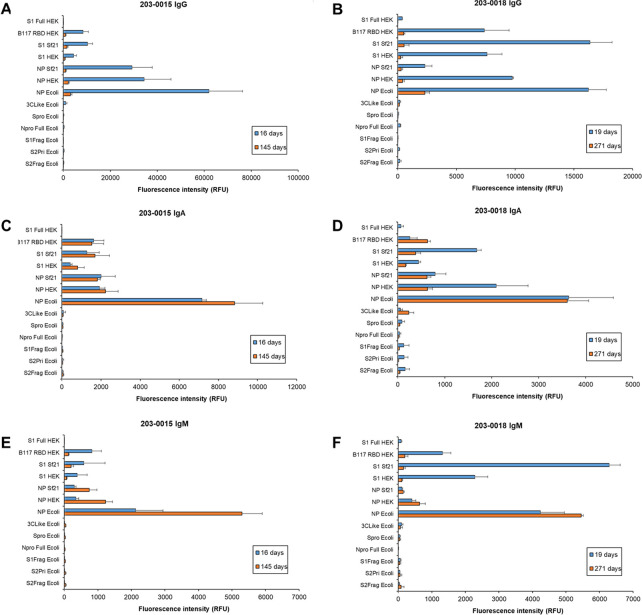
Zoonotic spillover of severe acute respiratory syndrome coronavirus 2 (SARS-CoV-2) to humans in December 2019 caused the coronavirus disease 2019 (COVID-19) pandemic. Serological monitoring is critical for detailed understanding of individual immune responses to infection and protection to guide clinical therapeutic and vaccine strategies. We developed a high throughput multiplexed SARS-CoV-2 antigen microarray incorporating spike (S) and nucleocapsid protein (NP) and fragments expressed in various hosts which allowed simultaneous assessment of serum IgG, IgA, and IgM responses. Antigen glycosylation influenced antibody binding, with S glycosylation generally increasing and NP glycosylation decreasing binding. Purified antibody isotypes demonstrated a binding pattern and intensity different from the same isotype in whole serum, probably due to competition from the other isotypes present. Using purified antibody isotypes from naïve Irish COVID-19 patients, we correlated antibody isotype binding to different panels of antigens with disease severity, with binding to the S region S1 expressed in insect cells (S1 Sf21) significant for IgG, IgA, and IgM. Assessing longitudinal response for constant concentrations of purified antibody isotypes for a patient subset demonstrated that the relative proportion of antigen-specific IgGs decreased over time for severe disease, but the relative proportion of antigen-specific IgA binding remained at the same magnitude at 5 and 9 months post-first symptom onset. Further, the relative proportion of IgM binding decreased for S antigens but remained the same for NP antigens. This may support antigen-specific serum IgA and IgM playing a role in maintaining longer-term protection, important for developing and assessing vaccine strategies. Overall, these data demonstrate the multiplexed platform as a sensitive and useful platform for expanded humoral immunity studies, allowing detailed elucidation of antibody isotypes response against multiple antigens. This approach will be useful for monoclonal antibody therapeutic studies and screening of donor polyclonal antibodies for patient infusions.


Conflict of interest statement

The authors have declared that no competing interests exist.

Figures

Fig 1
Fig 1. Construction and optimisation of a SARS-CoV-2 protein antigen microarray and fractionation of serum immunoglobulins.
(A) Cartoon of SARS-CoV-2 protein antigens conjugated to a microarray surface in replicate subarray format. Each subarray was incubated with a purified serum antibody isotype and serum antibody binding to specific antigens was detected using fluorescently labelled anti-isotype antibodies. (B) Cartoon of a typical SARS-CoV-2 antigen microarray slide with six replicate subarrays. (C) Bar charts representing the binding intensity of diluted serum (1/100 in PBS-T) and purified serum (C) IgG, (D) IgA, and (E) IgM from a COVID-19 patient (203-0018-1) detected by the appropriate fluorescently-labelled anti-isotype antibody. (F) Flow chart depicting sequential serum immunoglobulin isotype purification procedure. (G) Purified serum IgG, IgA, and IgM (1 μg each) from a COVID-19 patient (203–0025) electrophoresed on a 4–12% Bis-Tris SDS-PAGE gel and silver stained. L, molecular mass ladder (kDa).
Fig 2
Fig 2. Bar charts representing the binding intensity of purified antibody isotypes from a selected patient from each cohort to immobilised antigen detected by fluorescently-labelled anti-isotype antibodies.
(A) IgG, (B) IgA, and (C) IgM. Non-COVID-19 (NC) sample NC1, mild patient 203–0077, moderate 203–0009, and severe 203–0004. Data from the same experiments are represented as two separate bar charts, one for low and one for high binding intensities.
Fig 3
Fig 3. Serum IgG samples by COVID-19 disease severity (mild, moderate, severe) binding to the various SARS-CoV-2 protein antigens compared to no disease (NC).
Each antigen was plotted using a boxplot with relative fluorescence intensity of binding on the y-axis and COVID-19 disease cohort on the x-axis.
Fig 4
Fig 4. Serum IgA samples by COVID-19 disease severity (mild, moderate, severe) binding to the various SARS-CoV-2 protein antigens compared to no disease (NC).
Each antigen was plotted using a boxplot with relative fluorescence intensity of binding on the y-axis and COVID-19 disease cohort on the x-axis.
Fig 5
Fig 5. Serum IgM samples by COVID-19 disease severity (mild, moderate, severe) binding to the various SARS-CoV-2 protein antigens compared to no disease (NC).
Each antigen was plotted using a boxplot with relative fluorescence intensity of binding on the y-axis and COVID-19 disease cohort on the x-axis.
Fig 6
Fig 6. Dynamic binding of patient serum antibody isotypes over short to medium term for severe COVID-19 disease.
Bar charts represent binding intensity data for serum (A,B) IgG, (C,D) IgA, and (E,F) IgM binding to SARS-CoV-2 antigens for patient 203–0004 (A,C,D; M, 42 years) and 203–0023 (B,D,F; F, 56 years) at 18 and 29 days, and 11 and 33 days post-first symptom onset, respectively. Bars represent the average binding intensity from three replicate experiments with error bars of +/- one standard deviation (SD).
Fig 7
Fig 7. Dynamic binding of patient serum antibody isotypes over short to medium term for moderate and mild COVID-19 disease.
Bar charts represent binding intensity data for serum (A,B) IgG, (C,D) IgA, and (E,F) IgM binding to SARS-CoV-2 antigens for patient 203–0054 (A,C,D; moderate, M, 50 years) and 203–0041 (B,D,F; mild, M, 80 years) at 9 and 12 days, and 19 and 34 days post-first symptom onset, respectively. Bars represent the average binding intensity from three replicate experiments with error bars of +/- 1 SD.
Fig 8
Fig 8. Dynamic binding of patient serum antibody isotypes over longer term for severe COVID-19 disease.
Bar charts represent binding intensity data for serum (A,B) IgG, (C,D) IgA, and (E,F) IgM binding to SARS-CoV-2 antigens for patient 203–0015 (A,C,D; M, 69 years) and 203–0018 (B,D,F; M, 66 years) at 16 and 145 days, and 19 and 271 days post-first symptom onset, respectively. Bars represent the average binding intensity from three replicate experiments with error bars of +/- 1 SD.
Fig 9
Fig 9. Serum antibody response of double vaccinated healthy donors with no previous SARS-CoV-2 infection.
Bar charts represent binding intensity of purified serum (A) IgG, (B) IgA, and (C) IgM from two double vaccinated healthy donors V1 (M, 60 years old) and V2 (F, 34 years old) with no previous SARS-CoV-2 infection (V1 and V2) to immobilised antigen detected by fluorescently-labelled anti-isotype antibodies. Bars represent the average binding intensity from three replicate experiments with error bars of +/- 1 SD.

References

    1. World Health Organisation. WHO Coronavirus (COVID-19) Dashboard. 2022; Available from: https://covid19.who.int/.
    1. Post N, Eddy D, Huntley C, van Schalkwyk MCI, Shrotri M, Leeman D, et al.. Antibody response to SARS-CoV-2 infection in humans: A systematic review. PLOS ONE. 2021; 15(12): e0244126. 10.1371/journal.pone.0244126 - DOI - PMC - PubMed
    1. Sterlin D, Mathian A, Miyara M, Mohr A, Anna F, Claër L, et al.. IgA dominates the early neutralizing antibody response to SARS-CoV-2. Science Translational Medicine. 2021; 13(577): eabd2223. 10.1126/scitranslmed.abd2223 - DOI - PMC - PubMed
    1. Wei J, Matthews PC, Stoesser N, Maddox T, Lorenzi L, Studley R, et al.. Anti-spike antibody response to natural SARS-CoV-2 infection in the general population. Nature Communications. 2021; 12(1): 6250. 10.1038/s41467-021-26479-2 - DOI - PMC - PubMed
    1. Peghin M, Martino MD, Fabris M, Palese A, Visintini E, Graziano E, et al.. The fall in antibody response to SARS-CoV-2: a longitudinal study of asymptomatic to critically ill patients up to 10 months after recovery. Journal of Clinical Microbiology. 2021; 59(11): e01138–21. 10.1128/JCM.01138-21 - DOI - PMC - PubMed

Publication types