. 2023 May 1;4(5):659-672.
doi: 10.34067/KID.0000000000000115. Epub 2023 Mar 30.

Clinical Profiles and Patterns of Kidney Disease Progression in C3 Glomerulopathy

Affiliations

Clinical Profiles and Patterns of Kidney Disease Progression in C3 Glomerulopathy

Fernando Caravaca-Fontán et al. Kidney360. .

Abstract

Key Points:

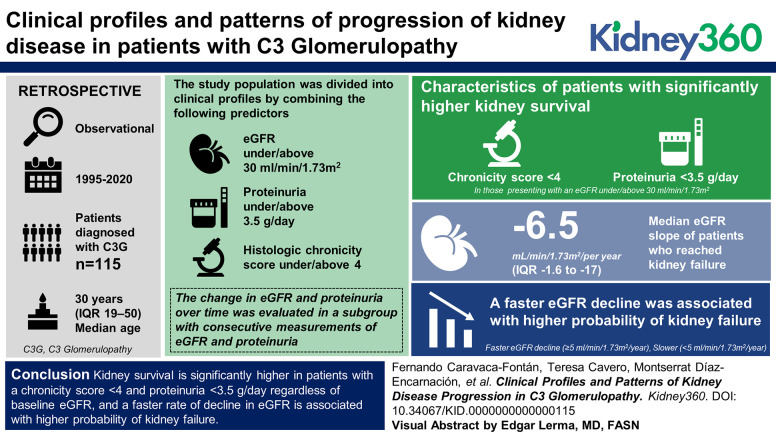
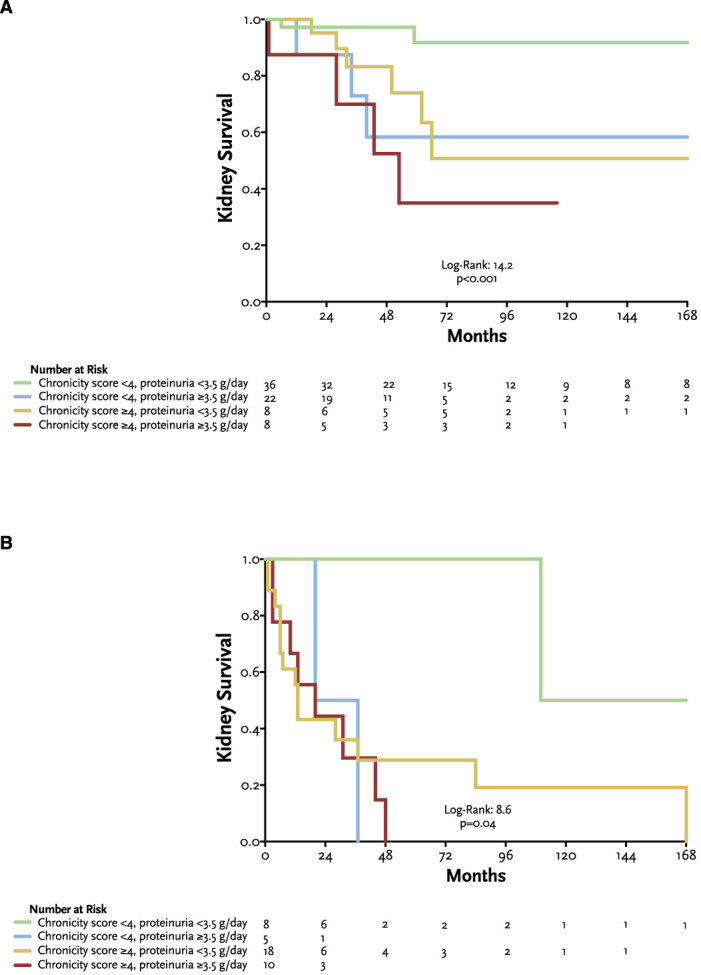
  1. Kidney survival in C3 glomerulopathy is significantly higher in patients with a disease chronicity score <4 and proteinuria <3.5 g/d, regardless of baseline eGFR.

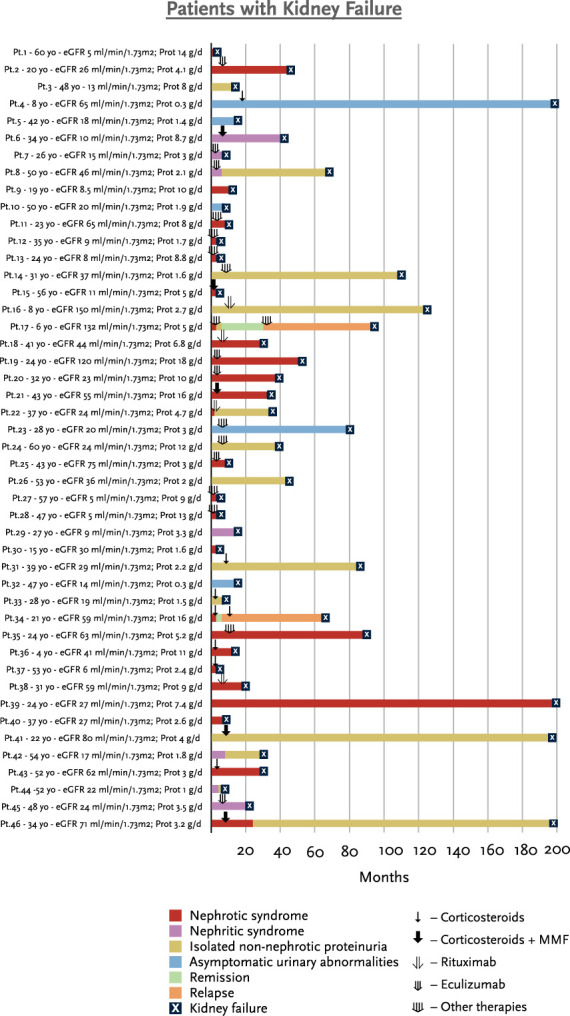
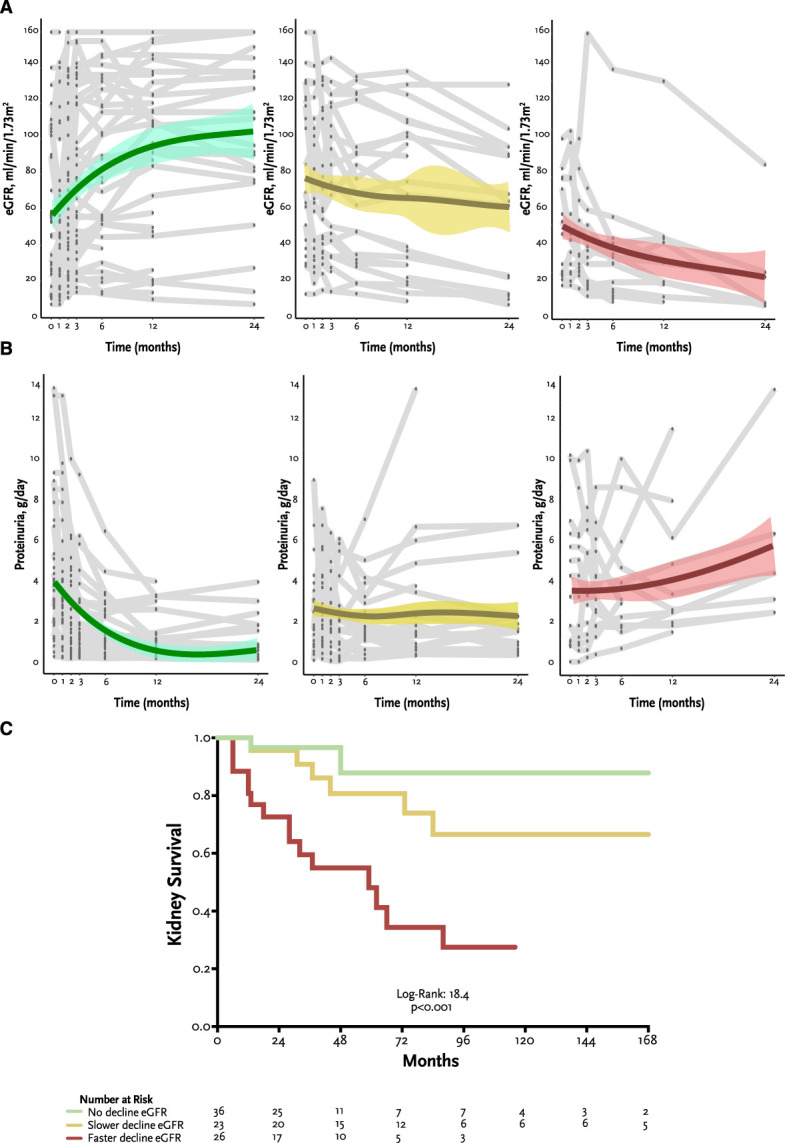
  2. A faster eGFR decline in C3 glomerulopathy is associated with higher probability of kidney failure.

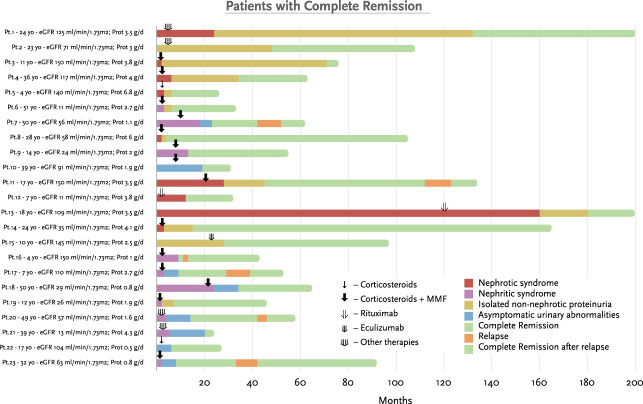
  3. Patients with glomerulopathy with a progressive reduction in proteinuria over time did not reach kidney failure.

Background: C3 glomerulopathy is a rare kidney disease, which makes it difficult to collect large cohorts of patients to better understand its variability. The aims of this study were to describe the clinical profiles and patterns of progression of kidney disease.

Methods: This was a retrospective, observational cohort study. Patients diagnosed with C3 glomerulopathy between 1995 and 2020 were enrolled. Study population was divided into clinical profiles by combining the following predictors: eGFR under/above 30 ml/min per 1.73 m2, proteinuria under/above 3.5 g/d, and histologic chronicity score under/above 4. The change in eGFR and proteinuria over time was evaluated in a subgroup with consecutive measurements of eGFR and proteinuria.

Results: One hundred and fifteen patients with a median age of 30 years (interquartile range 19–50) were included. Patients were divided into eight clinical profiles. Kidney survival was significantly higher in patients with a chronicity score <4 and proteinuria <3.5 g/d, both in those presenting with an eGFR under/above 30 ml/min per 1.73 m2. The median eGFR slope of patients who reached kidney failure was −6.5 ml/min per 1.73 m2 per year (interquartile range −1.6 to −17). Patients who showed a reduction in proteinuria over time did not reach kidney failure. On the basis of the rate of eGFR decline, patients were classified as faster eGFR decline (≥5 ml/min per 1.73 m2 per year), slower (<5 ml/min per 1.73 m2 per year), and those without decline. A faster eGFR decline was associated with higher probability of kidney failure.

Conclusions: Kidney survival is significantly higher in patients with a chronicity score <4 and proteinuria <3.5 g/d regardless of baseline eGFR, and a faster rate of decline in eGFR is associated with higher probability of kidney failure.


Figures

None
Graphical abstract
Figure 1
Figure 1
Detailed description of patients who reached kidney failure at the last follow-up in the overall cohort (n=46, out of total 115 patients). Each Pt is identified by a correlative number (e.g., Pt.1, Pt.2...). Age at diagnosis is shown (yo: years old). eGFR at baseline is expressed as ml/min per 1.73 m2. Prot at baseline is expressed as grams/day (g/d). Each bar represents the clinical course of each patient, and the colors represent the type of clinical presentation/outcome over time. Each arrow represents the type of immunosuppressive therapy prescribed and the time at which the treatment was first prescribed. Prot, Proteinuria; Pt, patient.
Figure 2
Figure 2
Detailed description of patients who achieved complete remission at the last follow-up in the overall cohort (n=46, out of total 115 patients). Each Pt is identified by a correlative number (e.g., Pt.1, Pt.2...). Age at diagnosis is shown (yo: years old). eGFR at baseline is expressed as ml/min per 1.73 m2. Prot at baseline is expressed as grams/day (g/d). Each bar represents the clinical course of each patient, and the colors represent the type of clinical presentation/outcome over time. Each arrow represents the type of immunosuppressive therapy prescribed and the time at which the treatment was first prescribed. Prot, Proteinuria; Pt, patient.
Figure 3
Figure 3
Kidney survival according to clinical profiles. (A) Kaplan–Meier curves for kidney survival in patients with baseline eGFR ≥30 ml/min per 1.73 m2, according to clinical profiles. (B) Kaplan–Meier curves for kidney survival in patients with baseline eGFR <30 ml/min per 1.73 m2, according to clinical profiles.
Figure 4
Figure 4
Patterns of eGFR and proteinura change over time. (A) Subject-specific longitudinal trajectories of eGFR over follow-up (time points are 0, 1, 2, 3, 6, 12, and 24 months) in a subgroup of 85 patients with consecutive measurements of eGFR and proteinuria over time. The gray lines show individual subject trajectories, and the color lines show LOESS with the corresponding 95% confidence interval. The first graph (in green) represents patients with no decline of eGFR over time; the second graph (in yellow) represents patients with a slower eGFR decline (<5 ml/min per 1.73 m2 per year); and the third graph represents patients with a faster eGFR decline (≥5 ml/min per 1.73 m2 per year); (B) Subject-specific longitudinal trajectories of 24-hour proteinuria over follow-up (time points are 0, 1, 2, 3, 6, 12, and 24 months) in a subgroup of 85 patients with consecutive measurements of eGFR and proteinuria over time. The gray lines show individual subject trajectories, and the color lines show LOESS with the corresponding 95% confidence interval. The first graph (in green) represents patients with no decline of eGFR over time; the second graph (in yellow) represents patients with a slower eGFR decline (<5 ml/min per 1.73 m2 per year); the third graph represents patients with a faster eGFR decline (≥5 ml/min per 1.73 m2 per year). (C) Kaplan–Meier curves for kidney survival according to the rate of decline of eGFR (patients with faster eGFR decline, slower eGFR decline, and no eGFR decline). LOESS, locally weighted smoothing plots.

Similar articles

Cited by

References

    1. Smith RJH Appel GB Blom AM, et al. . C3 glomerulopathy—understanding a rare complement-driven renal disease. Nat Rev Nephrol. 2019;15(3):129–143. doi:10.1038/s41581-018-0107-2 - DOI - PMC - PubMed
    1. Caravaca-Fontán F, Lucientes L, Cavero T. Update on C3 glomerulopathy: a complement-mediated disease. Nephron. 2020;144(6):272–280. doi:10.1159/000507254 - DOI - PubMed
    1. Fakhouri F, Le Quintrec M, Frémeaux-Bacchi V. Practical management of C3 glomerulopathy and Ig-mediated MPGN: facts and uncertainties. Kidney Int. 2020;98(5):1135–1148. doi:10.1016/j.kint.2020.05.053 - DOI - PubMed
    1. Bomback AS Santoriello D Avasare RS, et al. . C3 glomerulonephritis and dense deposit disease share a similar disease course in a large United States cohort of patients with C3 glomerulopathy. Kidney Int. 2018;93(4):977–985. doi:10.1016/j.kint.2017.10.022 - DOI - PubMed
    1. Medjeral-Thomas NR O’Shaughnessy MM O’Regan JA, et al. . C3 glomerulopathy: clinicopathologic features and predictors of outcome. Clin J Am Soc Nephrol. 2014;9(1):46–53. doi:10.2215/CJN.04700513 - DOI - PMC - PubMed

Publication types