

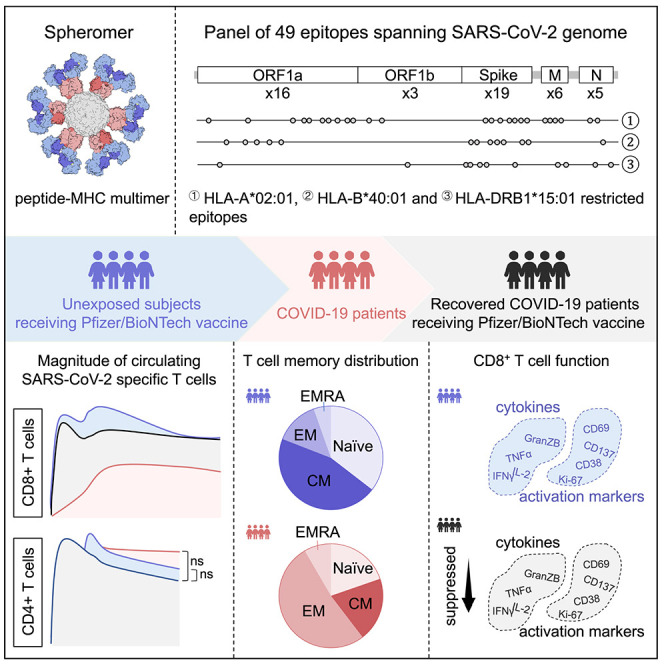
Spheromers reveal robust T cell responses to the Pfizer/BioNTech vaccine and attenuated peripheral CD8+ T cell responses post SARS-CoV-2 infection
- PMID: 36996809
- PMCID: PMC10017386
- DOI: 10.1016/j.immuni.2023.03.005
Spheromers reveal robust T cell responses to the Pfizer/BioNTech vaccine and attenuated peripheral CD8+ T cell responses post SARS-CoV-2 infection
Abstract
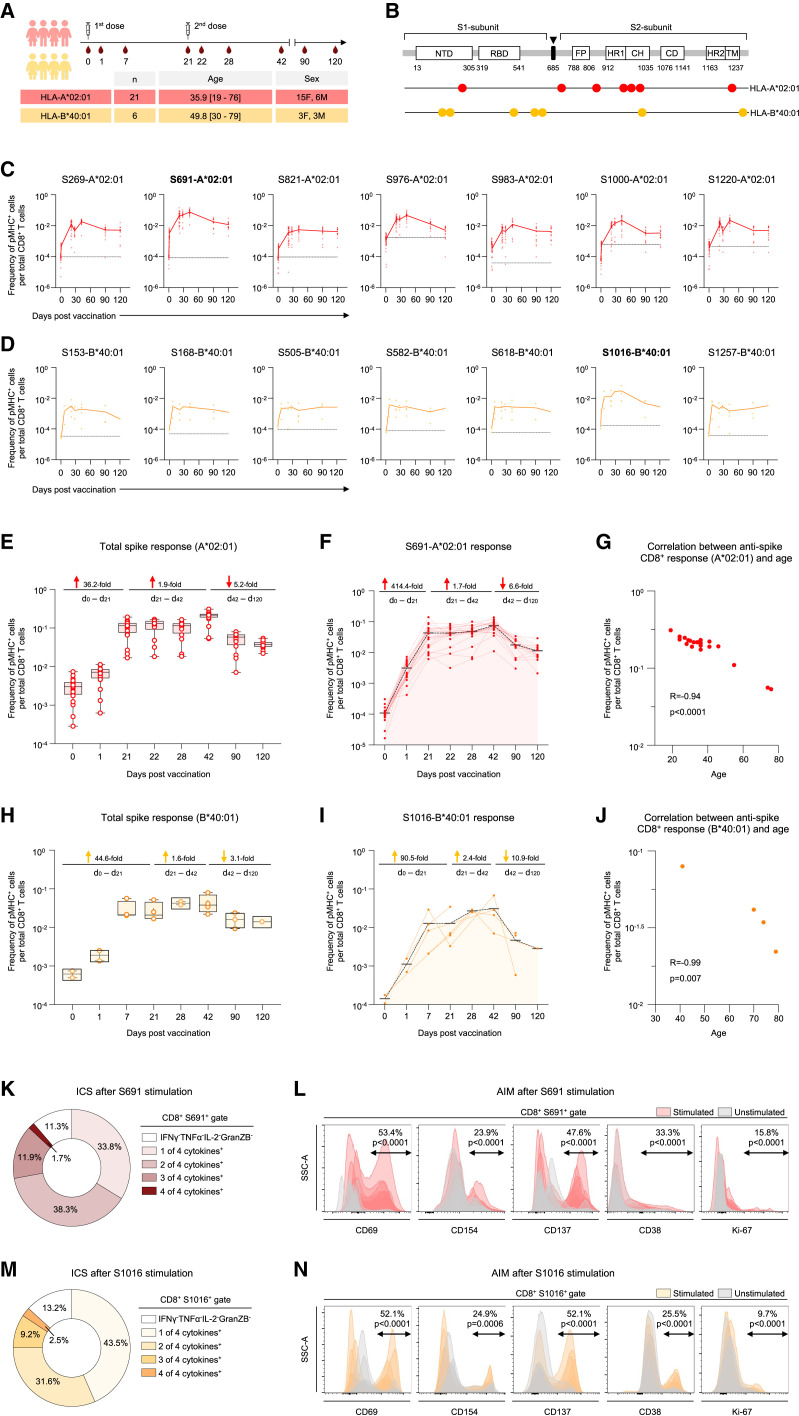
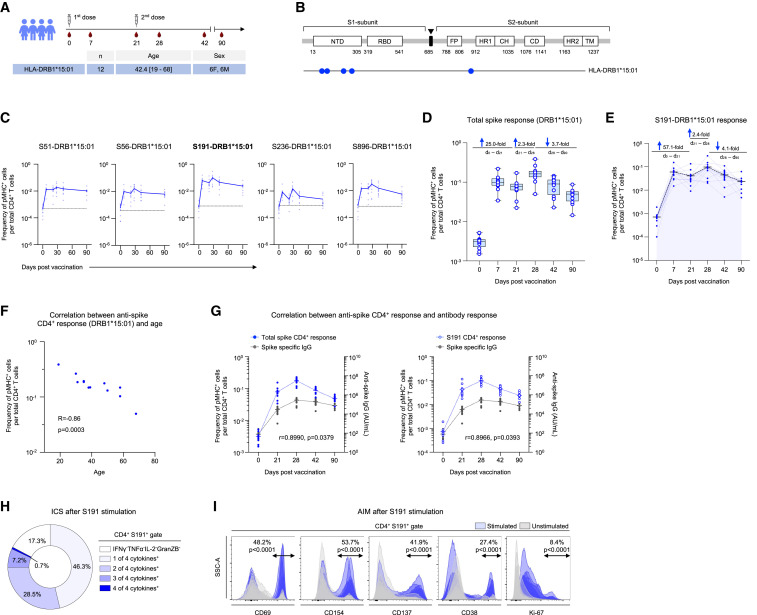
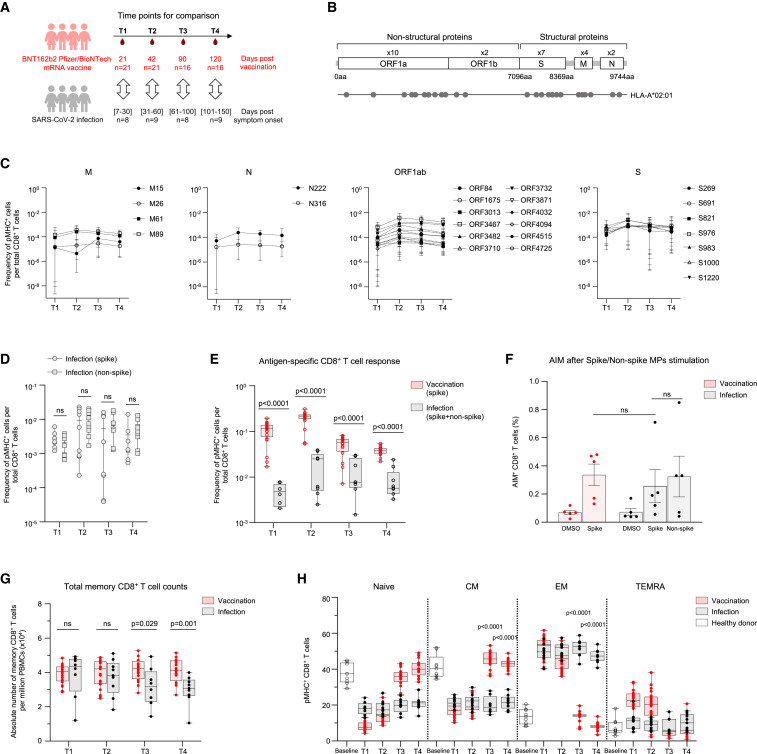
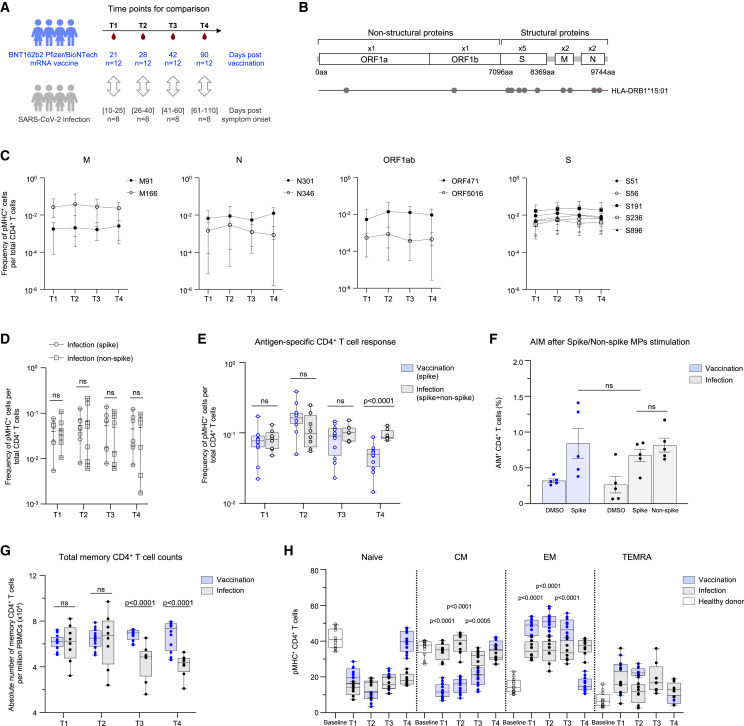
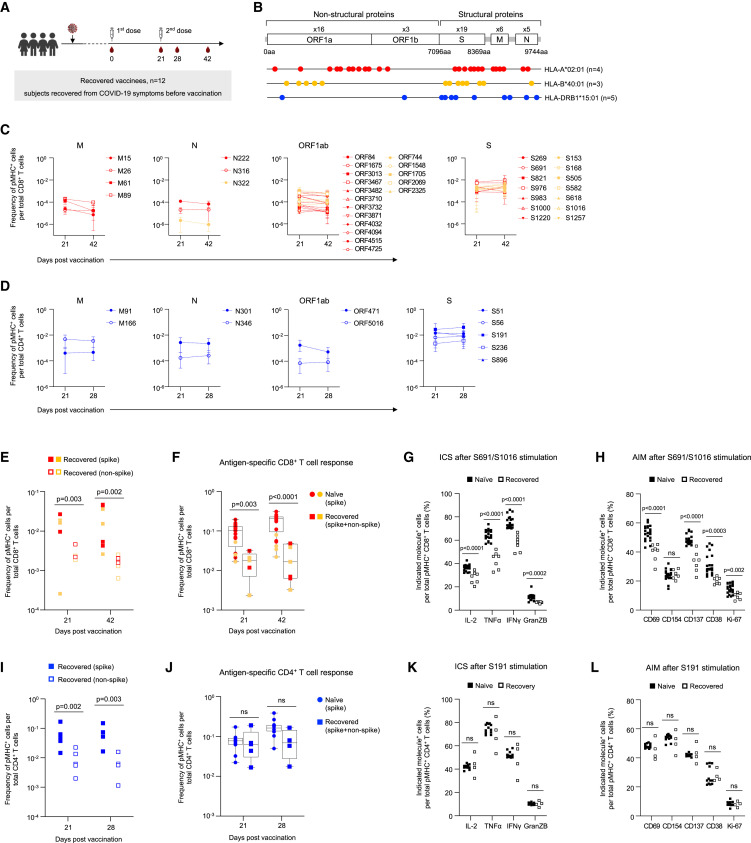
T cells are a critical component of the response to SARS-CoV-2, but their kinetics after infection and vaccination are insufficiently understood. Using "spheromer" peptide-MHC multimer reagents, we analyzed healthy subjects receiving two doses of the Pfizer/BioNTech BNT162b2 vaccine. Vaccination resulted in robust spike-specific T cell responses for the dominant CD4+ (HLA-DRB1∗15:01/S191) and CD8+ (HLA-A∗02/S691) T cell epitopes. Antigen-specific CD4+ and CD8+ T cell responses were asynchronous, with the peak CD4+ T cell responses occurring 1 week post the second vaccination (boost), whereas CD8+ T cells peaked 2 weeks later. These peripheral T cell responses were elevated compared with COVID-19 patients. We also found that previous SARS-CoV-2 infection resulted in decreased CD8+ T cell activation and expansion, suggesting that previous infection can influence the T cell response to vaccination.
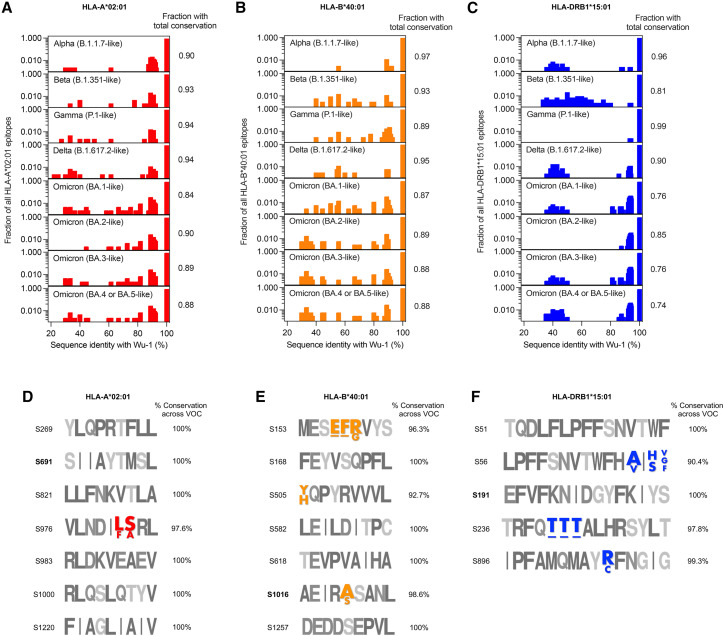
Keywords: COVID-19; Pfizer/BioNTech mRNA vaccine; SARS-CoV-2; SARS-CoV-2 variants of concern; antigen-specific T cell responses; peptide-MHC multimer; peripheral CD4(+) T cell responses; peripheral CD8(+) T cell responses; spheromer.
Copyright © 2023 The Authors. Published by Elsevier Inc. All rights reserved.
Conflict of interest statement
Declaration of interests V.M. and M.M.D. are inventors on a patent application (PCT/US2021/064378) on the spheromer technology described in this work.
Figures
References
-
- Goel R.R., Painter M.M., Apostolidis S.A., Mathew D., Meng W., Rosenfeld A.M., Lundgreen K.A., Reynaldi A., Khoury D.S., Pattekar A., et al. mRNA vaccines induce durable immune memory to SARS-CoV-2 and variants of concern. Science. 2021;374:abm0829. doi: 10.1126/science.abm0829. - DOI - PMC - PubMed
-
- Röltgen K., Nielsen S.C.A., Silva O., Younes S.F., Zaslavsky M., Costales C., Yang F., Wirz O.F., Solis D., Hoh R.A., et al. Immune imprinting, breadth of variant recognition, and germinal center response in human SARS-CoV-2 infection and vaccination. Cell. 2022;185 doi: 10.1016/j.cell.2022.01.018. 1025–1040.e14. - DOI - PMC - PubMed
Publication types
MeSH terms
Substances
Grants and funding
LinkOut - more resources
Full Text Sources
Medical
Molecular Biology Databases
Research Materials
Miscellaneous
