. 2023 May;617(7961):564-573.
doi: 10.1038/s41586-023-06003-w. Epub 2023 Mar 30.

Genomic investigations of unexplained acute hepatitis in children

Sofia Morfopoulou #  1   2 Sarah Buddle #  1 Oscar Enrique Torres Montaguth  1 Laura Atkinson  3 José Afonso Guerra-Assunção  1 Mahdi Moradi Marjaneh  2   4 Riccardo Zennezini Chiozzi  5 Nathaniel Storey  3 Luis Campos  6 J Ciaran Hutchinson  6 John R Counsell  7 Gabriele Pollara  8 Sunando Roy  1 Cristina Venturini  1 Juan F Antinao Diaz  7 Ala'a Siam  7   9 Luke J Tappouni  7 Zeinab Asgarian  7 Joanne Ng  9 Killian S Hanlon  7 Alexander Lennon  3 Andrew McArdle  2 Agata Czap  8 Joshua Rosenheim  8 Catarina Andrade  6 Glenn Anderson  6 Jack C D Lee  3 Rachel Williams  10 Charlotte A Williams  10 Helena Tutill  10 Nadua Bayzid  10 Luz Marina Martin Bernal  10 Hannah Macpherson  11 Kylie-Ann Montgomery  10   11 Catherine Moore  12 Kate Templeton  13 Claire Neill  14 Matt Holden  15   16 Rory Gunson  17 Samantha J Shepherd  17 Priyen Shah  2 Samantha Cooray  2 Marie Voice  18 Michael Steele  18 Colin Fink  18 Thomas E Whittaker  19 Giorgia Santilli  19 Paul Gissen  10 Benedikt B Kaufer  20 Jana Reich  20 Julien Andreani  21   22 Peter Simmonds  21 Dimah K Alrabiah  10   23 Sergi Castellano  10   24 Primrose Chikowore  25 Miranda Odam  25 Tommy Rampling  8   26   27 Catherine Houlihan  8   26   28 Katja Hoschler  26 Tiina Talts  26 Cristina Celma  26 Suam Gonzalez  26 Eileen Gallagher  26 Ruth Simmons  26 Conall Watson  26 Sema Mandal  26 Maria Zambon  26 Meera Chand  26 James Hatcher  3 Surjo De  3 Kenneth Baillie  25 Malcolm Gracie Semple  29   30 DIAMONDS ConsortiumPERFORM ConsortiumISARIC 4C InvestigatorsJoanne Martin  31 Ines Ushiro-Lumb  32 Mahdad Noursadeghi  8 Maesha Deheragoda  33 Nedim Hadzic  33 Tassos Grammatikopoulos  33 Rachel Brown  34 Chayarani Kelgeri  35 Konstantinos Thalassinos  5   36   37 Simon N Waddington  9   38 Thomas S Jacques  6   39 Emma Thomson  40 Michael Levin  2 Julianne R Brown  3 Judith Breuer  41   42
Collaborators, Affiliations

Genomic investigations of unexplained acute hepatitis in children

Sofia Morfopoulou et al. Nature. 2023 May.

Abstract

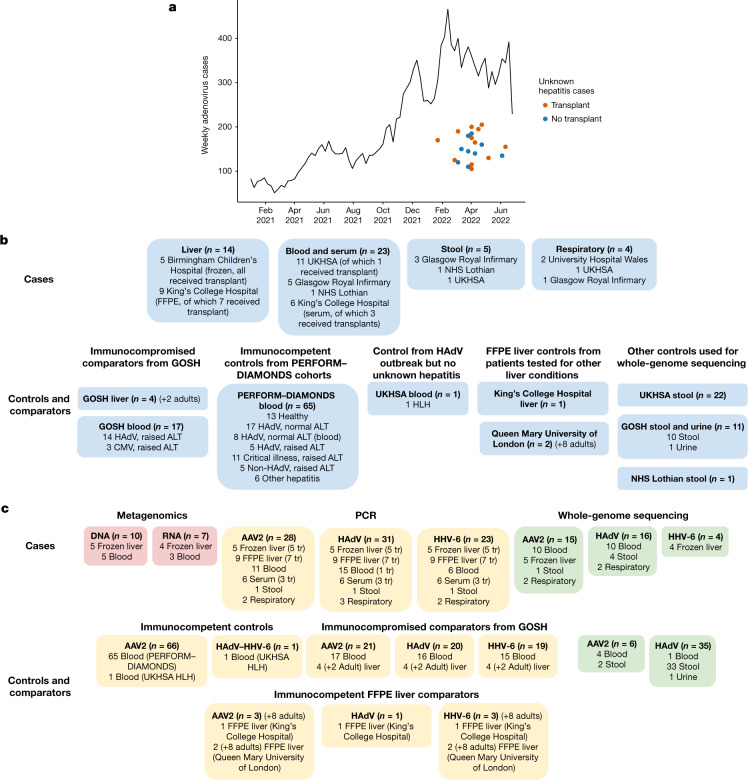
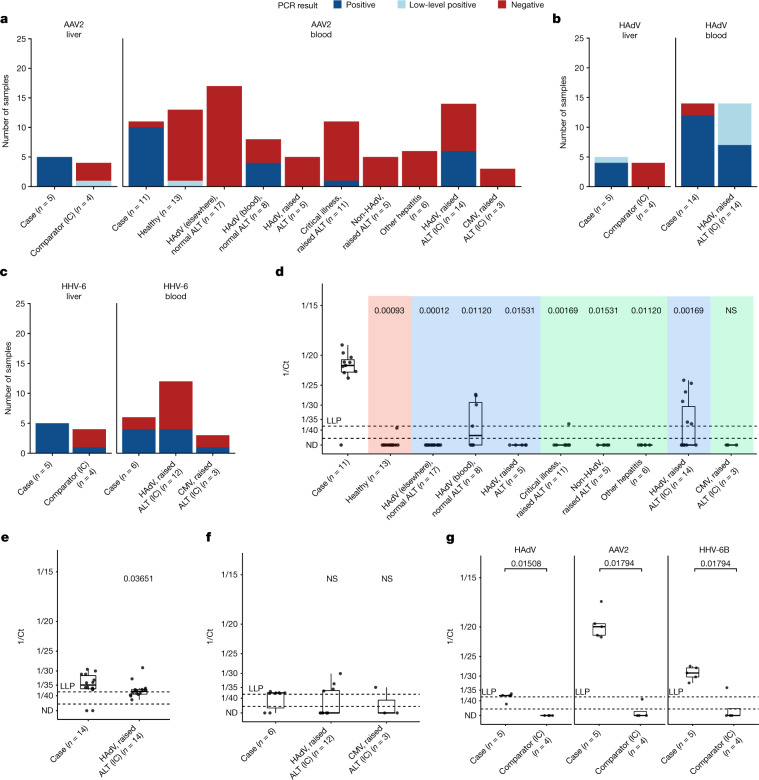
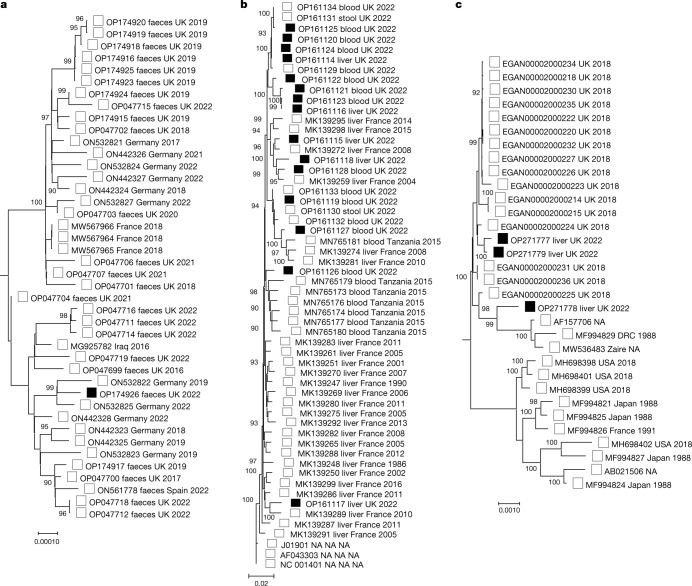
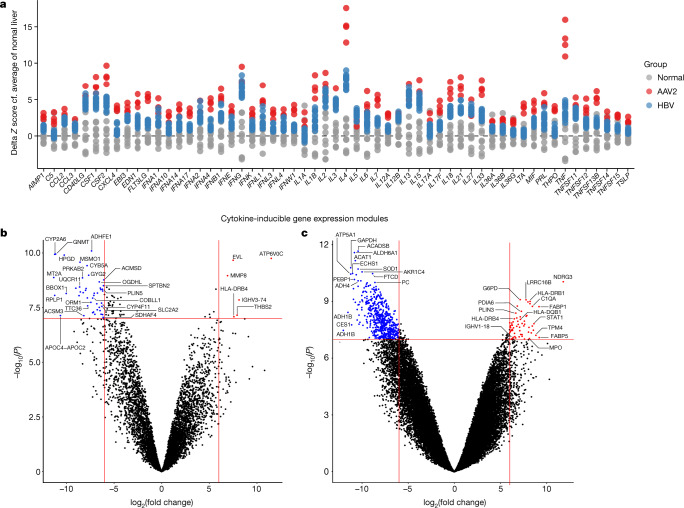
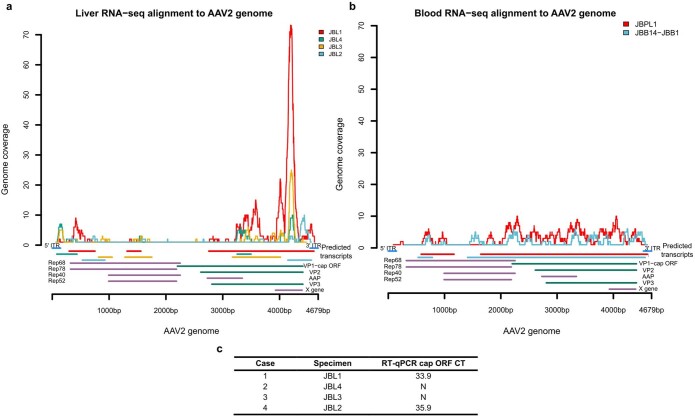
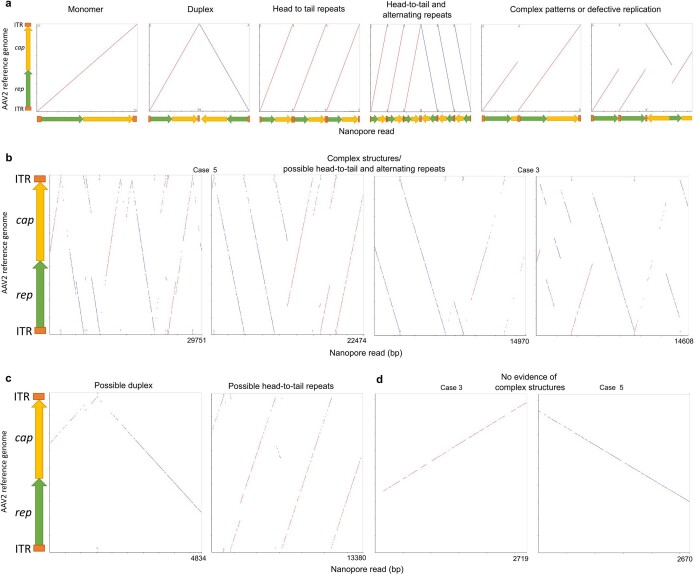
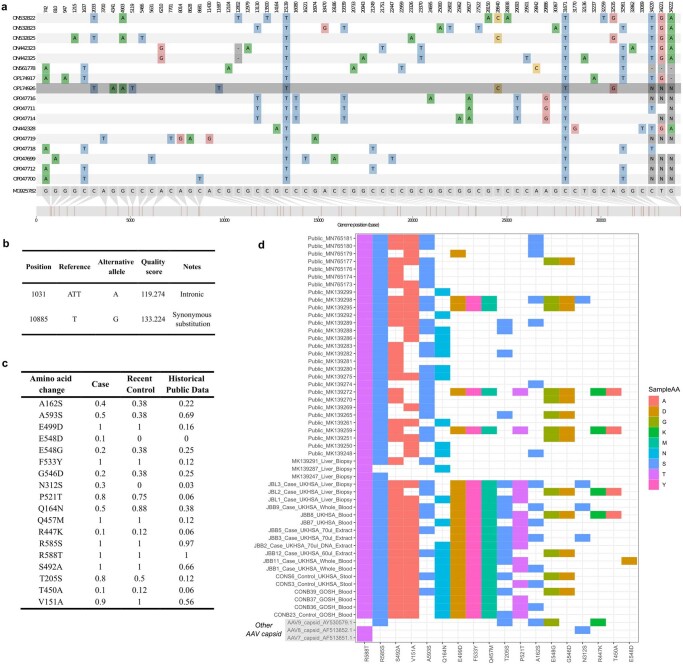
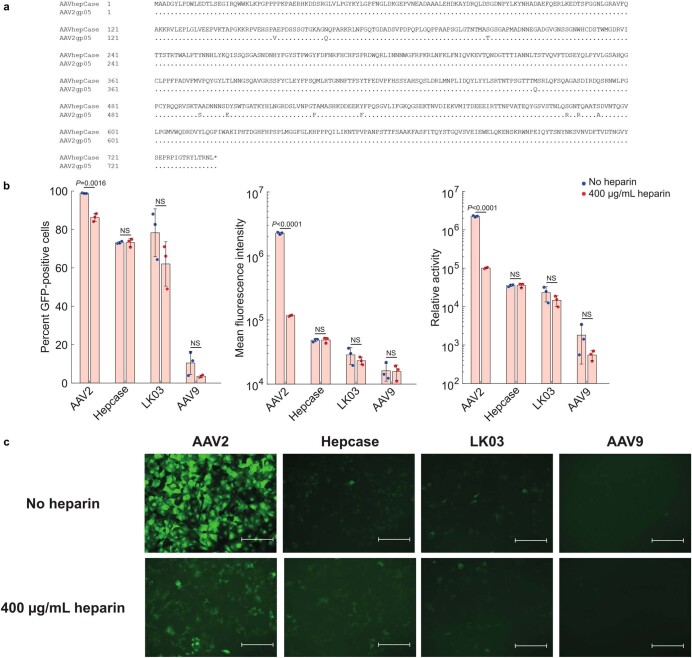
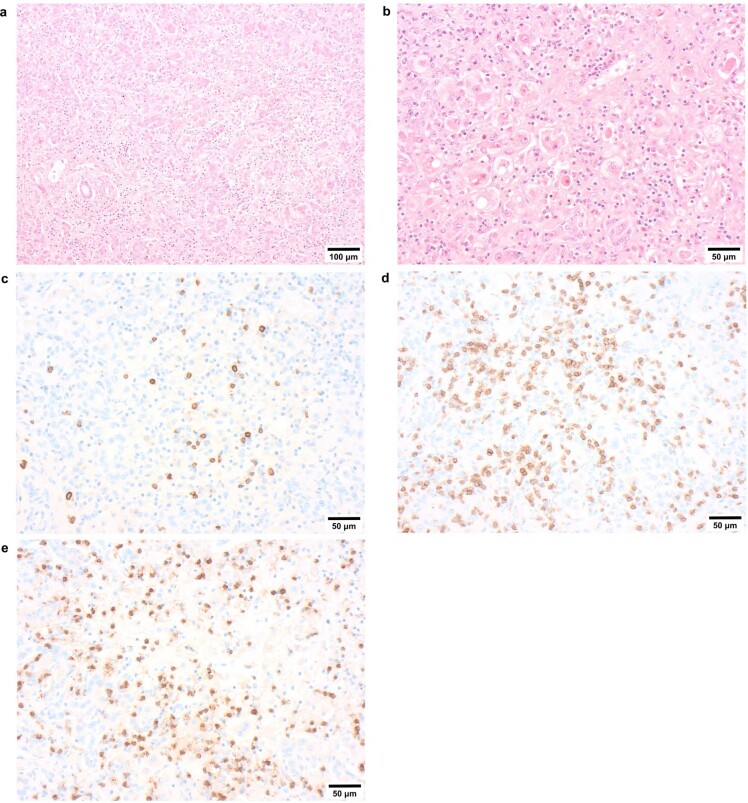
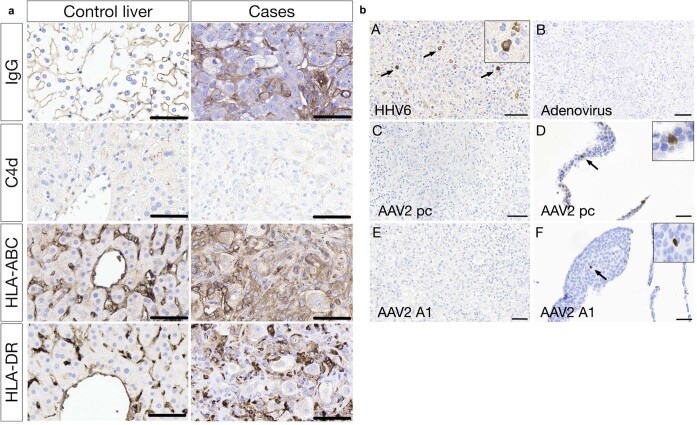
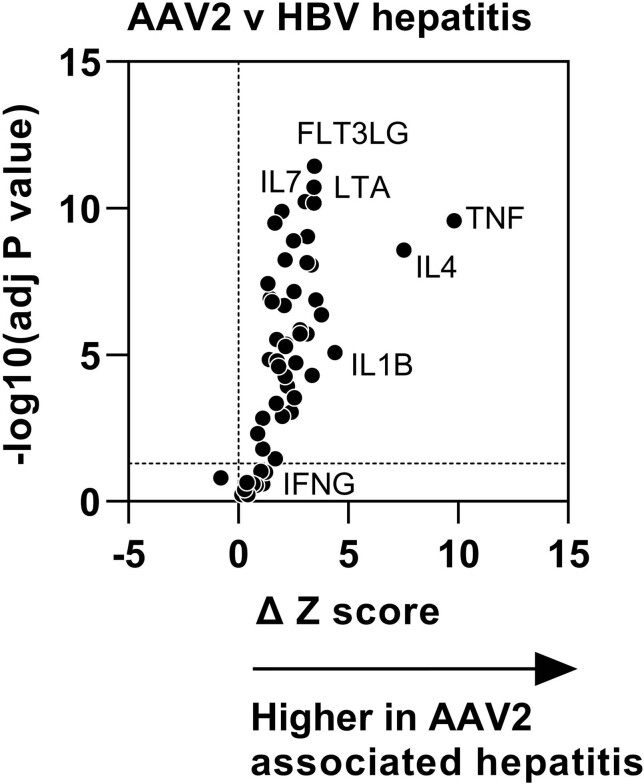
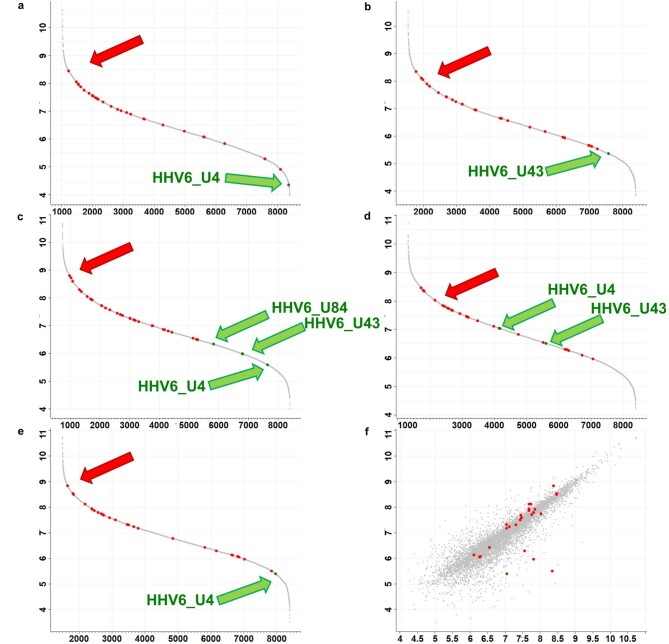
Since its first identification in Scotland, over 1,000 cases of unexplained paediatric hepatitis in children have been reported worldwide, including 278 cases in the UK1. Here we report an investigation of 38 cases, 66 age-matched immunocompetent controls and 21 immunocompromised comparator participants, using a combination of genomic, transcriptomic, proteomic and immunohistochemical methods. We detected high levels of adeno-associated virus 2 (AAV2) DNA in the liver, blood, plasma or stool from 27 of 28 cases. We found low levels of adenovirus (HAdV) and human herpesvirus 6B (HHV-6B) in 23 of 31 and 16 of 23, respectively, of the cases tested. By contrast, AAV2 was infrequently detected and at low titre in the blood or the liver from control children with HAdV, even when profoundly immunosuppressed. AAV2, HAdV and HHV-6 phylogeny excluded the emergence of novel strains in cases. Histological analyses of explanted livers showed enrichment for T cells and B lineage cells. Proteomic comparison of liver tissue from cases and healthy controls identified increased expression of HLA class 2, immunoglobulin variable regions and complement proteins. HAdV and AAV2 proteins were not detected in the livers. Instead, we identified AAV2 DNA complexes reflecting both HAdV-mediated and HHV-6B-mediated replication. We hypothesize that high levels of abnormal AAV2 replication products aided by HAdV and, in severe cases, HHV-6B may have triggered immune-mediated hepatic disease in genetically and immunologically predisposed children.


Conflict of interest statement

.J.B. is a member of the MHRA COVID Vaccines and Therapeutics committees; holder of Wellcome Trust, UKRI and NIHR funding; and principal investigator on the GSK LUNAR study to provide MHRA with data on SARS-CoV-2 sequences in patients treated with sotrovimab.

Figures

Fig. 1
Fig. 1. HAdV epidemiology and experimental outline.
a, HAdV in all sample types (epidemiology since January 2022). Source: second-generation surveillance system data, that is, laboratory reports to UKHSA of a positive HAdV result conducted by a laboratory in England and includes any sample type. Dots represent the day of presentation for the 28 of 38 cases for which we had data. b, Case and control specimens by source. CMV, cytomegalovirus; HLH, haemophagocytic lymphohistiocytosis. c, Tests carried out by specimen type. More detail on samples tested and the results can be found in Tables 1 and 2. Not all tests were carried out on all samples due to lack of material. n refers to the total number of cases or controls. The numbers of each sample type may not sum to this total because samples of more than one type were sometimes taken from the same patient. For details, see Table 1. FFPE, formalin-fixed paraffin-embedded; tr, received liver transplant.
Fig. 2
Fig. 2. Proportion of positive cases and viral loads (Ct values) for cases and controls.
a, Proportion of samples positive for AAV2. b, Proportion of samples positive for HAdV. c, Proportion of samples positive for HHV-6. Ct values less than 38 were defined as positive. Ct values more than 38 where the virus was detected within the maximum 45 cycles were defined as low-level positive (LLP). d, AAV2 in blood samples from cases, PERFORM–DIAMONDS immunocompetent controls and immunocompromised comparators (IC). HAdV infection is in blue, non-HAdV hepatitis is in green and healthy is in red. e, HAdV levels in whole blood from cases and immunocompromised comparators. f, HHV-6 in whole blood from cases and immunocompromised comparators. g, HAdV, AAV2 and HHV-6 levels in frozen liver tissue from cases and immunocompromised comparators. In the box plots, the bold middle line represents the median and the upper and lower horizontal lines represent the upper (75th percentile) and lower (25th percentile) quartiles, respectively. The whiskers show maximum and minimum values. Each point represents one case or control. n Refers to the number of cases or controls. Where more than one sample for a case was tested, the midpoint of the Ct was plotted. All repeat tests had values if less than 2 Ct values apart, that is, within the limits of methodological error. The upper dashed line marked LLP indicates the LLP threshold (Ct = 38). Points below the second dashed line represent samples below the limit of PCR detection (Ct = 45).  Wilcoxon non-parametric rank sum tests were conducted for e and g and a Kruskal–Wallis test followed by pairwise Wilcoxon tests with a Benjamini–Hochberg correction for multiple comparisons were used for d and f. All tests were two-tailed. Numbers show the P value compared with cases. ND, not determined (negative PCR result); NS, not significant.
Fig. 3
Fig. 3. Phylogenetic trees for HAdV, AAV2 and HHV-6B.
Maximum likelihood phylogenetic trees combining reference sequences from the RefSeq database, publicly available complete genomes from GenBank, UK non-outbreak controls (open squares) and unexplained hepatitis cases (black squares) for the different viruses involved. a, HAdV. b, AAV2. c, HHV-6B. HAdV and HHV-6B trees are midpoint rooted, whereas AAV2 is rooted from the RefSeq sequence NC_001401.2. Bootstrap values less than 90 are not shown. NA, value not known.
Fig. 4
Fig. 4. Transcriptomic and proteomic analysis of case liver samples.
Transcriptomic analysis was conducted for the five frozen case liver samples from transplanted patients. a, Expressions of cytokine-inducible transcriptional modules in normal liver, and AAV2-associated (n = 4) or HBV-associated (n = 17) hepatitis requiring transplantation are shown as delta Z scores for the expression of each module, reflecting the difference from the average score from normal liver (n = 10) datasets, all from different patients. Each point represents the score form a single dataset or sample. b,c, Volcano plots of differentially expressed proteins (b) and peptides (c). The volcano plots illustrate fold changes and corresponding P values for the comparison between five liver explants from five patients and seven control healthy livers from seven controls. Each dot represents a protein or peptide. The P values were calculated by applying two-tailed empirical Bayes moderated t-statistics on protein-wise or peptide-wise linear models. Proteins (b) and peptides (c) differentially expressed (absolute log2(fold change) > 6 and P < 1 × 10−7) are coloured red (upregulated) and blue (downregulated). The P values illustrated here are not adjusted for multiple comparisons. Full tables can be found in Supplementary Tables 12–14.
Extended Data Fig. 1
Extended Data Fig. 1. Evidence of AAV2 replication from meta-transcriptomics and RT-PCR.
Mapping of AAV2 reads to the reference genome for a liver RNA-Seq from 4 cases, b blood RNA-Seq from 2 cases. The horizontal lines in the same colour as the coverage graph are the predicted transcripts for each case. The horizontal lines in purple and green are the AAV2 genes. c, RT-PCR results for liver cases. N: Negative PCR result.
Extended Data Fig. 2
Extended Data Fig. 2. Examples of AAV2 complexes.
The y axis shows the coordinates of a full length AAV2 genome (rep gene in green and cap gene in yellow). X axis is the nanopore read with the length of the read indicated. Red dots indicate alignment to the forward strand and blue dots the reverse. a, indicative complexes based on literature b and c. Examples of complex structures with both head to tail and alternating repeats, from a total of n = 25 and n = 75 such reads for cases 3 and 5 respectively. b shows the longest 2 reads for each case. d. Examples of truncated monomeric structures, from a total of n = 27 and n = 103 such reads for cases 3 and 5 respectively (Supplementary Table 3). The longest such read for each case is shown.
Extended Data Fig. 3
Extended Data Fig. 3. HAdV and AAV2 sequence analysis.
a, HAdV SNP plot: Visualisation of the multiple alignment of HAdV-F41 genomic sequences from the same clade as the single sequence from a case (highlighted in grey) (Fig. 3a). Includes both contemporary controls and publicly available HAdV-F41 genomes from GenBank. Consensus-level mutations differing from the reference sequence (bottom) are highlighted across the genome. Genomic position of the mutation is shown at the top of the plot. b, Variants between stool complete HAdV genome from case JBB27 and combined blood partial genomes from other cases. c, Frequency table of capsid residues in cases and historical controls. There is no difference between the capsid sequences of cases and contemporaneously circulating controls. However, there are changes compared with historical controls in all contemporary sequences. None of the recently acquired capsid changes are shared with known hepatotrophic strains in AAV7, 8 and 9. d, Amino acid differences between AAV2 capsid sequences from cases, contemporaneously circulating controls and historical publicly available sequences compared with the AVV2 reference sequence NC_001401.2. Also shown are the capsid sequences from known AAV7, 8 and 9 hepatotropic capsids compared to the reference sequence NC_001401.2.
Extended Data Fig. 4
Extended Data Fig. 4. AAV2 capsid analysis.
a, Amino acid sequence of novel AAV capsid variant. The consensus sequence of the VP1 sequence used for investigation of capsid transduction characteristics (AAVHepcase) is shown with alignment to canonical AAV2 VP1 (AAV2gp05). The alignment shows AAV2 amino acids that are different to the AAVHepcase sequence, with dots indicating matched amino acids sequence. b, In vitro analysis of AAV capsid transduction characteristics. Huh-7 hepatocytes were treated at MOI 100,000 with rAAV vectors containing capsid sequences derived from canonical AAV2, a consensus sequence derived from patient sequencing samples (Hepcase), LK03, or AAV9 (n = 3 each treatment). Transduction efficiency was determined by flow cytometry, based on the percentage of EGFP-positive cells, the EGFP fluorescence intensity in positive cells, and the ‘relative activity’ of EGFP expression (calculated by multiplying %GFP-positive cells by MFI/10070). Transductions were performed in the presence or absence of 400 µg/mL heparin to investigate the role of HSPG interaction. rAAV2 was significantly affected by heparin competition, whereas other capsids, including that derived from AAV Hepcase, were not. Heparin competition significantly affected rAAV2 transduction in terms of percentage of GFP-positive cells (P = 0.0016), MFI (P = 0.000008), and relative activity (P = 0.000008), whereas other capsids, including that derived from AAV Hepcase, were not affected by heparin. All data were analysed by 2-sided t-test with Bonferroni post-hoc analysis. Error bars indicate standard deviation from the mean value. c, Images of Huh-7 cells treated with rAAV vectors in vitro. Images of transduced Huh-7 cells. Each cell population was treated with MOI 100,000 of the relevant viral vector, in the presence or absence of 400 µg/mL heparin and analysed by EGFP fluorescence 72-hours post-transduction. Scale bars = 300 µm.
Extended Data Fig. 5
Extended Data Fig. 5. Representative histology of case livers.
a & b, H&E sections x100 and x200 showing a pattern of acute hepatitis with parenchymal disarray, there is a normal, uninflamed, portal tract lower left image a. Spotty inflammation and apoptotic bodies are shown in b along with perivenular hepatocyte loss/necrosis. Immunohistochemistry shows fewer mature B lymphocytes (CD20 panel c) than T lymphocytes (CD3, panel d, pan T cell marker) most of which are cytotoxic CD8 lymphocytes (panel e). In conclusion the livers of these children have a distinctive pattern of damage which does not indicate a specific aetiology, it does not exclude but does not offer positive support for either autoimmune hepatitis or a direct cytopathic effect of virus on hepatocytes. Each image shows a representative result from histology carried out on a minimum of five cases.
Extended Data Fig. 6
Extended Data Fig. 6. Immunohistochemistry results for cases of unexplained hepatitis and control tissues.
a, Inflammatory markers (IgG, C4d, HLA-ABC, HLA-DR) in acute hepatitis cases and control liver. IgG, HLA-ABC and HLA-DR show a canalicular pattern in the control liver. This pattern is disrupted in the acute hepatitis cases due to the architectural collapse. In addition, there is increased staining associated with inflammatory cell/macrophage infiltrates. C4d shows very weak staining in the acute hepatitis cases associated with macrophages but with without endothelial staining. All stains were undertaken on 5 affected cases and 13 control cases. b, Representative images of the immunohistochemistry (IHC). Acute hepatitis liver explant cases stained for HHV6, arrow shows staining of A representative cells, B adenovirus, AAV2 (C polyclonal antibody, E monoclonal antibody, clone A1). Paraffin embedded AAV2 transfected cell lines stained as positive controls for AAV2 (D polyclonal antibody, F monoclonal antibody, clone A1). All scale bars are 60 micrometres. HHV6, AAV2 (polyclonal) stains were undertaken on 15 affected cases and 13 controls. AAV2 (A1) stains were undertaken on 5 affected cases and 13 control cases. Staining for adenovirus was undertaken on 5 affected cases.
Extended Data Fig. 7
Extended Data Fig. 7. Cytokine inducible transcriptional modules.
Volcano plot of cytokine inducible transcriptional modules (n = 52) comparing their Z score expression in AAV2-associated hepatitis (n = 4) and HBV-associated hepatitis (n = 17) requiring transplantation using two-tailed unpaired t tests with Holm Sidak multiple testing correction for adjusted p values (n refers to number of patients). Each point represents a specific module listed in full in Supplementary Table 13. Labels for selected modules are shown.
Extended Data Fig. 8
Extended Data Fig. 8. HLA and HHV-6B proteins in case livers.
a & b Ranking of the quantified proteins using the log10 of iBAQ values for a JBL1, b JBL2, c JBL3, d JBL4, e JBL5. f, Scatter plot of quantified proteins in sample JBL4 versus JBL5. HLA proteins are highlighted in red. Red arrows denote HLA-DRB1 proteins. HHV6 proteins are highlighted in green and marked with green arrows.

Comment in

References

    1. ECDC–WHO. Joint ECDC–WHO Regional Office for Europe hepatitis of unknown origin in children surveillance bulletin. ECDChttps://cdn.ecdc.europa.eu/novhep-surveillance/ (2022).
    1. UKHSA. Investigation into acute hepatitis of unknown aetiology in children in England: technical briefing 3 (UKHSA, 2022).
    1. UKHSA. Investigation into acute hepatitis of unknown aetiology in children in England: technical briefing 4 (UKHSA, 2022).
    1. Marsh K, et al. Investigation into cases of hepatitis of unknown aetiology among young children, Scotland, 1 January 2022 to 12 April 2022. Euro Surveill. 2022;27:2200318. - PMC - PubMed
    1. Morfopoulou S, Plagnol V. Bayesian mixture analysis for metagenomic community profiling. Bioinformatics. 2015;31:2930–2938. - PMC - PubMed

Publication types

Supplementary concepts