. 2023 Jun:72:101716.
doi: 10.1016/j.molmet.2023.101716. Epub 2023 Mar 28.

Divergent amino acid and sphingolipid metabolism in patients with inherited neuro-retinal disease

Affiliations

Divergent amino acid and sphingolipid metabolism in patients with inherited neuro-retinal disease

Courtney R Green et al. Mol Metab. 2023 Jun.

Abstract

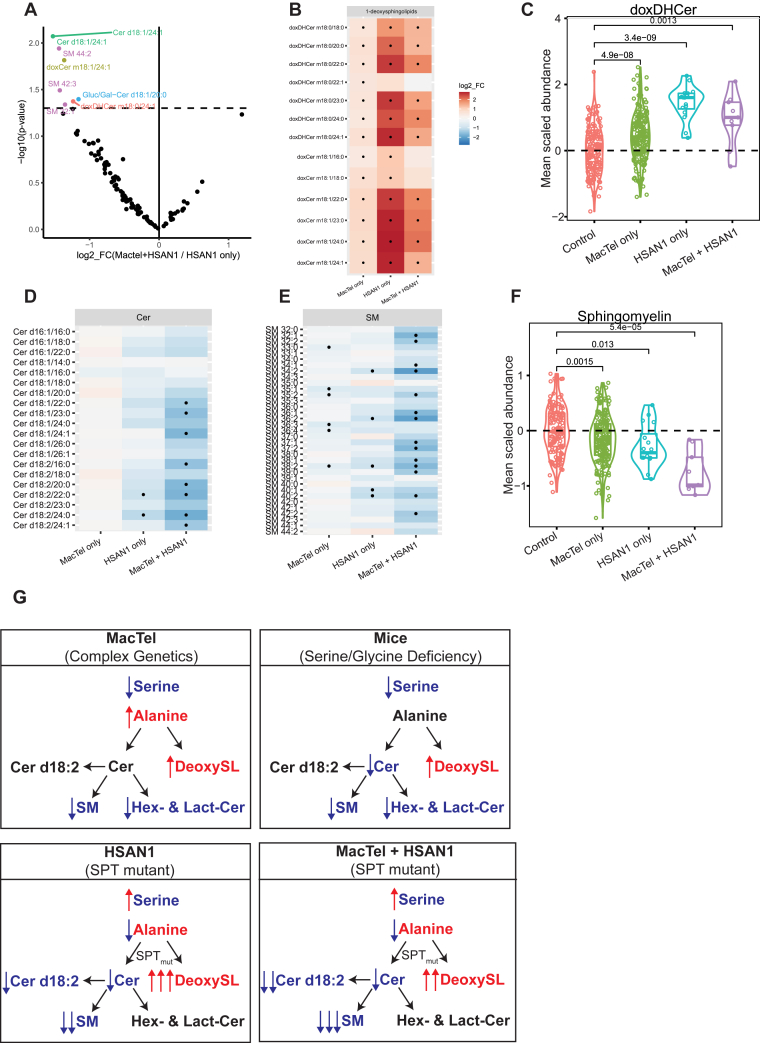
Objectives: The non-essential amino acids serine, glycine, and alanine, as well as diverse sphingolipid species, are implicated in inherited neuro-retinal disorders and are metabolically linked by serine palmitoyltransferase (SPT), a key enzyme in membrane lipid biogenesis. To gain insight into the pathophysiological mechanisms linking these pathways to neuro-retinal diseases we compared patients diagnosed with two metabolically intertwined diseases: macular telangiectasia type II (MacTel), hereditary sensory autonomic neuropathy type 1 (HSAN1), or both.

Methods: We performed targeted metabolomic analyses of amino acids and broad sphingolipids in sera from a cohort of MacTel (205), HSAN1 (25) and Control (151) participants.

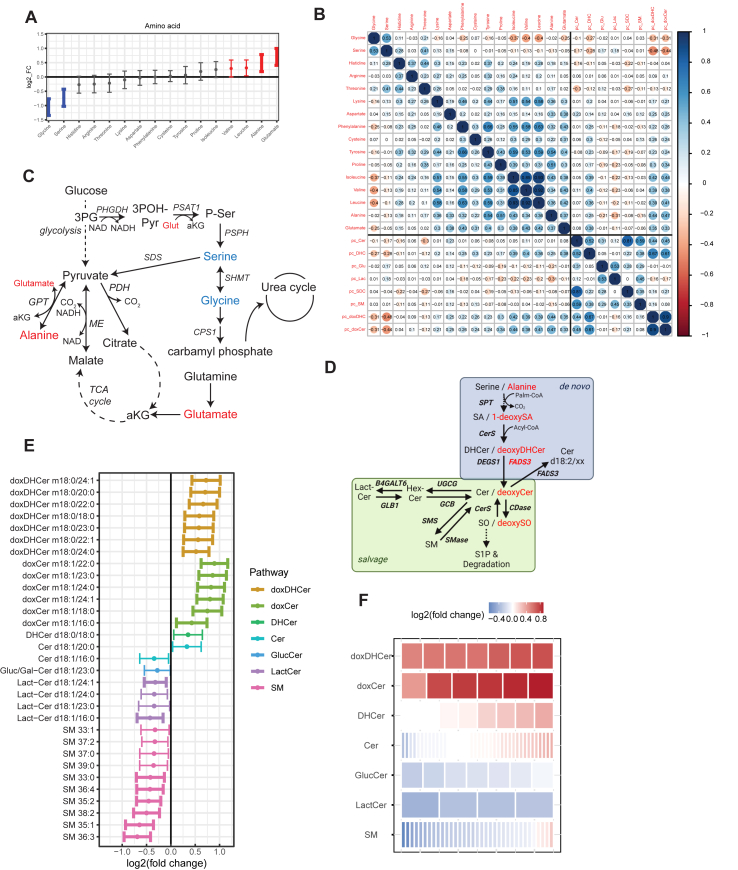
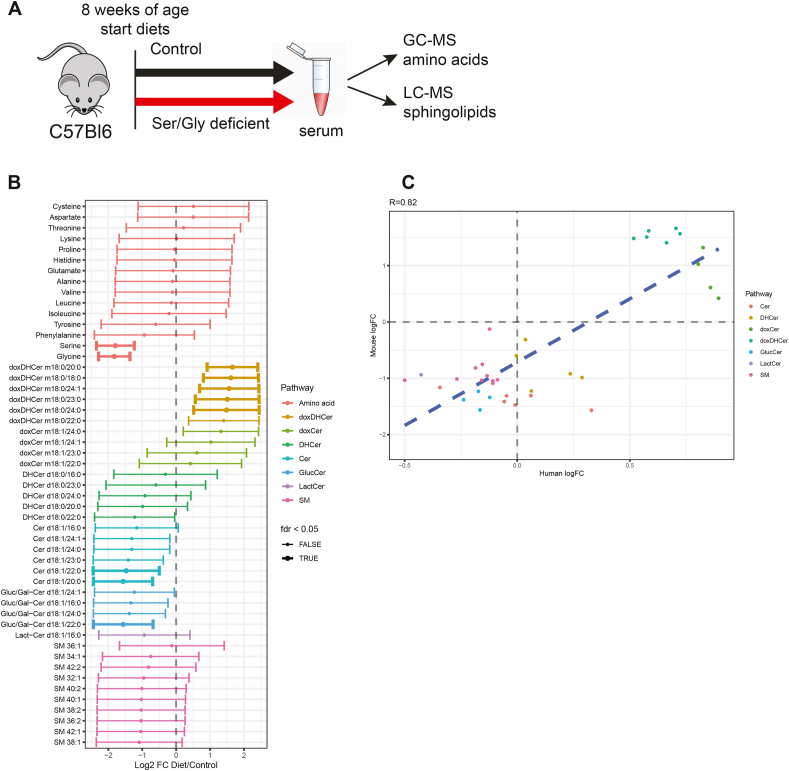
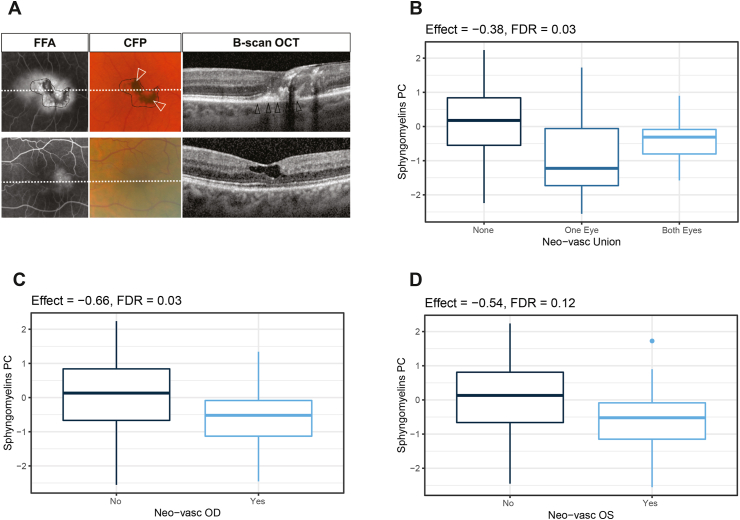
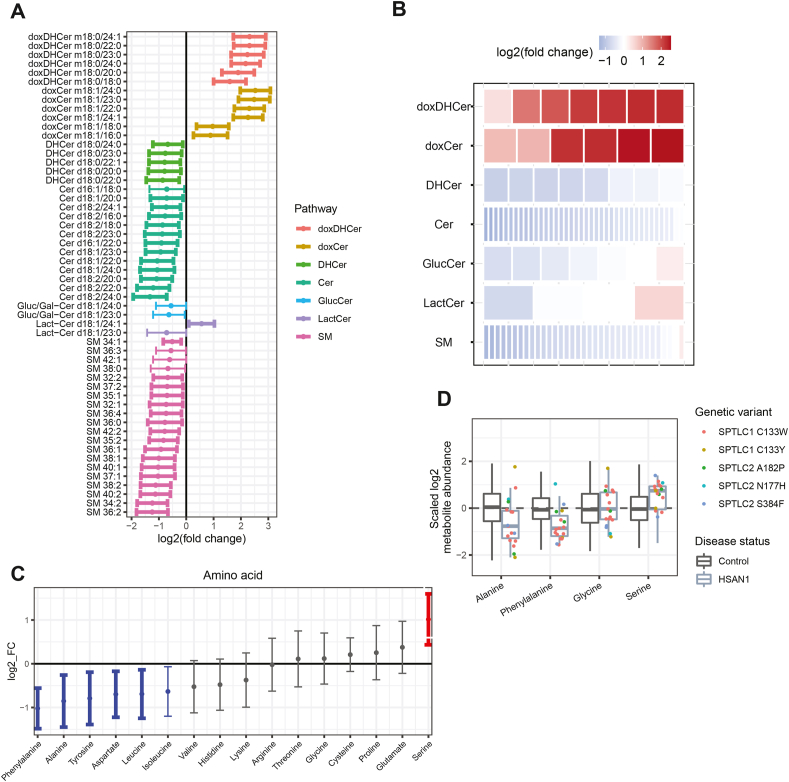
Results: MacTel patients exhibited broad alterations of amino acids, including changes in serine, glycine, alanine, glutamate, and branched-chain amino acids reminiscent of diabetes. MacTel patients had elevated 1-deoxysphingolipids but reduced levels of complex sphingolipids in circulation. A mouse model of retinopathy indicates dietary serine and glycine restriction can drive this depletion in complex sphingolipids. HSAN1 patients exhibited elevated serine, lower alanine, and a reduction in canonical ceramides and sphingomyelins compared to controls. Those patients diagnosed with both HSAN1 and MacTel showed the most significant decrease in circulating sphingomyelins.

Conclusions: These results highlight metabolic distinctions between MacTel and HSAN1, emphasize the importance of membrane lipids in the progression of MacTel, and suggest distinct therapeutic approaches for these two neurodegenerative diseases.

Keywords: Amino acids; HSAN1; Macular telangiectasia; Peripheral neuropathy; Retinopathy; Sphingolipids.


Figures

Figure 1
Figure 1
MacTel patients exhibit altered levels of non-essential amino acids and sphingolipids. (A) Log-fold change of nominally significant metabolites in 16 amino acids in MacTel subjects compared to Controls. Points denote the log-fold change and bars extend to the 95% confidence interval. Bold bars indicate significance after correction for FDR. (B) Correlation table of amino acids and lipids principal components in Controls. Numbers indicate Pearson's correlation coefficient (R). Abbreviations in this panel: Cer, ceramide; DHC, dihydroceramide; Glu, glucosyl-ceramide; Lac, lactosyl-ceramide; SDC, ceramide (d18:2/xx); SM, sphingomyelin; doxDHC, deoxydihydroceramide; doxCer, deoxyceramide. (C) Simplified metabolic map demonstrating the connections between glycolysis, TCA cycle, amino acid metabolism, and the urea cycle. (D) Map of SL metabolism with the de novo and salvage pathways indicated. (E) Change in all measured sphingolipids (SL) between MacTel subjects compared to Controls, grouped by SL class. The tiles in each row represent lipids contained in that class, colored by log fold change in MacTel compared to Controls. The color blue represents depletion and red represents increased abundance. (F) Changes in abundance across SL classes. Each row is composed of tiles representing lipids contained in the group. The color of each tile represents the mean log fold change of that lipid in MacTel patients to Controls. The color blue represents depletion and red represents increased abundance. Abbreviations: doxDHCer, deoxydihydroceramide; doxCer, deoxyceramide; DHCer, dihydroceramide; Cer, ceramide; Gluc/Gal-Cer or GlucCer, glucosyl/galactosyl-ceramide; Lact-Cer, lactosyl-ceramide; SM, sphingomyelin.
Figure 2
Figure 2
Low serine and glycine levels reduce circulating ceramides and complex SL in mice. (A) Log-fold change of all tested metabolites in diet mice subjects compared to control diet mice. Points denote the log-fold change and bars extend to the 95% confidence interval. Bold bars indicate significance after correction for FDR. (B) Correlation plot between human and mice Log-fold change. Pearson correlation coefficient is reported at the top of the figure and the correlation line is displayed in blue. Amino-acids are not contained in this figure as they were artificially altered by design in the mice experiment. Abbreviations: doxDHCer, deoxydihydroceramide; doxCer, deoxyceramide; DHCer, dihydroceramide; Cer, ceramide; Gluc/Gal-Cer or GlucCer, glucosyl/galactosyl-ceramide; Lact-Cer, lactosyl-ceramide; SM, sphingomyelin.
Figure 3
Figure 3
MacTel patients presenting neovascularization have reduced levels of sphingomyelins. (A) Representative left eyes of two MacTel patients with low (top) and high (bottom) sphingomyelin serum levels. Eye with a large subretinal/sub-RPE neovascular membrane (black arrowheads) and pigment accumulation (white arrowheads) (top) and eye with mild parafoveal leakage on fundus fluorescein angiography (FFA) and lack of hyper-reflective changes on OCT (bottom). (B) Association between sphingomyelins principal component score and neovascularization in both eyes (left + right). Center line indicates the median and box boundaries denote the 25th and 75th percentiles. (C) Association between sphingomyelins principal component score and neovascularization in right eyes (OD) only. Center line indicates the median and box boundaries denote the 25th and 75th percentiles. (D) Association between sphingomyelins principal component score and neovascularization in left eyes (OS) only. Center line indicates the median and box boundaries denote the 25th and 75th percentiles.
Figure 4
Figure 4
HSAN1 patients have altered circulating levels of canonical ceramides and amino acids. (A) Representation of all significantly different SL species (p < 0.05) comparing HSAN1 to Controls. Color indicates the lipid class and bold bars indicate significance after correction for FDR. (B) Changes in abundance across SL classes. Each row is composed of tiles representing lipids contained in the group. The color of each tile represents the mean log fold change of that lipid in HSAN1 patients to Controls. The color blue represents depletion and red represents increased abundance. (C) Change in 16 amino acids comparing HSAN1 to Controls. Points indicate mean log fold change and bars extend to the 95% confidence interval of the mean. Red or blue colors indicate nominal significance (p < 0.05), and bold bars indicate significance after correction for FDR. (D) Distribution of alanine, phenylalanine, glycine, and serine levels in HSAN1 subjects (excluding those on serine supplementation) compared to Controls. HSAN1 subject metabolite abundance (points) are colored according to genetic variant. Individual data points for Controls are not shown. Boxplot central line indicates the median and box boundaries denote the 25th and 75th percentiles. Whiskers extend to the most extreme values within 1.5× the interquartile range. Abbreviations: doxDHCer, deoxydihydroceramide; doxCer, deoxyceramide; DHCer, dihydroceramide; Cer, ceramide; Gluc/Gal-Cer or GlucCer, glucosyl/galactosyl-ceramide; Lact-Cer, lactosyl-ceramide; SM, sphingomyelin; SPTLC1 and SPTLC2, serine-palmitoyl transferase long chain subunit 1 or 2.
Figure 5
Figure 5
MacTel patients have distinct SL alterations compared to patients with HSAN1. (A) Volcano plot comparing HSAN1 patients with MacTel, to HSAN1 patients without MacTel. Dashed line represents p = 0.05. Only metabolites below this threshold are labeled and coloured by metabolite class. (B) Depiction of the log2 fold change of 1-deoxysphingolipids in MacTel only, HSAN1 only, and HSAN1 patients with MacTel, compared to Controls. Tiles indicate the mean log fold change in abundance between each cohort and controls. Black points indicate FDR-significant changes. Red colors indicate increased relative abundance, and blue colors indicate decreased abundance. (C) Scaled abundance of averaged dihydroxyceramide levels in Controls, MacTel only, HSAN1 only, and HSAN1 patients with MacTel. Center line indicates the median and box limits indicate the 25th and 75th percentiles. (D) Depiction of the log2 fold change of d18:2 ceramides in MacTel only, HSAN1 only, and HSAN1 patients with MacTel, compared to Controls. Tiles rendered as for panel B. (E) Depiction of the log2 fold change of sphingomyelins in MacTel only, HSAN1 only, and HSAN1 patients with MacTel compared to Controls. Tiles rendered as for panel B. (F) Scaled abundance of averaged sphingomyelin levels in Controls, MacTel only, HSAN1 only, and HSAN1 patients with MacTel. Center line indicates the median and box limits indicate the 25th and 75th percentiles. (G) Summary of the amino acid and SL alterations in MacTel, HSAN1, and HSAN1 patients with MacTel compared to Controls. Red indicates increased, and blue indicates decreased abundance. Abbreviations: doxDHCer, deoxydihydroceramide; doxCer, deoxyceramide; DHCer, dihydroceramide; Cer, ceramide; Gluc/Gal-Cer or GlucCer, glucosyl/galactosyl-ceramide; Lact-Cer, lactosyl-ceramide; SM, sphingomyelin.

References

    1. Handzlik M.K., Gengatharan J.M., Frizzi K.E., McGregor G.H., Martino C., Rahman G., et al. Insulin-regulated serine and lipid metabolism drive peripheral neuropathy. Nature. 2023;614(7946):118–124. - PMC - PubMed
    1. Dunn T.M., Tifft C.J., Proia R.L. A perilous path: the inborn errors of sphingolipid metabolism. J Lipid Res. 2019;60(3):475–483. - PMC - PubMed
    1. Scerri T.S., Quaglieri A., Cai C., Zernant J., Matsunami N., Baird L., et al. Genome-wide analyses identify common variants associated with macular telangiectasia type 2. Nat Genet. 2017;49(4):559–567. - PubMed
    1. Bonelli R., Woods S.M., Ansell B.R.E., Heeren T.F.C., Egan C.A., Khan K.N., et al. Systemic lipid dysregulation is a risk factor for macular neurodegenerative disease. Sci Rep. 2020;10(1):12165. - PMC - PubMed
    1. Gantner M.L., Eade K., Wallace M., Handzlik M.K., Fallon R., Trombley J., et al. Serine and lipid metabolism in macular disease and peripheral neuropathy. N Engl J Med. 2019;381(15):1422–1433. - PMC - PubMed

Publication types