. 2023 Mar 30;6(6):e202201847.
doi: 10.26508/lsa.202201847. Print 2023 Jun.

Bats experience age-related hearing loss (presbycusis)

Affiliations

Bats experience age-related hearing loss (presbycusis)

Yifat Chaya Tarnovsky et al. Life Sci Alliance. .

Abstract

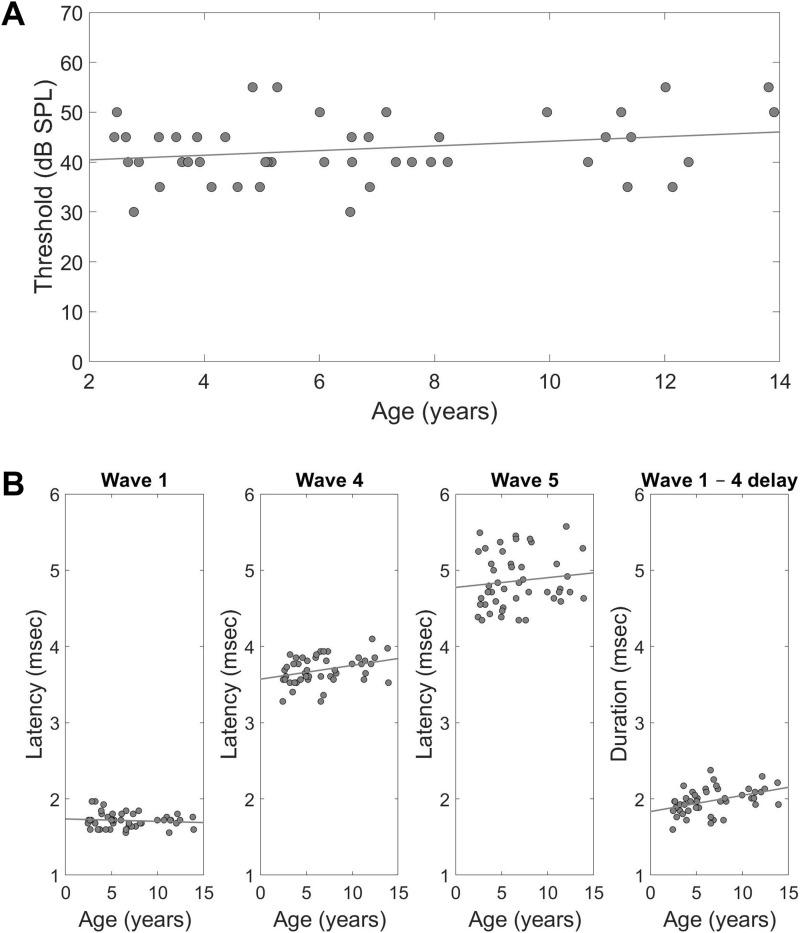
Hearing loss is a hallmark of aging, typically initially affecting the higher frequencies. In echolocating bats, the ability to discern high frequencies is essential. However, nothing is known about age-related hearing loss in bats, and they are often assumed to be immune to it. We tested the hearing of 47 wild Egyptian fruit bats by recording their auditory brainstem response and cochlear microphonics, and we also assessed the cochlear histology in four of these bats. We used the bats' DNA methylation profile to evaluate their age and found that bats exhibit age-related hearing loss, with more prominent deterioration at the higher frequencies. The rate of the deterioration was ∼1 dB per year, comparable to the hearing loss observed in humans. Assessing the noise in the fruit bat roost revealed that these bats are exposed to continuous immense noise-mostly of social vocalizations-supporting the assumption that bats might be partially resistant to loud noise. Thus, in contrast to previous assumptions, our results suggest that bats constitute a model animal for the study of age-related hearing loss.


Conflict of interest statement

The authors declare that they have no conflict of interest.

Figures

Figure 1.
Figure 1.. Bats exhibit age-related hearing loss.
(A) 10-ms averaged response window recorded in response to a 45 dB SPL 30-kHz playback, for example. The average of 512 responses is shown for one bat. The green window (horizontal line) was used for calculating noise SD; the blue horizontal line depicts the search window where the minimum peak of the response was detected; and the red vertical dashed line depicts the absolute peak-to-peak amplitude used to define the hearing threshold. (B) Audiogram for two age groups. Black—eight youngest bats (with age that is smaller than the mean – SD of all ages. Evaluated age of the group is 2.79 ± 0.3 yr). Gray—10 oldest bats (with age that is larger than the mean + SD of all ages. Evaluated age of the group is 11.99 ± 1.12 yr). Threshold differences between the groups are up to ∼10 dB. (C) Averaged ABR waveform to a 0.1-ms click signal played by the speaker in alternating polarity at a suprathreshold intensity of 30 dB sensation level. The average of 512 responses is shown for the same individual. It is commonly accepted that wave I represents the compound response from the auditory nerve (AN), whereas the later waves represent responses from the ascending auditory pathway: the cochlear nucleus (CN), the superior olivary complex (SOC), the nucleus of the lateral lemniscus (NLL), and the inferior colliculus (IC). (D) Audiogram results. Different frequencies are displayed from low to high (6, 12, 18, 24, 30, and 35 kHz). Gray points—individual thresholds as a function of age for each frequency. Each data point represents a single individual, and the gray line shows the linear fit (P = 0.018, 0.099, 0.026, 0.037, 0.003, and 0.009 for the frequencies 6, 12, 18, 24, 30, and 35 kHz, respectively). Blue points show the average threshold in dB SPL for each frequency. Red points—the mean regression slope of the gray line depicting the threshold elevation (in dB per year) for each frequency (n = 46).
Figure 2.
Figure 2.. Bats exhibit an age-related decrease in cochlear microphonics (CM) response.
(A) Top—the averaged EEG response to a 90 dB SPL 0.1-ms click signal played to the right ear via an ∼30-cm ear tube, shown separately for the two opposite polarities (blue: condensation; red: rarefaction). Gray lines show the noise floor (solid: condensation; dashed: rarefaction), collected by playing the signal through a blocked tube. Each response shows the average of 2,000 clicks played to one bat. Bottom—the CM response (green) extracted by subtracting the response to rarefaction from the response to condensation (black), and the noise floor (gray). (B) Effects of age and sex on CM amplitude. Each point represents one individual. Black—age regression line, n = 46.
Figure 3.
Figure 3.. Bats exhibit an age-related decrease in the stria vascularis (SV) area that is correlated with hearing threshold elevation with age.
(A) Hematoxylin and eosin (H&E) staining of the cochlea in four bats. The SV cross-sectional area is depicted in a dashed line. (B) Averaged strial area as a function of age. (C) Hearing threshold at 18 kHz as a function of the averaged strial area.
Figure 4.
Figure 4.. Bats exhibit an age-related deterioration in neuronal processing.
(A) Individual thresholds for the 0.1-ms click signal and the age-dependent linear regression line. (B) From left to right—latencies and age regression lines for waves 1, 4, and 5, and the inter-peak interval between waves 1 and 4 in ms, retrieved from each individual’s 30 dB suprathreshold response to the click signal. Each point represents a single bat, n = 46.
Figure 5.
Figure 5.. Noise exposure and the relation to age-related hearing loss.
(A) Maximum noise levels in a roost with thousands of bats. Top—key frequency of ∼32 kHz. Bottom—key frequency of ∼6 kHz. The microphone was placed at a distance of ∼10 cm from the nearest bat. (B) Inverse correlation was found between the rate of age-related hearing loss and the maximum intensity of conspecific vocalizations (estimated at a distance of 10 cm from a cluster of 13 bats in the laboratory). The line depicts the linear fit.
Figure S1.
Figure S1.. Conspecific noise and the relation to hearing.
Top- Maximum peak-to-peak levels of the conspecific noise recorded in a laboratory colony with 13 Egyptian fruit bats with a calibrated GRAS 40DP 1/8″ microphone (GRAS Sound & Vibration) that was placed 105 cm from the cluster of the bats; the sound levels at 10 cm were estimated based on the physics of sound propagation (see the Materials and Methods section). Middle- Average hearing thresholds. Bottom- age-related hearing loss rate at the equivalent frequencies.
Figure S2.
Figure S2.. Averaged CM amplitude for the open tube mode and for the blocked tube mode (representing the noise), n = 46.
Figure S3.
Figure S3.. Spiral ganglion neurons (left) and the hair cells (right) of an aged bat (11.3 yr).
Both cell types seem intact, however, because of technical difficulties, we could not reliably quantify these cells’ survival.

References

    1. Aging Atlas Consortium (2021) Aging Atlas: A multi-omics database for aging biology. Nucleic Acids Res 49: D825–D830. 10.1093/nar/gkaa894 - DOI - PMC - PubMed
    1. Anderson S, Gordon-Salant S, Dubno JR (2018) Hearing and aging effects on speech understanding: Challenges and solutions. Acoust Today 14: 10–18. 10.1121/at.2018.14.4.12 - DOI
    1. Beck DL, Speidel DP, Petrak M (2007) Auditory steady-state response (ASSR): A beginner’s guide. Hearing Rev 14: 34.
    1. Belknap DB, Suthers RA (1982) Brainstem auditory evoked responses to tone bursts in the echolocating bat, Rousettus. J Comp Physiol 146: 283–289. 10.1007/bf00612699 - DOI
    1. Bocskai T, Németh A, Bogár L, Pytel J (2013) Sedation of children for auditory brainstem response using ketamine-midazolam-atropine combination–a retrospective analysis. Springerplus 2: 178. 10.1186/2193-1801-2-178 - DOI - PMC - PubMed

Publication types

LinkOut - more resources