. 2023 Mar 30;14(1):1790.
doi: 10.1038/s41467-023-37449-1.

The C-terminal tail of polycystin-1 suppresses cystic disease in a mitochondrial enzyme-dependent fashion

Affiliations

The C-terminal tail of polycystin-1 suppresses cystic disease in a mitochondrial enzyme-dependent fashion

Laura Onuchic et al. Nat Commun. .

Abstract

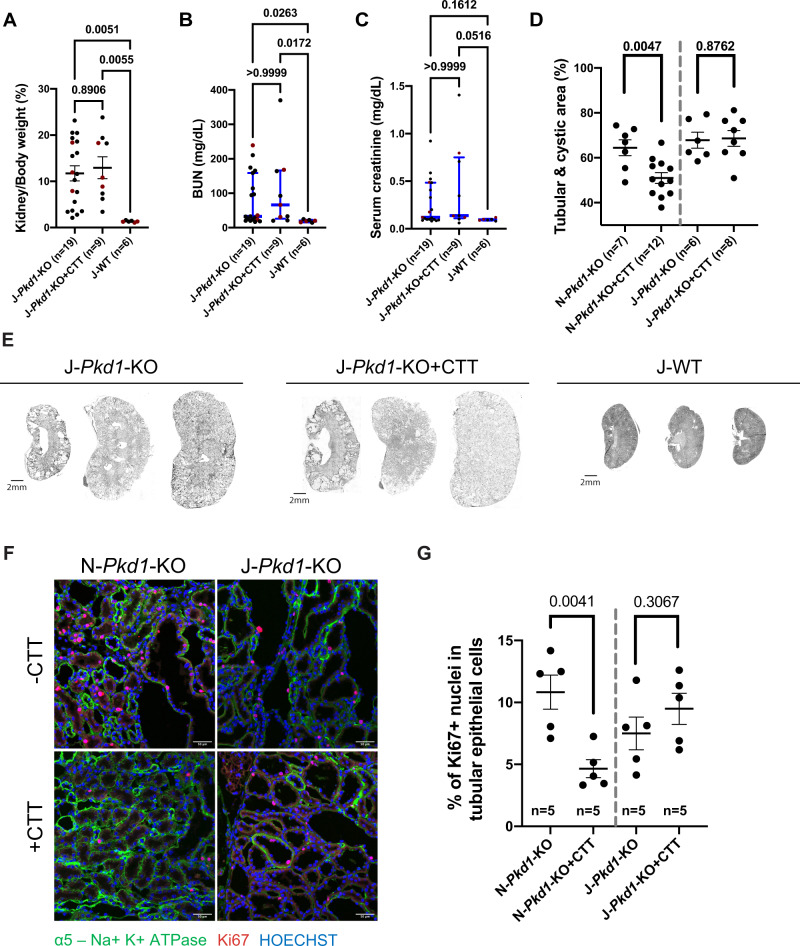
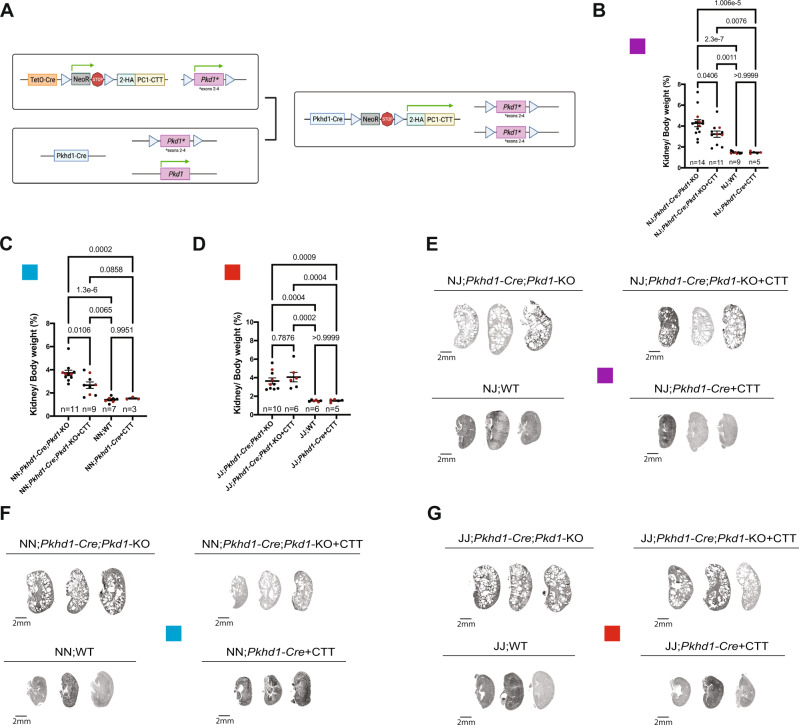
Autosomal dominant polycystic kidney disease (ADPKD) is the most prevalent potentially lethal monogenic disorder. Mutations in the PKD1 gene, which encodes polycystin-1 (PC1), account for approximately 78% of cases. PC1 is a large 462-kDa protein that undergoes cleavage in its N and C-terminal domains. C-terminal cleavage produces fragments that translocate to mitochondria. We show that transgenic expression of a protein corresponding to the final 200 amino acid (aa) residues of PC1 in two Pkd1-KO orthologous murine models of ADPKD suppresses cystic phenotype and preserves renal function. This suppression depends upon an interaction between the C-terminal tail of PC1 and the mitochondrial enzyme Nicotinamide Nucleotide Transhydrogenase (NNT). This interaction modulates tubular/cyst cell proliferation, the metabolic profile, mitochondrial function, and the redox state. Together, these results suggest that a short fragment of PC1 is sufficient to suppress cystic phenotype and open the door to the exploration of gene therapy strategies for ADPKD.


Conflict of interest statement

Some of the findings presented in this manuscript are included in the provisional patent application No 63/250,663 filed by Yale University that includes L.O., V.P. and M.J.C. as authors. The remaining authors declare no other competing interests.

Figures

Fig. 1
Fig. 1. Expression of polycystin-1 C-terminal tail (CTT) suppresses cystic disease in an orthologous mouse model of ADPKD.
A Design of the 2HA-PC1-CTT;Pkd1fl/fl;Pax8rtTA;TetO-Cre (Pkd1-KO + CTT) mouse model. We generated transgenic mice that carry a BAC-2HA-PC1-CTT transgene inserted in the Rosa26 locus and preceded by a neomycin resistance (NeoR) STOP cassette flanked by loxP sequences. These mice were crossed with the previously characterized Pkd1fl/fl;Pax8rtTA;TetO-Cre mouse model of ADPKD in which exons 2–4 of the Pkd1 gene are flanked by loxP sequences,. Cre-mediated recombination of these second-generation 2HA-PC1-CTT;Pkd1fl/fl;Pax8rtTA;TetO-Cre mice via doxycycline induction promotes 2HA-PC1-CTT protein expression and loss of full-length PC1 protein expression in tubular epithelial cells. BD Comparative analysis of N-Pkd1-KO, N-Pkd1-KO + CTT, and N-WT mice showing differences in KW/BW ratio (B), BUN (C), and serum creatinine (D). Cystic mouse cohorts are composed of 53–58% female and 42–47% male mice. Red dots represent the animals depicted in (E). E Representative H&E-stained kidney sections (4×) from 16-week N-Pkd1-KO, N-Pkd1-KO + CTT, and N-WT mice. Each group of sections is representative of the average KW/BW ratio of the entire cohort and is illustrative of the inherent variability associated with this mouse model,. Scale bar: 2 mm. Non-parametric data are depicted with the median and interquartile range (blue bars). Multiple group comparisons were performed using Kruskal–Wallis test followed by Dunn’s multiple-comparisons test. H&E-stained kidney sections from all of the cystic mice included in this cohort are provided in Supplementary Fig. 1. Source data are provided as a Source Data file.
Fig. 2
Fig. 2. 2HA-PC1-CTT (CTT) colocalizes and interacts with mitochondrial enzyme NNT.
A Workflow for identification of protein interactors of mitochondrial-associated pools of PC1 and its fragments. Mitochondria from Pkd1F/H-BAC and WT mice were solubilized, crosslinked (3 mM DTSSP), and immunoprecipitated with anti-HA antibodies. Recovered proteins were identified by mass spectrometry. B Anti-HA immunoprecipitates from mitochondrial fractions were blotted with HRP-conjugated anti-HA, revealing recovery of the CTF of full-length 3FLAG-PC1-3HA as well as PC1-CTT-3HA fragments from Pkd1F/H-BAC but not WT control mice. C Volcano plot of PC1 and PC1-CTT interactors from Pkd1F/H-BAC vs WT kidneys (Colored dots: P < 0.05 determined by two-tailed Fisher’s exact test; n = 3 per group). The amount of NNT co-immunoprecipitating with CTT from Pkd1F/H-BAC kidneys was >16-fold greater than that in WT control immunoprecipitates (P < 10−10). D Anti-NNT immunoprecipitates from kidney lysates were immunoblotted with HRP-conjugated anti-HA, revealing coimmunoprecipitation of the 3FLAG-PC1-3HA CTF as well as PC1-CTT-3HA fragments from Pkd1F/H-BAC but not WT control mice. E Representative immunofluorescence (100×) image showing localization of the 2HA-PC1-CTT construct, identified with an anti-PC1-C-terminus antibody, expressed by transient transfection in HEK293 cells. CTT colocalizes in mitochondria with endogenous NNT (yellow arrows). As previously reported, CTT was also observed in nuclei of a subset of transfected cells (red arrow). Scale bar:10 μm. F The mitochondria-associated fraction of CTT in (E) was assessed through Mander’s colocalization analysis (20 individual cells from 14 independent images, 3 biological replicates), revealing a 0.8535 overlap coefficient, indicating extensive overlap between CTT and NNT distributions. As expected, the TOMM20/NNT colocalization coefficient (measured as an experimental positive control) is slightly but significantly greater. Data are shown as mean ± SEM. Pairwise comparison was performed using two-tailed Student’s t-test. Colocalization of TOMM20 and NNT is shown in Supplementary Fig. 3. G Immunoblotting of total kidney lysates from WT “N” and “J” mice, confirming the presence and absence of NNT, respectively. H Immunoblotting of anti-HA immunoprecipitates from mouse kidney lysates, revealing immunoprecipitation of CTT in both “N” and “J” Pkd1-KO + CTT mice. NNT coimmunoprecipitation is detected exclusively in immunoprecipitates from N-Pkd1-KO + CTT mice. See Supplementary Data 1 for the complete comparative proteomic analysis depicted in (C). Source data are provided as a Source Data file.
Fig. 3
Fig. 3. The interaction between NNT and CTT is critical to the CTT-mediated suppression of cystogenesis and tubular proliferation.
AC Comparative analysis of Pkd1-KO + CTT and Pkd1-KO in the “J” background revealed no significant change in KW/BW ratio (A), BUN (B), and serum creatinine levels (C). Cystic mouse cohorts are composed of 53–55% female and 45–47% male mice. Red dots represent the animals depicted in (E). D Quantification of tubular and cystic area in H&E-stained kidney sections from Pkd1-KO and Pkd1-KO + CTT mice on both “N” and “J” backgrounds, as determined by ImageJ using images of renal cross-sections shown in Supplementary Fig. 1. E Representative H&E-stained kidney sections (4×) from 16-week J-Pkd1-KO, J-Pkd1-KO + CTT, and J-WT mice. Each group of sections is representative of the average KW/BW ratio of the entire cohort and is illustrative of the inherent variability associated with this mouse model,. Scale bar: 2 mm. F Representative immunofluorescence images (20×) showing tubular proliferation in Pkd1-KO and Pkd1-KO + CTT mice on “N” and “J” backgrounds, assessed by Ki67 staining (red). Tubular epithelial cells are identified by positive Na,K-ATPase α-subunit staining (green). Scale bar: 50 μm. G Quantification of tubular proliferation determined by the percentage of Ki67-positive nuclei in renal tubular epithelial cells (n = 9 images per mouse, 5 mice per group). Counting of Ki67 positive nuclei was performed by an individual blinded to the experimental conditions. Parametric data are depicted with the mean ± SEM (black bars). Pairwise comparisons were performed using two-tailed Student’s t-test (D, G). Multiple group comparisons were performed using one-way ANOVA followed by Tukey’s multiple-comparisons test (A). Non-parametric data are depicted with the median and interquartile range (blue bars). Multiple group comparisons were performed using Kruskal-Wallis test followed by Dunn’s multiple-comparisons test (B, C). H&E-stained kidney sections from all of the cystic mice included in this cohort are provided in Supplementary Fig. 1. Source data are provided as a Source Data file.
Fig. 4
Fig. 4. Expression of CTT partially suppresses cystic disease in a rapidly progressive orthologous mouse model of ADPKD when generated on an NNT-competent background.
A Development of the 2HA-PC1-CTT;Pkd1fl/fl;Pkhd1-Cre mouse model. We crossed the 2HA-PC1-CTT;Pkd1fl/fl;Pax8rtTA;TetO-Cre mouse model on the “N” background (N-Pkd1-KO + CTT) with the previously characterized developmental Pkd1fl/fl;Pkhd1-Cre (Pkhd1-Cre;Pkd1-KO)–, ADPKD mouse model, generated on the “J” background. Breeders with a Pkd1fl/+;Pkhd1-Cre genotype were used, due to the constitutive activity of the Pkhd1-Cre that initiates collecting duct-specific Cre-mediated recombination during embryonic stages and prevents animals with the complete Pkd1fl/fl;Pkhd1-Cre from reaching sexual maturity. B Comparative analysis of NJ F1 (purple box) generation mice showing differences in KW/BW ratio. Of note, no phenotype differences were observed in NJ WT mice that do or do not express CTT (NJ;Pkhd1-Cre + CTT and NJ;WT, respectively). Red dots represent the animals depicted in (E). C Comparative analysis of NN F2 (blue box) generation mice showing differences in KW/BW ratio. Of note, no phenotype differences were observed in NN WT mice that do or do not express CTT (NN;Pkhd1-Cre + CTT and NN;WT, respectively). Red dots represent the animals depicted in (F). D Comparative analysis of JJ F2 (red box) generation mice showing differences in KW/BW ratio. Of note, no phenotype differences were observed in JJ WT mice that do or do not express CTT (JJ;Pkhd1-Cre + CTT and JJ;WT, respectively). Red dots represent the animals depicted in (G). EG H&E-stained kidney sections (4×) from p14 NJ F1 (purple box), NN F2 (blue box), and JJ F2 (red box) mice. Each group of sections is representative of the average KW/BW ratio of the entire cohort. Scale bar: 2 mm. Data are depicted with the mean ± SEM. Multiple group comparisons were performed using one-way ANOVA followed by Tukey’s multiple-comparisons test. H&E-stained kidney sections from all of the cystic mice included in these 3 cohorts are provided in Supplementary Fig. 7. Source data are provided as a Source Data file.
Fig. 5
Fig. 5. CTT modulates redox and reduces ADPKD-associated metabolites in 16-week-old cystic mice.
A PCA plot of LC–MS metabolomic data from 16-week-old Pkd1-KO + CTT vs Pkd1-KO mice revealed group separation in the “N” but not “J” background. Marks report different samples (n = 5 or 6 mice/group); location in the plot is determined by relative contributions of metabolite subsets to variance. B Volcano plot showing metabolic profiling of kidney extracts from Pkd1-KO + CTT vs Pkd1-KO mice in the “N” and “J” backgrounds. Vertical lines mark twofold changes; horizontal lines mark P < 0.05 (two-tailed Student’s t-test). Colored dots indicate metabolites with significant fold changes. Metabolite identification and labeling is provided in Supplementary Fig. 8a, b. N = 5 (N-Pkd1-KO) and n = 6 mice for N-Pkd1-KO + CTT, J-Pkd1-KO and J-Pkd1-KO + CTT groups. Animals used in these studies were representative of cohort phenotypes shown in Figs. 1B–D and 3A–C (Supplementary Fig. 8c). Complete untargeted comparative metabolomic analysis is provided in Supplementary Data 2. C Schematic depicting NNT in the inner mitochondrial membrane, using the mitochondrial proton gradient to catalyze hydride transfer between NADH and NADP+ (forward enzymatic activity). DE LC–MS detection of NAD(P)(H), showing significant differences in NADH/NAD+ (D) and NADPH/NADP+ (E) ratios between 16-week-old Pkd1-KO + CTT and Pkd1-KO mice exclusively in the “N” background. Data are normalized to mean values in N-Pkd1-KO mice and depicted with the median and interquartile range (blue bars). Pairwise comparisons were performed using two-tailed Mann-Whitney U test. F, G “Mitococktail” antibody immunoblots of N-Pkd1-KO + CTT and N-Pkd1-KO kidney lysates, reporting assembly status of mitochondrial complexes I, II, III, IV, and V. Blots were also probed with anti-TOMM20, anti-NNT and anti-actin (as loading control) (F). *St: rat heart mitochondrial extract, indicating positions of complexes I, II, III, IV, and V. Band densities were normalized to protein (actin) or mitochondrial content (TOMM20). Normalized band intensities within the same membrane are shown in graphs depicting the significant differences observed; n = 5/group (G). Additional mitochondrial mass and complex assembly assessments are in Supplementary Fig. 9. Data are depicted as mean ± SEM. Pairwise comparisons were performed using two-tailed Student’s t-test. H Immunoblot depicting NNT levels in ADPKD and non-cystic human patient renal tissue. Source data are provided as a Source Data file.
Fig. 6
Fig. 6. CTT expression in pre-cystic mice reveals pronounced CTT-dependent redox modulation and distinct changes in metabolic profile.
A Schematic representation of the experimental timeline for assessment of untargeted comparative metabolomics in pre-cystic mice at 10 weeks of age. B Comparative analysis between pre-cystic N-Pkd1-KO ± CTT revealed no statistically significant change in KW/BW ratio. Cystic mouse cohorts are composed of 50–60% female and 40–50% male mice. CD Kidney function is preserved in 10-week-old N-Pkd1-KO and N-Pkd1-KO + CTT mice, as revealed by normal and comparable values of serum creatinine (C) and BUN (D) in both groups. E PCA plot of LC–MS-based metabolomic data from 10-week-old N-Pkd1-KO + CTT vs N-Pkd1-KO. Each individual mark corresponds to a different sample (n = 5 or 6 mice per group as shown in figure) and its location in the plot is determined by the relative contributions of subsets of metabolites to the variance among samples. F Volcano plot showing differences in metabolic profiling of the kidney extracts from 10-week-old N-Pkd1-KO ± CTT mice. The vertical lines in each panel mark twofold changes; horizontal lines mark P < 0.05 determined by Student’s t-test; n = 5 mice for N-Pkd1-KO + CTT and n = 6 mice for N-Pkd1-KO mice. The labeled colored dots indicate specific metabolites with significant fold changes. Complete untargeted comparative metabolomic analysis is provided in Supplementary Data 3. GH LC–MS detection of NAD(P)(H) cofactors showing a ~5-fold change in NADH/NAD+ (G) and a ~6-fold change in NADPH/NADP+ (H) ratios in 10-week N-Pkd1-KO ± CTT mice. Data are normalized to mean values observed in N- Pkd1-KO mice. Data are depicted with the mean ± SEM. Pairwise comparisons were performed using two-tailed Student’s t-test. Source data are provided as a Source Data file.
Fig. 7
Fig. 7. CTT increases NNT activity in pre-cystic kidney tissue and cultured cells.
AB Kidney function is normal in all 10-week cohorts (N-Pkd1-KO, N-Pkd1-KO + CTT, and N-WT) used to assess NNT enzymatic activity, as revealed by BUN (A) and serum creatinine levels (B). Pre-cystic cohorts are composed of 45–50% female and 50–55% male mice. Data are depicted as means ± SEM. Multiple group comparisons were performed using one-way ANOVA followed by Tukey’s multiple-comparisons test. C, D Immunoblot of mitochondrial extracts from N-Pkd1-KO, N-Pkd1-KO + CTT, and N-WT kidneys (C). *St: rat heart mitochondrial extract; VDAC served as mitochondrial loading control. NNT expression (normalized to VDAC) was not significantly different across all groups of 10-week-old mice (D). Data are depicted as mean ± SEM. Multiple group comparisons were performed using one-way ANOVA followed by Tukey’s multiple-comparisons test. E NNT activity in mitochondria prepared from N-Pkd1-KO, N-Pkd1-KO + CTT, and N-WT kidneys, quantified by measuring rate of reduction of the NAD analog APAD. Samples were normalized to protein content. WT “J” mice served as negative controls, and confirmed the specificity of the assay by showing the expected absence of an upward slope. F Comparison of NNT activity among N-Pkd1-KO, N-Pkd1-KO + CTT, and N-WT mice, measured as ΔOD/s/mg of protein. Data are depicted with the mean ± SEM. Multiple group comparisons were performed using one-way ANOVA followed by Tukey’s multiple-comparisons test. G Sequence of human PC1-CTT, highlighting the overlapping nuclear localization (aa 4134–4154, red letters) and mitochondrial-targeting sequences (aa 4129–4154, red letters and yellow highlight). H HRP-conjugated anti-HA immunoblotting of lysates from transfected Pkd1−/− cells revealing expression of both 2HA-PC1-CTT and 2HA-PC1-CTT∆4134-4154. I NNT activity detected in mitochondrial extracts from Pkd1−/− cells transfected with 2HA-PC1-CTT (CTT), 2HA-PC1-CTT∆4134–4154 (CTT∆4134–4154) or empty pcDNA3.1 vector (EV). Absence of APAD reduction when NADPH is omitted from assay medium (-NADPH) confirms assay specificity. J Comparison of NNT activity among Pkd1−/− + EV, Pkd1−/− + CTT, and Pkd1−/− + CTTΔ4134–4154 mitochondrial extracts, measured as ΔOD/s/µg of protein and normalized to Pkd1−/− + CTT mean values. Data are depicted with the mean ± SEM. Multiple group comparisons were performed using one-way ANOVA followed by Dunnet’s multiple-comparisons test, with Pkd1−/− + CTT serving as the reference group. Characterization of Pkd1 cells is shown in Supplementary Fig. 10a. Source data are provided as a Source Data file.
Fig. 8
Fig. 8. Schematic representation and identification of PC1 cleavage sites and cleavage products.
The N-terminal domain of PC1 undergoes autocatalytic cleavage at the G protein-coupled receptor Proteolytic Site (GPS), generating a large 3048-aa N-terminal fragment (NTF) that remains non-covalently attached to the 1254-aa C-terminal fragment (CTF). PC1 undergoes further cleavage at the C-terminal domain, giving rise to PC1 CTF fragments, comprised of transmembrane domains and the cytoplasmic PC1 C-terminal tail. An ~100-kDa transmembrane CTF localizes to the endoplasmic reticulum. Cleavage may occur within the C-terminal tail, generating PC1-CTT fragments ranging from 17 to 34-kDa that translocate to the nucleus and to mitochondria. In the current study, we show that the 200 aa PC1-CTT can interact and increase the enzymatic activity of NNT in mitochondria, which produces a physiologically significant impact on mitochondrial redox, metabolism, and cystogenesis.

References

    1. Lanktree MB, et al. Prevalence estimates of polycystic kidney and liver disease by population sequencing. J. Am. Soc. Nephrol. 2018;29:2593–2600. doi: 10.1681/ASN.2018050493. - DOI - PMC - PubMed
    1. Cornec-Le Gall E, Alam A, Perrone RD. Autosomal dominant polycystic kidney disease. Lancet. 2019;393:919–935. doi: 10.1016/S0140-6736(18)32782-X. - DOI - PubMed
    1. The polycystic kidney disease 1 gene encodes a 14 kb transcript and lies within a duplicated region on chromosome 16. The European Polycystic Kidney Disease Consortium. Cell78, 725 (1994). - PubMed
    1. Padovano V, Podrini C, Boletta A, Caplan MJ. Metabolism and mitochondria in polycystic kidney disease research and therapy. Nat. Rev. Nephrol. 2018;14:678–687. doi: 10.1038/s41581-018-0051-1. - DOI - PubMed
    1. Rowe I, et al. Defective glucose metabolism in polycystic kidney disease identifies a new therapeutic strategy. Nat. Med. 2013;19:488–493. doi: 10.1038/nm.3092. - DOI - PMC - PubMed

Publication types

MeSH terms

Substances