. 2023 Mar 30;14(1):1772.
doi: 10.1038/s41467-023-37368-1.

Post-acute sequelae of COVID-19 is characterized by diminished peripheral CD8+β7 integrin+ T cells and anti-SARS-CoV-2 IgA response

Affiliations

Post-acute sequelae of COVID-19 is characterized by diminished peripheral CD8+β7 integrin+ T cells and anti-SARS-CoV-2 IgA response

André Santa Cruz et al. Nat Commun. .

Abstract

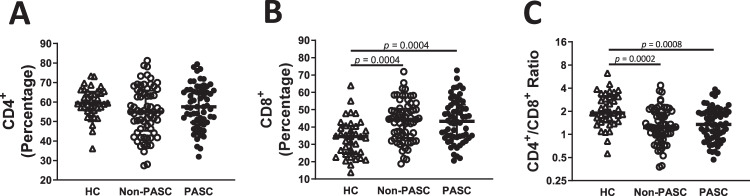
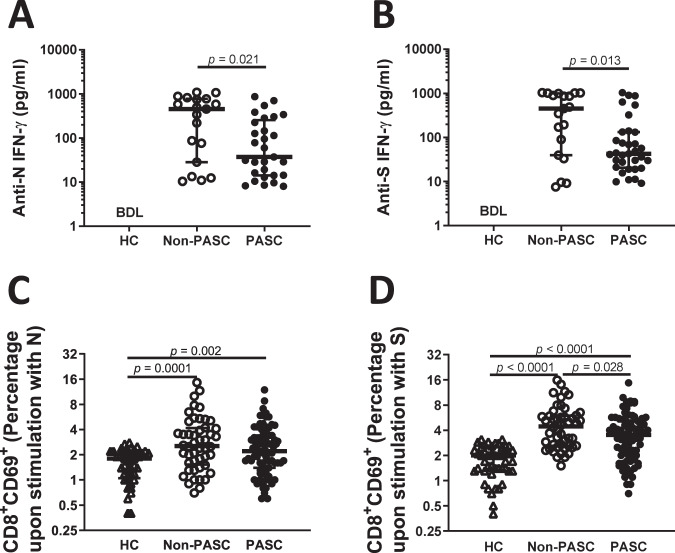
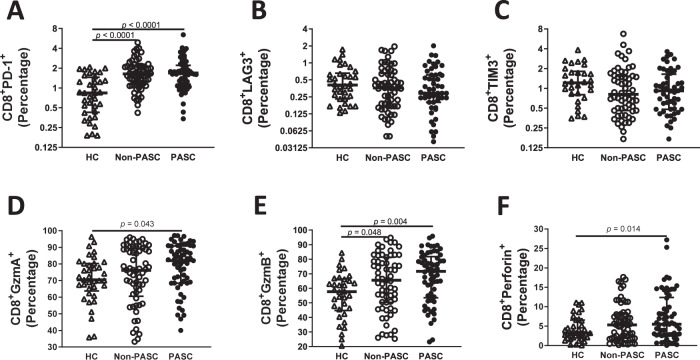
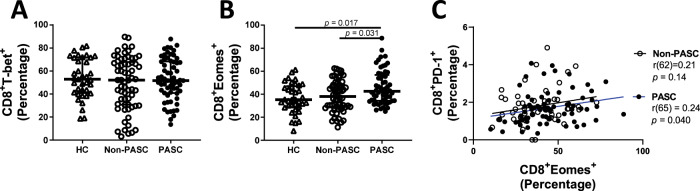
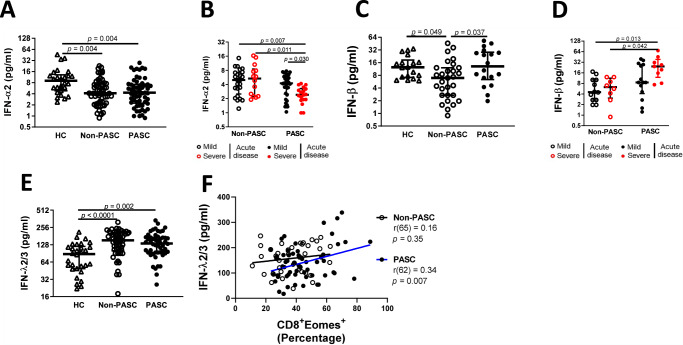
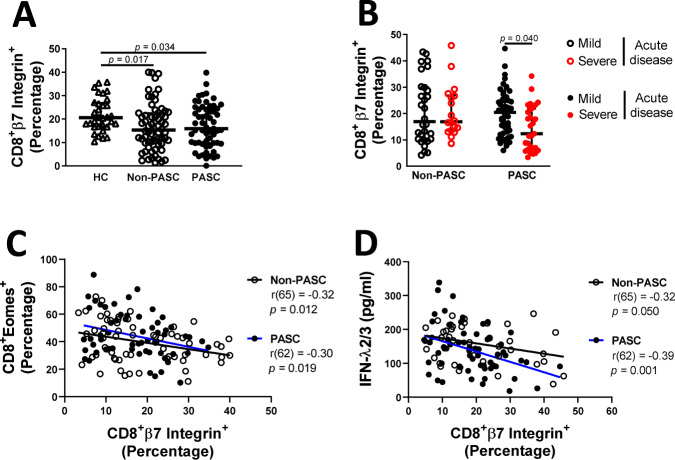
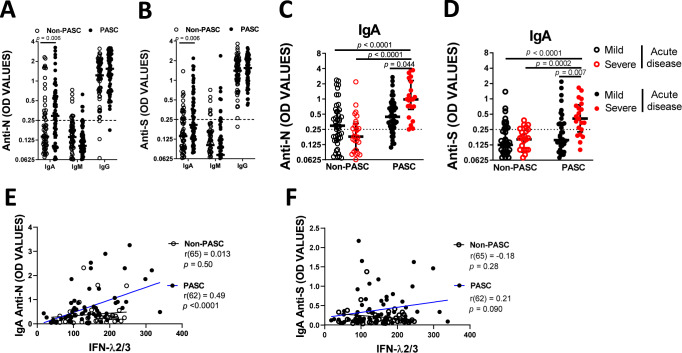
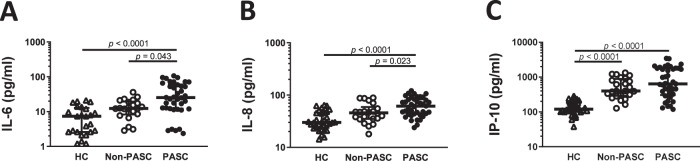
Several millions of individuals are estimated to develop post-acute sequelae SARS-CoV-2 condition (PASC) that persists for months after infection. Here we evaluate the immune response in convalescent individuals with PASC compared to convalescent asymptomatic and uninfected participants, six months following their COVID-19 diagnosis. Both convalescent asymptomatic and PASC cases are characterised by higher CD8+ T cell percentages, however, the proportion of blood CD8+ T cells expressing the mucosal homing receptor β7 is low in PASC patients. CD8 T cells show increased expression of PD-1, perforin and granzyme B in PASC, and the plasma levels of type I and type III (mucosal) interferons are elevated. The humoral response is characterized by higher levels of IgA against the N and S viral proteins, particularly in those individuals who had severe acute disease. Our results also show that consistently elevated levels of IL-6, IL-8/CXCL8 and IP-10/CXCL10 during acute disease increase the risk to develop PASC. In summary, our study indicates that PASC is defined by persisting immunological dysfunction as late as six months following SARS-CoV-2 infection, including alterations in mucosal immune parameters, redistribution of mucosal CD8+β7Integrin+ T cells and IgA, indicative of potential viral persistence and mucosal involvement in the etiopathology of PASC.


Conflict of interest statement

The authors declare no competing interests.

Figures

Fig. 1
Fig. 1. Increasing levels of CD8+ T lymphocytes on convalescent COVID-19 patients.
Percentages of the CD4+ (A) and CD8+ (B) T lymphocytes populations based on gating strategy on Fig S1 (B) on healthy controls (HC; n = 37), non-presenting Post COVID-19 condition (non-PASC; n = 65) and presenting Post-COVID-19 condition (PASC; n = 62) individuals. CD4+/CD8+ ratio on HC, non-PASC and PASC individuals (C). Data are shown in a scatter dot plot format as median ± IQR; Kruskal–Wallis test was applied to identify statistical differences followed by Dunn’s multiple comparisons test.
Fig. 2
Fig. 2. Deficient memory response of CD8+ T cells of convalescent PASC patients.
Peripheral blood mononuclear cells from non-PASC (n = 65) and PASC (n = 62) individuals were stimulated with N or S viral peptides. Interferon-gamma was quantified by ELISA upon stimulation with N (A) and S (B) peptides for 24 h. All HC were tested, behaving below the detection limit of the technique. A Mann Whitney test was employed to compare the non-PASC and PASC groups. The surface expression of the early activation marker CD69 was evaluated upon 24 hours of stimulation with N (C) and S (D) peptides on CD8+ cells by flow cytometry. Data are shown in a scatter dot plot format as median ± IQR; Kruskal–Wallis test was applied to identify statistical differences followed by Dunn’s multiple comparisons test.
Fig. 3
Fig. 3. Higher CD8+ T cell immune activation during SARS-CoV-2 infection on convalescents that developed Post COVID-19 condition.
(A) Percentages of the CD8+ T lymphocytes expressing PD-1 (A), LAG3 (B), TIM3 (C), granzyme A (D), granzyme B (E) and perforin (F) on PBMC of HC (n = 37), non-PASC (n = 65) and PASC (n = 62). Data are shown in a scatter dot plot format as median ± IQR; Kruskal–Wallis test was applied to identify statistical differences followed by Dunn’s multiple comparisons test.
Fig. 4
Fig. 4. Increased levels of EOMES in CD8+ T cells of convalescent PASC patients.
Percentages of Tbet+ (A), EOMES+ (B) CD8+ T lymphocytes on PBMC of HC (n = 37), non-PASC (n = 65) and PASC (n = 62) individuals. Kruskal–Wallis test was applied to identify statistical differences followed by Dunn’s multiple comparisons test. Spearman’s correlation between the percentage of CD8+PD-1+ and CD8+Eomes+ T lymphocytes for non-PASC and PASC individuals (C). Data are shown in a scatter dot plot format as median ± IQR.
Fig. 5
Fig. 5. Higher IFN-beta and IFN-lambda levels are associated with PASC.
The plasma levels of IFN-α2 (A), IFN-β (C) and IFN-λ2/3 (E) of HC (n = 37), non-PASC (n = 65) and PASC (n = 62) individuals and sub-divided by mild or severe acute disease (B and D for IFN-α2 and IFN-β, respectively). Spearman’s correlation between the percentage of IFN-λ2/3 and CD8+EOMES+ for non-PASC and PASC individuals (F). Data are shown in a scatter dot plot format as median ± IQR. Kruskal–Wallis test was applied to figures A, C and E to identify statistical differences followed by Dunn’s multiple comparisons test. A two-way ANOVA was used in figures B and D.
Fig. 6
Fig. 6. Decreased levels of Integrin+ CD8+ T cells of convalescent individuals.
Percentages of β7integrin+ CD8 + T lymphocytes on PBMC of healthy controls (n = 37), non-PASC (n = 65) and PASC (n = 62) individuals (A) and sub-divided by mild or severe acute disease (B). Spearman’s correlation between the percentage of CD8+β7integrin+ and CD8+ EOMES+ T lymphocytes for non-PASC and PASC individuals (C) and IFN-λ2/3 (D). Data are shown in a scatter dot plot format as median ± IQR; Kruskal–Wallis test followed by Dunn’s multiple comparisons test and a two-way ANOVA were applied, respectively, to figures A and B.
Fig. 7
Fig. 7. Type III interferon and IgA signatures on Post COVID-19 condition.
Quantification of the anti-N (A) and anti-S (B) IgA, IgM and IgG response after SARS-CoV-2 infection divided by individuals that developed (n = 62) or not PASC (n = 65) six months after acute disease. Quantification of anti-N (C) and anti-S IgA (D) at six months after SARS-CoV-2 infection on non-PASC (n = 65) and PASC (n = 62) individuals divided by the severity of acute disease. Spearman’s correlation between the percentage of Anti-N IgA (E) or anti-S IgA (F) and IFN-λ2/3 for non-PASC and PASC individuals. Data are shown in a scatter dot plot format as median ± IQR; Mann Whitney test and a two-way ANOVA were applied, respectively, to figures A, B and C, D.
Fig. 8
Fig. 8. Post-COVID-19 condition associates with a higher inflammatory signature during acute disease.
The levels of IL-6 (A), IL-8 (B) and IP-10 (C) were quantified on the plasma of HC (n = 37) and SARS-CoV2 infected patients that develop (PASC, n = 36) or do not develop (Non-PASC, n = 37) post COVID-19 condition. Data are shown in a scatter dot plot format as median ± IQR; Kruskal–Wallis test was applied to identify statistical differences followed by Dunn’s multiple comparisons test.

References

    1. Carfì A, Bernabei R, Landi F. Persistent Symptoms in Patients After Acute COVID-19. JAMA. 2020;324:603. doi: 10.1001/jama.2020.12603. - DOI - PMC - PubMed
    1. Akbarialiabad H, et al. Long COVID, a comprehensive systematic scoping review. Infection. 2021;49:1163–1186. doi: 10.1007/s15010-021-01666-x. - DOI - PMC - PubMed
    1. Moldofsky H, Patcai J. Chronic widespread musculoskeletal pain, fatigue, depression and disordered sleep in chronic post-SARS syndrome; a case-controlled study. BMC Neurol. 2011;11:37. doi: 10.1186/1471-2377-11-37. - DOI - PMC - PubMed
    1. Lee SH, et al. Depression as a mediator of chronic fatigue and post-traumatic stress symptoms in middle east respiratory syndrome survivors. Psychiatry Investig. 2019;16:59–64. doi: 10.30773/pi.2018.10.22.3. - DOI - PMC - PubMed
    1. Nalbandian A, et al. Post-acute COVID-19 syndrome. Nat. Med. 2021;27:601–615. doi: 10.1038/s41591-021-01283-z. - DOI - PMC - PubMed

Publication types

Grants and funding