. 2023 Mar 30;14(1):1770.
doi: 10.1038/s41467-023-37191-8.

A Vaccinia-based system for directed evolution of GPCRs in mammalian cells

Affiliations

A Vaccinia-based system for directed evolution of GPCRs in mammalian cells

Christoph Klenk et al. Nat Commun. .

Abstract

Directed evolution in bacterial or yeast display systems has been successfully used to improve stability and expression of G protein-coupled receptors for structural and biophysical studies. Yet, several receptors cannot be tackled in microbial systems due to their complex molecular composition or unfavorable ligand properties. Here, we report an approach to evolve G protein-coupled receptors in mammalian cells. To achieve clonality and uniform expression, we develop a viral transduction system based on Vaccinia virus. By rational design of synthetic DNA libraries, we first evolve neurotensin receptor 1 for high stability and expression. Second, we demonstrate that receptors with complex molecular architectures and large ligands, such as the parathyroid hormone 1 receptor, can be readily evolved. Importantly, functional receptor properties can now be evolved in the presence of the mammalian signaling environment, resulting in receptor variants exhibiting increased allosteric coupling between the ligand binding site and the G protein interface. Our approach thus provides insights into the intricate molecular interplay required for GPCR activation.


Conflict of interest statement

M.S., S.S., L.M., E.G., M.Z. and E.S.S. are employees of Vaccinex, Inc. and own stock and/or stock options in the company. R.S. is an employee of MorphoSys AG and declares that no competing interests exist. The remaining authors declare no competing interests.

Figures

Fig. 1
Fig. 1. Creating a directed evolution system for GPCRs in mammalian cells.
a Comparison of GPCR expression in plasmid-transfected and Vaccinia-transduced mammalian cells. Transiently transfected CHO cells (upper right panel), A431 cells infected with Vaccinia virus constructs (lower right panel). Negative control (gray shaded), NTR1 (black line), NTR1-TM86V (red line) and NTR1-L5X (blue line) are shown. b Workflow for directed evolution in mammalian cells using Vaccinia virus. After synthesis of the GPCR DNA library, a Vaccinia virus library is created by Trimolecular Recombination (left inset; yellow, regions homologous to the virus for recombination; blue, gene of interest). For this purpose, the randomized GPCR DNA library is first cloned into a Vaccinia virus transfer plasmid. The GPCR gene is then recombined with digested Vaccinia virus DNA, and infectious viral particles are packaged using a fowlpox helper virus. The virus library is used to infect A-431 cells overnight at a multiplicity of infection of one virus per cell, covering the library diversity at a redundancy of 5–10. As the plasma membrane in mammalian cells is readily accessible from the extracellular space (ECS), expressed receptors can be directly labeled with a fluorescent ligand of choice. Cells that have higher receptor density will exhibit higher ligand binding and therefore higher fluorescence, which are then sorted by fluorescence-activated cell sorting (FACS). After sorting, the cells are lysed mechanically to release the virus, which is then amplified on fresh feeder cells. The sorted virus pool can then be used to infect for subsequent rounds of selection.
Fig. 2
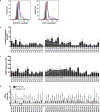
Fig. 2. Evolution of NTR1 in mammalian cells yields receptor variants with improved biophysical properties.
a Sorting gates for improved NTR1 variants (left panel). The sorting gate for top 0.5% fluorescent cells is indicated as a red outline. Histogram comparing first and second sort populations post-amplification as compared to wild-type (right panel): sort 1 (red line), sort 2 (blue line), NTR1 (black line), negative control (dark gray shaded). b Expression analysis of 25 evolved NTR1 variants. Receptor expression was assessed in HEK293T cells by flow cytometry analysis with saturating concentrations of HL488-NT(8–13). Expression levels are relative to wild-type receptor expression and are given as mean values ± s.e.m. of 2 independent experiments. c Ligand affinities of 25 evolved NTR1 variants. IC50 values were derived from whole-cell ligand competition-binding experiments with NT(8–13). Bars represent the mean change ± s.e.m. in calculated affinity (∆pIC50) for each mutant, compared with wild-type receptor from 3 independent experiments each performed in technical duplicates (Supplementary Table 1). d Correlation between receptor expression and thermostability. Thermostability of seven NTR1 variants was assessed in cell membrane fractions and is plotted as change in melting temperature (∆Tm), measured by ligand binding, from wild-type receptor against expression levels from (b). Data represent mean values ± s.e.m. of 2–3 independent experiments performed in duplicates (Supplementary Table 1). Source data are provided as a Source Data file.
Fig. 3
Fig. 3. Evolution of PTH1R in mammalian cells yields signaling-active receptor variants with increased ligand affinity.
a Comparison of the populations after selection with PTH’(1–34)-HL647 (left panel) or M-PTH(1–14)-HL647 (right panel) to wild-type PTH1R: sort 1 (red line), sort 2 (blue line), sort 3a (black line), sort 3b (green line, repetition of 3a), negative control (dark gray shaded). b Expression analysis of 43 evolved PTH1R variants assessed in live HEK293T cells by flow cytometry analysis with saturating concentrations of PTH’(1–34)-HL647. Expression levels are relative to wild-type receptor expression and are given as mean values ± s.e.m. of 2–3 independent experiments (Supplementary Table 3). c cAMP accumulation of 43 evolved PTH1R variants after stimulation with 1 µM PTH(1–34). Data represent maximal cAMP concentrations relative to PTH1R. Bars represent mean values ± s.e.m. of 3–6 independent experiments performed in duplicates (Supplementary Table 4). d Ligand affinities of of 43 evolved PTH1R variants in comparison to PTH1R. IC50 values were derived from whole-cell ligand competition-binding experiments with M-PTH(1–14) or PTH(1–34). Bars represent the mean change ± s.e.m. in calculated affinity (∆pIC50) for each mutant compared with wild-type receptor from 2–8 independent experiments performed in duplicates (Supplementary Table 3). bd Ligands used for selection are indicated below the bar plots. Source data are provided as a Source Data file.
Fig. 4
Fig. 4. Evolved PTH1R variants more easily adopt the active state.
a Evolved PTH1R variants exhibit high-affinity agonist binding but equal or reduced affinity for partial or inverse agonists in cells. Competition ligand binding curves of full [M-PTH(1–14) and PTH(1–34)], partial [PTH(3–34)] and inverse agonist [IA-PTH(7–34)], measured in whole cells expressing wild-type PTH1R or 5 evolved variants. b High agonist affinity of evolved PTH1R variants is similar to that of wild-type PTH1R in the G protein-bound state. Ligand binding curves of M-PTH(1–14) to evolved PTH1Rs were measured in membrane fractions, obtained from cells expressing PTH1R wild-type or 5 evolved variants, in the absence (left panel) or presence (middle panel) of 12.5 µM mini-Gs. Relative binding constants obtained by competition of M-PTH(1–14) binding with labeled M-PTH(1–14), measured in whole cells (from a) vs. membrane fractions in the absence or presence of 12.5 µM mini-Gs (right panel). Positive values thus reflect stronger binding on membrane fractions than on cells. c Increased agonist affinity is G protein-dependent. Binding of 40 nM M-PTH(1–14) was measured in membrane fractions supplemented with increasing concentrations of mini-Gs. Data are relative to binding levels of PTH1R in the absence of mini-Gs (gray area). Left panel: Variants showing an increased basal and G protein-dependent increase in ligand binding. EC50 values are indicated as dotted vertical lines (PTH1R: 1.39 ± 0.2 µM, P34_05: 0.28 ± 0.06 µM, P34_13: 0.38 ± 0.1 µM). Right panel: Variants showing an increase in ligand binding independent of G protein. d G protein-independent increase in ligand binding is due to higher basal activity. cAMP levels were measured 30 min after addition of the phosphodiesterase inhibitor IBMX to cells expressing PTH1R variants and were normalized to receptor expression levels. Data represent mean values ± s.e.m. of 3 experiments performed in duplicates. **p = 0.0044, ****p < 0.0001. Statistical significance was determined by one-way ANOVA and Bonferroni multi-comparison. Source data are provided as a Source Data file.
Fig. 5
Fig. 5. Modulation of biophysical and allosteric properties of GPCRs by directed evolution in mammalian cells.
GPCRs sample a multitude of conformational states that are allosterically modulated by ligand and G protein binding. Introduction of an uncoupling mutation (red star) leads to disruption of the signal transmission from the ligand binding pocket to the G protein interface (left path). Thus, in subsequent directed evolution in the absence of G protein or when its binding was prevented by a mutation already stabilizing the inactive state, preferentially mutations that further stabilize the receptor in an inactive state (grey) were selected, leading to a rigid and stable conformation. If receptor function is retained at the beginning of selection, the cellular environment, which contains G proteins, dictates the selection outcome. Mutations promoting allosteric coupling between the agonist-occupied conformation of the ligand binding pocket and the active-state (AS) conformation of the G protein binding interface (blue) were selected. In some cases, mutations were enriched that promote a strong allosteric coupling of the active-state conformation, resulting in constitutive receptor activity (green). Figure modified after Nygaard et al..

References

    1. Hauser AS, et al. Pharmacogenomics of GPCR drug targets. Cell. 2018;172:41–54.e19. doi: 10.1016/j.cell.2017.11.033. - DOI - PMC - PubMed
    1. Kobilka BK, Deupi X. Conformational complexity of G-protein-coupled receptors. Trends Pharmacol. Sci. 2007;28:397–406. doi: 10.1016/j.tips.2007.06.003. - DOI - PubMed
    1. Gilman AG. G proteins: transducers of receptor-generated signals. Annu Rev. Biochem. 1987;56:615–649. doi: 10.1146/annurev.bi.56.070187.003151. - DOI - PubMed
    1. Oldham WM, Hamm HE. Heterotrimeric G protein activation by G-protein-coupled receptors. Nat. Rev. Mol. Cell. Biol. 2008;9:60–71. doi: 10.1038/nrm2299. - DOI - PubMed
    1. Sarkar CA, et al. Directed evolution of a G protein-coupled receptor for expression, stability, and binding selectivity. Proc. Natl. Acad. Sci. U.S.A. 2008;105:14808–14813. doi: 10.1073/pnas.0803103105. - DOI - PMC - PubMed

Publication types