. 2023 Mar 30;14(1):1775.
doi: 10.1038/s41467-023-37327-w.

Cryo-tomography reveals rigid-body motion and organization of apicomplexan invasion machinery

Affiliations

Cryo-tomography reveals rigid-body motion and organization of apicomplexan invasion machinery

Long Gui et al. Nat Commun. .

Abstract

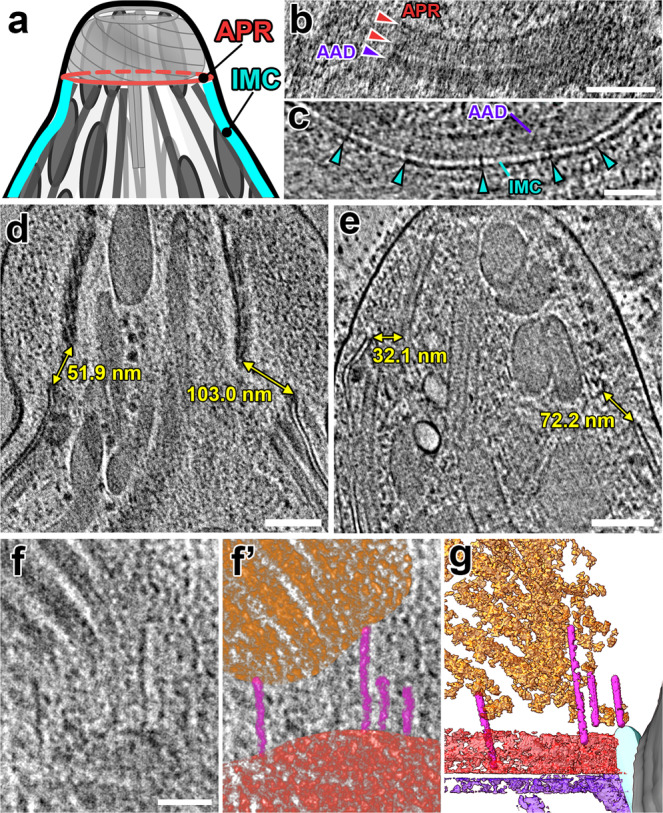
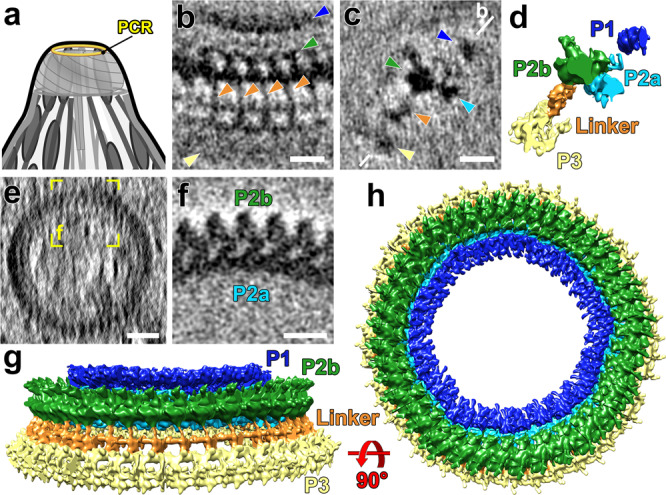
The apical complex is a specialized collection of cytoskeletal and secretory machinery in apicomplexan parasites, which include the pathogens that cause malaria and toxoplasmosis. Its structure and mechanism of motion are poorly understood. We used cryo-FIB-milling and cryo-electron tomography to visualize the 3D-structure of the apical complex in its protruded and retracted states. Averages of conoid-fibers revealed their polarity and unusual nine-protofilament arrangement with associated proteins connecting and likely stabilizing the fibers. Neither the structure of the conoid-fibers nor the architecture of the spiral-shaped conoid complex change during protrusion or retraction. Thus, the conoid moves as a rigid body, and is not spring-like and compressible, as previously suggested. Instead, the apical-polar-rings (APR), previously considered rigid, dilate during conoid protrusion. We identified actin-like filaments connecting the conoid and APR during protrusion, suggesting a role during conoid movements. Furthermore, our data capture the parasites in the act of secretion during conoid protrusion.


Conflict of interest statement

The authors declare no competing interests.

Figures

Fig. 1
Fig. 1. Three-dimensional in situ architecture of the apicomplexan invasion machinery revealed by cryo-FIB milling and cryo-ET.
a Cartoon overview of the components of the coccidian apical complex comparing the protruded and retracted states. This coloring scheme will be used throughout the manuscript. b Tomographic slice through a partially retracted conoid that was cryo-FIB milled in cross-sectional orientation, clearly shows the SPMTs ending near the AAD ring and with AAD projections (purple arrows) interspersed between neighboring SPMTs. c Tomographic slice of the reconstructed apical end of N. caninum with protruded conoid. Note the density connecting the two membranes of the inner membrane complex (IMC, cyan arrowheads). For other labels and coloring, see below. d 3D segmentation and visualization of the apical complex from a protruded conoid (different tomogram from (c)). Labels and colors used throughout the manuscript unless otherwise noted: AAD (purple), amorphous APR-associated density ring and projections; actin-like filaments (magenta in (c)); APR (red), apical polar rings; CF (orange) conoid fiber, ICMT (light green) intraconoidal microtubules, IMC (cyan) inner membrane complex, PCR (yellow) pre-conoidal rings, PM (gray) plasma membrane, SPMT (dark green) subpellicular microtubules. e Tomographic slice of the reconstructed apical end of a milled N. caninum with a retracted conoid, annotated as in (c). f 3D segmentation and visualization of a retracted conoid (different tomogram from (e)) and colored as in (d). In longitudinal views, an apical tip is oriented towards the top of the images throughout the manuscript, unless otherwise noted. Scale bars: 100 nm (in be).
Fig. 2
Fig. 2. The protruded conoid is tilted and off-center relative to the APRs.
a Cartoon of the apical complex in the protruded state, highlighting the APR and IMC structures. b A tomographic slice (longitudinal orientation) shows two distinct APR rings (red arrowheads) and the AAD ring (purple arrowhead), which is located between the APR and IMC. c A cross-sectional tomographic slice shows the IMC near the apical edge with “spacer” densities (cyan arrowheads) between the two membranes. d, e Tomographic slices through the protruded conoid complex from two parasites. Measurements mark the minimum distances between the IMC and the conoid fibers on each side of the conoid. f, g Tomographic slice (f: original; f’: pseudo-colored) and 3D-segmented isosurface rendering (g) of the same region at the base of a protruded conoid show filamentous actin-like densities (magenta) connecting between the conoid (orange) and the APRs (red). Scale bars: 100 nm (in b, d, e); 50 nm (in c, f).
Fig. 3
Fig. 3. The overall structure of the conoid remains unchanged during the cycles of protrusion and retraction.
ad’ Tomographic slices through the center of the apical complex show the conoid in the protruded (a) and retracted (b) states. White lines indicate the measurements of the apical diameter (a), the basal diameter (b), and the height (h) of the conoid structure. White boxes in (a, b) indicate the areas magnified in (c, d) where the conoid and the APR-associated complex interact; (c’ and d’) are the pseudo-colored versions of (c and d), colored as detailed in Fig. 1. Note the elongated, sheet-like density (gold arrowheads in a and b) tracking between micronemes and ICMT inside the conoid. IMC “spacer” densities are indicated with cyan arrowheads in (a, c). e Measurements of the apical diameter, the basal diameter, and the height of protruded (n = 3 tomograms, white bars) and retracted (n = 3 tomograms, gray bars) conoids show no significant changes during the cycles of protrusion and retraction. fi Tomographic slices (f, g) through the edge of reconstructed conoids (showing the conoid fibers in the longitudinal section) in the protruded (f) and retracted (g) states. Lines indicate the measurement of the relative angle between the CFs and the PCR plane (n = 14 measurements for the protruded and 13 measurements for the retracted states, red lines), and the measurement of the distance between neighboring CFs (n = 24 measurements for the protruded and 18 measurements for the retracted states, blue lines); the results of latter measurements for protruded and retracted conoids are shown in (h) and (i), respectively. jm Tomographic slices show representative PCRs (j and m) and APRs (k and l) in cross-sectional views of the apical complex in protruded (j, k) and retracted (l, m) states. Diameters of APRs and PCRs are indicated as ranges from all available tomograms (n = 3 for APRs in both states; n = 3 PCRs protruded; n = 2 PCRs retracted). Scale bars: 100 nm (in a, b, jm); 50 nm (in c, d, f, g). Data were expressed as mean ± standard deviation. Statistical significance was calculated by a two-tailed Student’s t-test. ns not significant (p > 0.05).
Fig. 4
Fig. 4. Subtomogram averages of the conoid fibers show a C-shape architecture with nine tubulin protofilaments and associated proteins.
a, b Cross-sectional tomographic slices of the averaged 8-nm repeats of the CF fibers in the protruded (a) and retracted (b) states. ce The high-resolution structure of tubulin was fitted into the subtomogram averages of the protruded (c, blue) and the retracted (d, pink) states. Comparison (e) of the two pseudo-atomic protofilament models in the protruded (blue) and retracted (pink) states shows no significant difference. f Longitudinal views of the pseudo-atomic protofilament model in the retracted state. The pitch was estimated based on the rise of the periodic CF-associated MAPs between neighboring protofilaments. g Isosurface rendering of the nice-fold averaged protofilaments display a “clockwise skew” when viewed from the conoid base, suggesting the minus ends of the conoid fibers are orientated to the base. h The arrangements of the modeled protofilaments in the CFs (pink) compared with the high-resolution cryo-EM structure of the typical 13-protofilament subpellicular microtubules (green; EMDB: EMD-23870). The most substantial difference is the angle change between PF4 and PF5, causing a tight kink in the protofilament arrangement. ik Tomographic slices of the global CF subtomogram averages that combine all data from both the protruded (a) and retracted (b) states viewed in cross-sectional (i: original; i’: pseudo-colored) and longitudinal (j and k) orientations. The white lines in (i) indicate the locations of the slices in the respective panels. Labels and coloring see below. lo Isosurface renderings show the 3D structures of the averaged CF repeats in cross-sectional (l) and longitudinal (m) views, as well as the CFs from a complete conoid (n) by assembling the averaged 8-nm repeats back into the full tomogram. This and the zoom-in (o) show that the open face of the C-shaped CFs faces the interior of the conoid. Labels and coloring: 1–9, protofilaments; IA (blue) and OA (pink) “inner-layer arm” and “outer-layer arm” densities, IJ (yellow) inner junction, MAP; MAP1 (orange), MAP2 (magenta), MAP4 (green), microtubule-associated proteins. Scale bars: 10 nm (in a, b, ik).
Fig. 5
Fig. 5. Subtomogram averages of the PCRs show three rings and a linker.
a Cartoon of the apical complex highlighting the location of the PCRs. bd Tomographic slices (b and c), and isosurface rendering of the averaged PCR repeats (d) viewed in the tangential (b) and longitudinal (c and d) orientations, showing different components of the PCR including the apical P1 (highlighted by blue arrowheads), P2a (cyan), P2b (green), P3 (yellow), and the linker (orange) between P2b and P3. The white line in (c) indicates the location of the slice in (b). e, f Cross-sectional slices from a raw tomogram (e) and the averaged PCR repeats (f) show that the round PCR P2 ring is composed of an outer and an inner ring, P2a and P2b, respectively. The yellow square in (e) indicates the orientation and location of the subtomogram average displayed in (f). g, h Isosurface renderings show the complete PCRs by assembling the averaged repeats back to the full tomogram. Scale bars, 20 nm (in b, c, f); 50 nm (in e).
Fig. 6
Fig. 6. The apical secretory machinery is organized around the intraconoidal microtubules (ICMT) in both protruded and retracted states.
a, b Tomographic slices show the apical tip of a N. caninum cell with the secretory organelles organized around the ICMT (green) inside the protruded conoid complex in longitudinal views (a, a’—protruded original and pseudo-colored; b—retracted). The long ICMTs connect the apex of the conoid to the cytosol, and are closely co-localized with the secretory vesicles (light blue) and two rhoptries (rose). Note that the membrane-associated, most-apical vesicle is not visible in the tomographic slice shown in (a), but is visible in panels (c, d) and Fig. 7b. Other coloring: CFs (orange), micronemes (dark blue), sheet-like density (gold), inter-vesicular connections (pink), “crowning” density that caps the apical minus-end of the ICMT (purple). ce 3D segmentation and visualization of tomograms shown in (a and b, respectively), i.e., with protruded (c, d) and retracted (e) conoid, showing the overall organization of secretory organelles within the conoid complex, including CFs (trimmed from the front to show the content inside), micronemes, rhoptries, ICMT, vesicles, inter-vesicular connections, sheet-like structure along micronemes, and plasma membrane (gray). d shows a zoom-in from (c), with conoid fibers hidden for clarity. f, g Cross-sectional slices through the protruded (f, f’—original and pseudo-colored) and retracted (g) conoids from the tomograms shown in (a and b). Scale bars: 100 nm (in a, b); 50 nm (in f, g).
Fig. 7
Fig. 7. The intraconoidal microtubules and functional segregation of secretory organelles within the conoid complex revealed by cryo-FIB milling and cryo-ET.
ac’ Tomographic slices (ac: original; a’–c’: pseudo-colored) show: (a, a’) five regularly spaced vesicles (light blue), of which four are tracking along one of the microtubules of the ICMT (light green) and are connected by inter-vesicular linkers (pink); (b, b’) a rhoptry (rose) interacting with the plasma membrane (PM) via the most-apical vesicle (light blue) and the “rosette” docking complex (yellow); and (c, c’) a spiraling scaffold (dark rose) associated with the rhoptry membrane in the rhoptry-neck region. d, e Slices of the subtomogram averaged 8-nm repeats of the ICMTs viewed in cross-sectional (d) and longitudinal (e) orientations. f Occasionally, more than two microtubules were observed in the ICMT complex. Shown here is an example of three microtubules (white arrowheads). g Thirteen-fold rotationally averaged ICMT from 53 subtomograms of detergent-extracted Toxoplasma cells. The arrows indicate the clockwise skew of the protofilaments when the ICMT are viewed from apical to basal, indicating that the minus ends of the ICMTs are oriented apically in the parasite. h, h’ The basal ends of the ICMTs showed flared ends and different lengths of protofilaments, which is usually associated with dynamic plus-ends of MTs. i A tomographic slice of a protruded conoid shows the organization of micronemes. Insert: the subtomogram average of 25 microneme apical tips shows a flattened, electron-dense cap. j, k Tomographic slices provide a side (j) and a top cross-sectional view (k) of two secretory organelles, a microneme (M) and a rhoptry-associated vesicle (V), that are docked side-by-side to the plasma membrane (the vesicle through the rosette (Ro)), but with distinct docking sites (44 nm apart). Note that both organelles are tethered (pink and blue arrows) to the same plasma membrane-anchored ridge (yellow arrows). The white line in (j) indicates the location of the slice in (k). Scale bars: 100 nm (in I); 50 nm (in ac, f, h, j, k); 20 nm (in i insert), 10 nm (in d, e, g).

References

    1. Long S, Anthony B, Drewry LL, Sibley LD. A conserved ankyrin repeat-containing protein regulates conoid stability, motility and cell invasion in Toxoplasma gondii. Nat. Commun. 2017;8:2236. doi: 10.1038/s41467-017-02341-2. - DOI - PMC - PubMed
    1. Long S, et al. Calmodulin-like proteins localized to the conoid regulate motility and cell invasion by Toxoplasma gondii. PLoS Pathog. 2017;13:e1006379. doi: 10.1371/journal.ppat.1006379. - DOI - PMC - PubMed
    1. Tosetti N, Dos Santos Pacheco N, Soldati-Favre D, Jacot D. Three F-actin assembly centers regulate organelle inheritance, cell-cell communication and motility in Toxoplasma gondii. eLife. 2019;8:e42669. doi: 10.7554/eLife.42669. - DOI - PMC - PubMed
    1. O’Shaughnessy WJ, Hu X, Beraki T, McDougal M, Reese ML. Loss of a conserved MAPK causes catastrophic failure in assembly of a specialized cilium-like structure in Toxoplasma gondii. Mol. Biol. Cell. 2020;31:881–888. doi: 10.1091/mbc.E19-11-0607. - DOI - PMC - PubMed
    1. Hu K, Roos DS, Murray JM. A novel polymer of tubulin forms the conoid of Toxoplasma gondii. J. Cell Biol. 2002;156:1039–1050. doi: 10.1083/jcb.200112086. - DOI - PMC - PubMed

Publication types

MeSH terms