. 2023 Mar 30;13(1):5166.
doi: 10.1038/s41598-023-32031-7.

Dynamics of non-household contacts during the COVID-19 pandemic in 2020 and 2021 in the Netherlands

Affiliations

Dynamics of non-household contacts during the COVID-19 pandemic in 2020 and 2021 in the Netherlands

Jantien A Backer et al. Sci Rep. .

Abstract

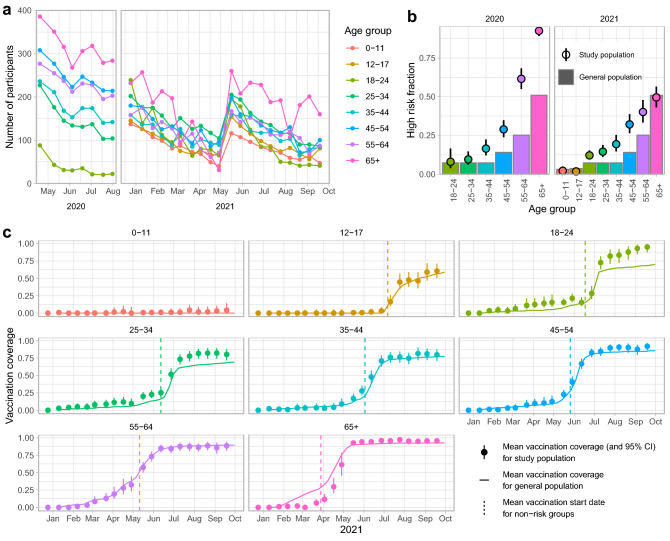
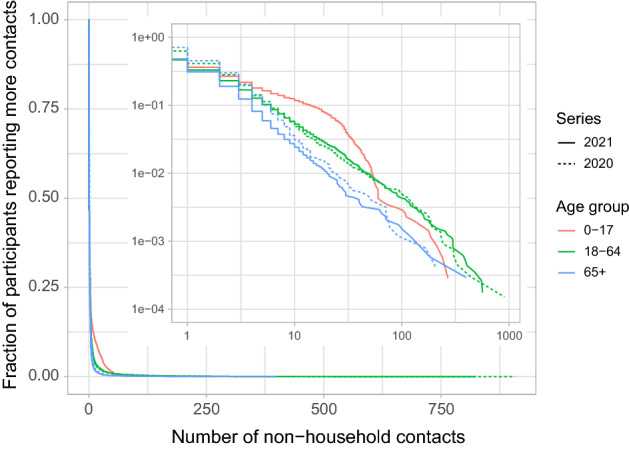
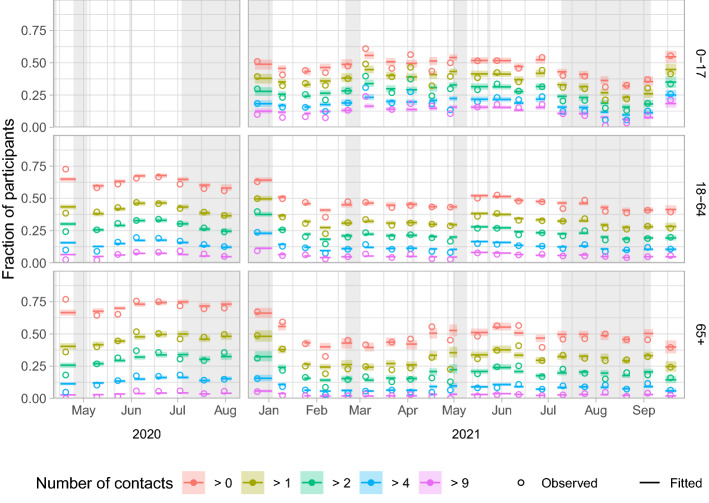
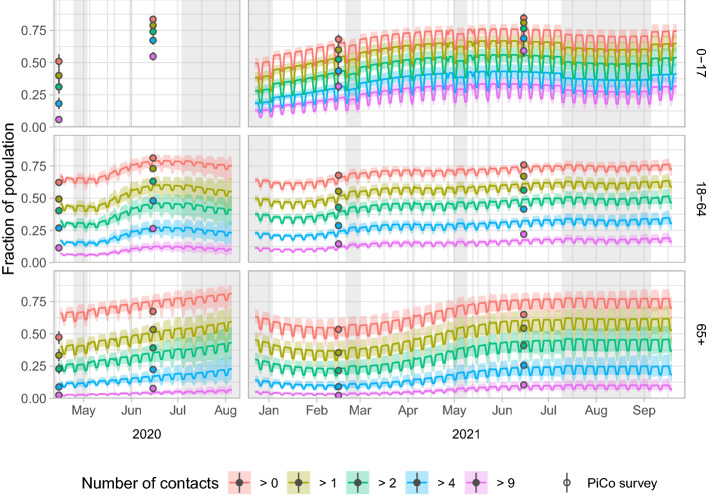
The COVID-19 pandemic was in 2020 and 2021 for a large part mitigated by reducing contacts in the general population. To monitor how these contacts changed over the course of the pandemic in the Netherlands, a longitudinal survey was conducted where participants reported on their at-risk contacts every two weeks, as part of the European CoMix survey. The survey included 1659 participants from April to August 2020 and 2514 participants from December 2020 to September 2021. We categorized the number of unique contacted persons excluding household members, reported per participant per day into six activity levels, defined as 0, 1, 2, 3-4, 5-9 and 10 or more reported contacts. After correcting for age, vaccination status, risk status for severe outcome of infection, and frequency of participation, activity levels increased over time, coinciding with relaxation of COVID-19 control measures.


Conflict of interest statement

The authors declare no competing interests.

Figures

Figure 1
Figure 1
Characteristics of study population, compared to general population. (a) Number of participants included per survey round in the 2020 and 2021 series, by age group. After 10 survey rounds in May 2021, the study population was supplemented to meet the target numbers of the first survey round again. (b) The fraction of high risk participants of the 2020 and 2021 series (points with 95% confidence interval), and of the general population (bars). Only participants with unambiguous risk status are included. (c) Vaccination coverage in 2021 per age group of the study population (points with 95% confidence interval) and of the general population (line). The dashed line denotes the average date when non-risk groups were invited for vaccination. The dashed line for the 55–64 age group is in fact the average for 55–59 year olds, as 60–64 year olds were invited by their general practitioner.
Figure 2
Figure 2
Distribution of number of contacts per participant per round excluding household members. Distribution by series (line type) and age group (color), with complementary cumulative distribution function on y-axis. The inset shows the same plot on log–log scale.
Figure 3
Figure 3
Fitted and observed activity levels over time by series (columns) and age group (rows). Activity levels are shown as the fraction of participants that report more than a certain number of non-household contacts per day. With five limits (> 0, > 1, > 2, > 4 and > 9) six activity levels are defined, e.g. the fraction between the limits of > 2 and > 4 is the activity level that represents 3 or 4 contacts per participant. The model fits per round are shown by the median (lines) and 95% interval (shaded), from the first to last participation date of that survey round. The observed activity levels per round (open circles) are placed at the mean participation date of that survey round. Holidays and school holiday periods are shaded in grey.
Figure 4
Figure 4
Predicted activity levels over time by series (columns) and age group (rows) for the general population. Activity levels are shown as the fraction of the population that has more than a certain number of non-household contacts per day. With five limits (> 0, > 1, > 2, > 4 and > 9) six activity levels are defined, e.g. the fraction between the limits of > 2 and > 4 is the activity level that represents 3 or 4 contacts per person. The model predictions are shown by the median (lines) and 95% interval (shaded). The activity levels observed in the contact survey of the independent PiCo study are shown for comparison per round at the mean participation date (points), with bootstrapped 95% confidence intervals. Holidays and school holiday periods are shaded in grey.

References

    1. Zhang J, et al. Changes in contact patterns shape the dynamics of the COVID-19 outbreak in China. Science. 2020;368:1481–1486. doi: 10.1126/science.abb8001. - DOI - PMC - PubMed
    1. Latsuzbaia A, Herold M, Bertemes JP, Mossong J. Evolving social contact patterns during the COVID-19 crisis in Luxembourg. PLoS ONE. 2020;15:e0237128. doi: 10.1371/journal.pone.0237128. - DOI - PMC - PubMed
    1. Quaife M, et al. The impact of COVID-19 control measures on social contacts and transmission in Kenyan informal settlements. BMC Med. 2020;18:316. doi: 10.1186/s12916-020-01779-4. - DOI - PMC - PubMed
    1. Backer JA, et al. Impact of physical distancing measures against COVID-19 on contacts and mixing patterns: repeated cross-sectional surveys, the Netherlands, 2016–2017, April 2020 and June 2020. Euro Surveill. 2021;26:1–10. doi: 10.2807/1560-7917.ES.2021.26.8.2000994. - DOI - PMC - PubMed
    1. Bosetti P, et al. Lockdown impact on age-specific contact patterns and behaviours, France, April 2020. Euro Surveill. 2021 doi: 10.2807/1560-7917.ES.2021.26.48.2001636. - DOI - PMC - PubMed

Publication types