. 2023 Mar 30;6(1):59.
doi: 10.1038/s41746-023-00796-w.

Continuous cuffless blood pressure monitoring with a wearable ring bioimpedance device

Affiliations

Continuous cuffless blood pressure monitoring with a wearable ring bioimpedance device

Kaan Sel et al. NPJ Digit Med. .

Abstract

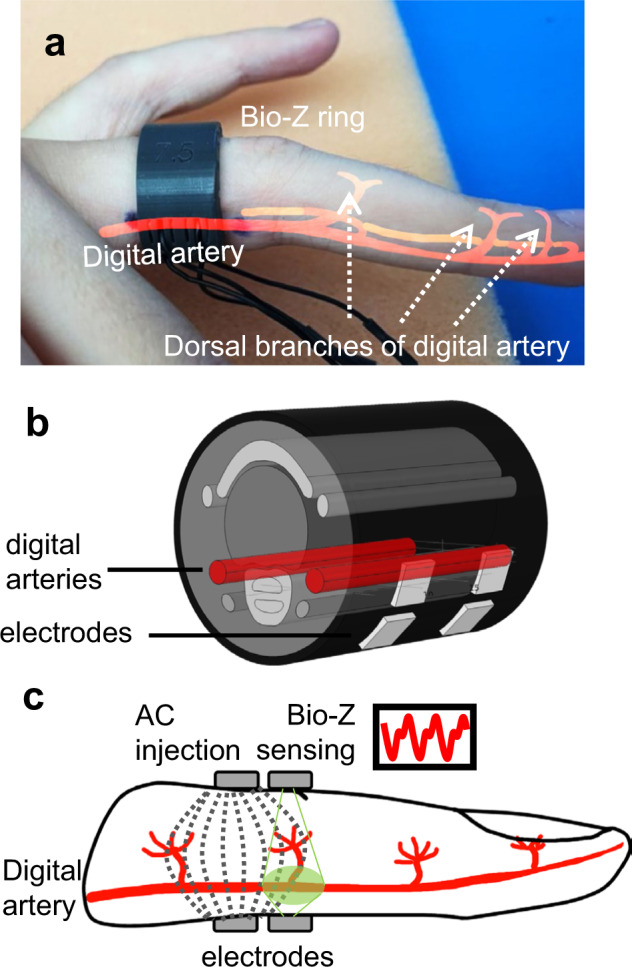
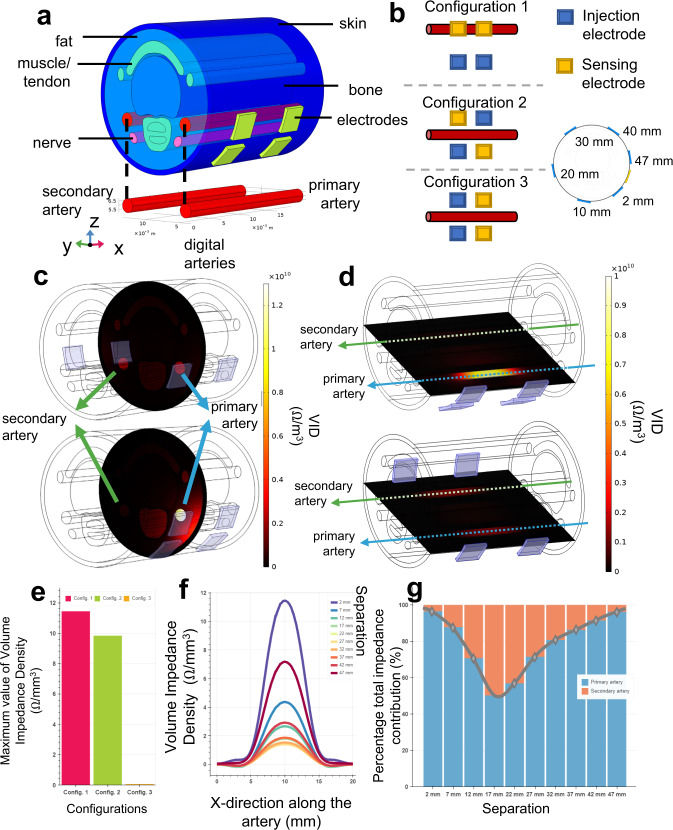
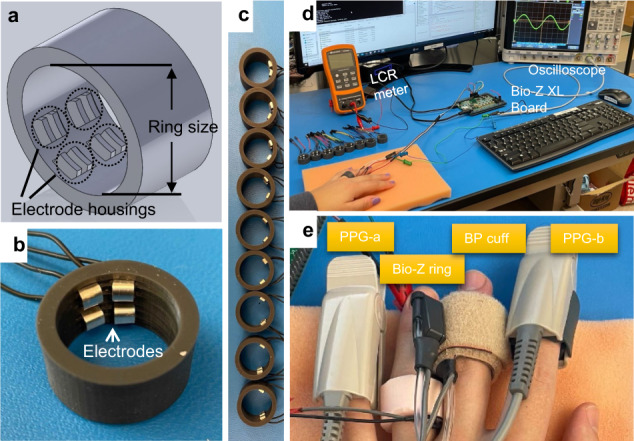
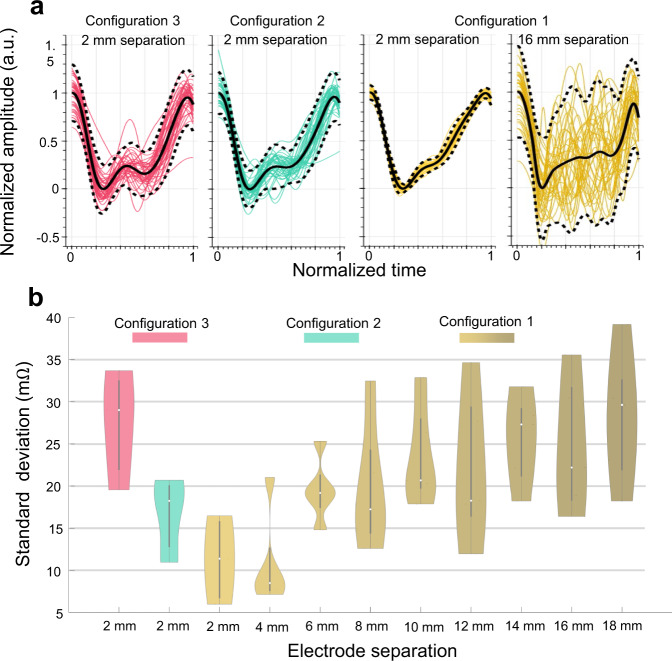
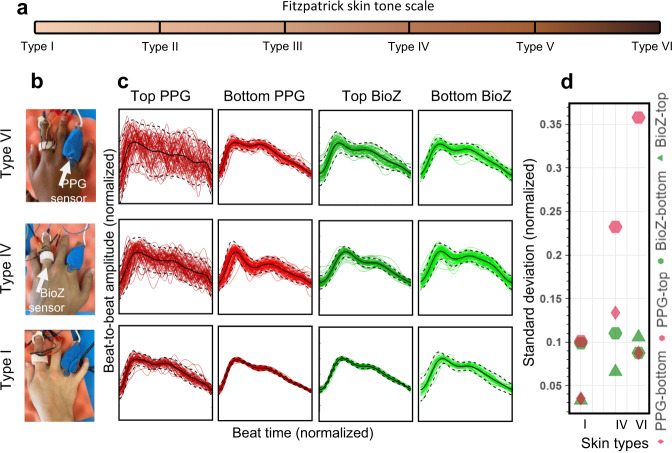
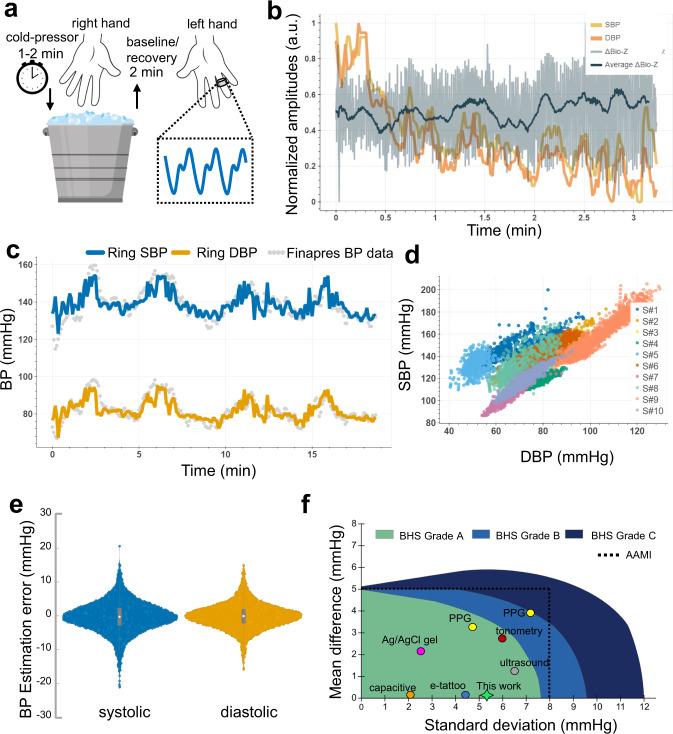
Smart rings provide unique opportunities for continuous physiological measurement. They are easy to wear, provide little burden in comparison to other smart wearables, are suitable for nocturnal settings, and can be sized to provide ideal contact between the sensors and the skin at all times. Continuous measuring of blood pressure (BP) provides essential diagnostic and prognostic value for cardiovascular health management. However, conventional ambulatory BP measurement devices operate using an inflating cuff that is bulky, intrusive, and impractical for frequent or continuous measurements. We introduce ring-shaped bioimpedance sensors leveraging the deep tissue sensing ability of bioimpedance while introducing no sensitivity to skin tones, unlike optical modalities. We integrate unique human finger finite element model with exhaustive experimental data from participants and derive optimum design parameters for electrode placement and sizes that yields highest sensitivity to arterial volumetric changes, with no discrimination against varying skin tones. BP is constructed using machine learning algorithms. The ring sensors are used to estimate arterial BP showing peak correlations of 0.81, and low error (systolic BP: 0.11 ± 5.27 mmHg, diastolic BP: 0.11 ± 3.87 mmHg) for >2000 data points and wide BP ranges (systolic: 89-213 mmHg and diastolic: 42-122 mmHg), highlighting the significant potential use of bioimpedance ring for accurate and continuous estimation of BP.


Conflict of interest statement

R.J. is an Associate Editor of npj Digital Medicine. R.J. filed a patent related to this research and this patent is licensed to SpectroBeat LLC. The associated patent application is US 2020/0138303 with the title “System and method for cuff-less blood pressure monitoring”. Other authors declare no competing interests.

Figures

Fig. 1
Fig. 1. Bioimpedance (Bio-Z) ring sensor for arterial blood flow and pressure sensing.
a A fabricated ring example custom fit to user’s finger size. b The finite element model of the human finger used in guiding ring design. c Cross-section of the four electrode bioimpedance sensing, with dashed lines representing high frequency alternating current (AC) distribution within the finger, and green area shows sensitive area for Bio-Z sensing electrodes.
Fig. 2
Fig. 2. Finite element model of the finger and its electrical simulations.
a Three-dimensional finger model scaled for US-7 ring form factor, with six different tissue layers (i.e., skin, fat, bone, artery, nerve, muscle) and metal electrodes with complex electrical characteristics defined for each material type. b Three electrode configurations that exhausts possible combinations of electrical current injection and voltage sensing electrodes used in 4-point bioimpedance sensing. c, d Volume impedance density (VID) surface plots for y-z (vertical cut of the artery from the middle point) and x-y planes (horizontal cut along the artery), respectively, where top plots and bottom plots show the VID with 22 mm and 2 mm electrode separation. In both cases, the primary artery VID contribution is higher with smaller electrode separation, shown as in brighter color. e Maximum values of the VID measured from the primary artery for different configurations (Config.), where the highest value obtained with Configuration 1 (pink) compared to Configurations 2 (green) and 3 (orange). f VID distribution along the primary artery for different electrode separations. The highest values are obtained with 2 mm electrode separation. Colors indicate the separation. g Percentage total impedance distribution between the primary (blue) and secondary (orange) arteries calculated from the volume integral of the VID measured per artery. In agreement with other analysis types, the highest specificity for the primary artery is achieved with 2 mm separation.
Fig. 3
Fig. 3. Bioimpedance ring-sensor.
a 3-D SolidWorks design of the ring. b An example US-7 ring with 2 mm electrode separation. c A total of nine different electrode separation rings (2 mm to 18 mm, with 2 mm step). d Experimental setup used in assessing bioimpedance signal quality acquired with ring sensor. Bio-Z XL board is used for bioimpedance signal acquisition with data sent to PC for post-processing through a USB communication. The LCR meter is used to ensure good electrode-skin contact prior to experimentation. Oscilloscope is used to check the presence of saturation during the signal acquisition. e Different sensors on the same hand are used for blood pressure (BP) experiments. Bio-Z ring sensor is worn on the ring finger, with the Finapres NOVA BP cuff on the middle finger providing reference BP values. Photoplethysmography (PPG) sensors, PPG-a and PPG-b, are connected to the Bio-Z XL board and Finapres NOVA device respectively, and used for synchronization of BP beats with ring sensor bioimpedance features.
Fig. 4
Fig. 4. Bioimpedance signal illustration during a cardiac cycle and the corresponding bioimpedance feature definitions used in blood pressure correlation analysis.
The amplitude features are shown in blue color, the timing features are shown in yellow color (STT: slope transit time, IBI: inter-beat intervals), and the area features are shown in green color. We named the feature pertaining to the area between the diastolic point and the maximum slope point as Adia, the area between the maximum slope point and the systolic point as Aslope, and the area between the diastolic and the systolic point as Asys.
Fig. 5
Fig. 5. Bioimpedance signal consistency analysis results for different electrode configurations and sizes for data collected from N = 5 participants.
a Bioimpedance signals over an example 30-seconds trial for different electrode configurations, visualizing the signal consistency over a constant period. The highest consistency is achieved with 2 mm ring separation using Configuration 1 (yellow) compared to Configuration 2 (green) and 3 (pink). b Violin plots for standard deviation (SD) metric used for signal consistency analysis calculated with different electrode configurations and separations. Violin plots include SD values averaged for all the trials of each participant and combined together. Box plots show the median and the Q25 and Q75 ranges. Colors used to identify separations and configurations. Here 2 mm and 4 mm electrode separations with Configuration 1 yield the lowest SD values indicating a higher overall bioimpedance signal consistency.
Fig. 6
Fig. 6. Comparison of arterial pulse wave captured with bioimpedance and PPG sensors for varying skin tones.
a Fitzpatrick skin tone scale. In this study, we used Type I (pale white), Type IV (moderate brown), and Type VI (dark brown) skin types. b Bioimpedance (BioZ) ring sensor and Nellcor Maxfast PPG sensor (660 nm–red) placed at index and ring fingers respectively to capture simultaneous blood pressure pulse wave. During the measurements, the PPG sensor is wrapped around the finger with a self-adherent cohesive bandage to establish tight fit contact with the skin. c Normalized waveforms captured in two different scenarios placed on top of the skin, that is darker (plots at first and third columns) when compared to the placement on the bottom with a lighter skin tone (plots at second and fourth columns), from three participants with three skin types I, IV and VI. d Standard deviation values from the normalized beats with respect to the normalized average beat for different sensors and placements for different skin types. The results show a clear degradation in signal consistency for PPG sensor when the skin color gets darker, whereas no significant correlation was observed for bioimpedance sensor.
Fig. 7
Fig. 7. Bioimpedance ring sensor systolic (SBP) and diastolic (DBP) blood pressure results.
a Visualization of cold-pressor test to induce blood pressure variations. b SBP (yellow line) and DBP (orange line) beats, and corresponding bioimpedance signal (gray line) and its mean (dark blue line) for a single trial collected at the participant’s recovery from hand-grip/cold-pressor test. c SBP (blue line) and DBP (orange line) estimations with bioimpedance ring sensor in reference to gold-standard Finapres finger BP cuff measurements (gray circles) for a single participant (S#3). d SBP and DBP value distributions for all participants, showing the wide range of blood pressure values used in evaluation. Colors represent data from different participants. e Violin plots for SBP (blue) and DBP (orange) estimations errors with ring sensors in comparison to reference Finapres BP. The gray box plot shows the median, and 25th and 75th quartiles. f Comparison of related work with this work for cuffless BP estimation and their classification based on the AAMI and BHS standards. Green, light blue, and dark blue areas represent Grade A, Grade B, and Grade C classifications for the BHS standard. Dashed black line represents the error limits set by the AAMI standard.
Fig. 8
Fig. 8. Bioimpedance ring sensor leave-one-subject-out analysis for systolic (SBP) and diastolic (DBP) blood pressure estimation.
a SBP (top) and DBP (bottom) data distribution training set involving participants S#6, S#7, and S#9 shown in gray color, true SBP, and DBP values in the test set for S#8’s’data shown in red color, and predicted SBP (blue) and DBP (orange) values for S#8’s data. b Correlation plots for SBP and DBP between true and predicted BP points, showing high correlation values (r represents Pearson’s correlation coefficient between true and predicted BP values). c Time traces for SBP (blue line) and DBP (orange line) estimations with bioimpedance ring sensor for S#8, and the reference BP values (gray circles), where the model was trained on three other participants’ data.

References

    1. Yano Y, Kario K. Nocturnal blood pressure and cardiovascular disease: a review of recent advances. Hypertens. Res. 2012;35:695–701. doi: 10.1038/hr.2012.26. - DOI - PubMed
    1. Hoeper MM, et al. Definitions and diagnosis of pulmonary hypertension. J. Am. Coll. Cardiol. 2013;62:D42–D50. doi: 10.1016/j.jacc.2013.10.032. - DOI - PubMed
    1. Asayama, K., Ohkubo, T. & Imai, Y. In-office and out-of-office blood pressure measurement. J. Hum. Hypertens. 1–9 (2021). - PMC - PubMed
    1. Bartels K, Esper SA, Thiele RH. Blood pressure monitoring for the anesthesiologist: a practical review. Anesth. Analg. 2016;122:1866–1879. doi: 10.1213/ANE.0000000000001340. - DOI - PubMed
    1. Kwon Y, et al. Blood pressure monitoring in sleep: time to wake up. Blood Press Monit. 2020;25:61. doi: 10.1097/MBP.0000000000000426. - DOI - PMC - PubMed