. 2023 Mar 30;13(1):5222.
doi: 10.1038/s41598-023-32271-7.

Respiratory brain impulse propagation in focal epilepsy

Affiliations

Respiratory brain impulse propagation in focal epilepsy

Ahmed Elabasy et al. Sci Rep. .

Erratum in

Abstract

Respiratory brain pulsations pertaining to intra-axial hydrodynamic solute transport are markedly altered in focal epilepsy. We used optical flow analysis of ultra-fast functional magnetic resonance imaging (fMRI) data to investigate the velocity characteristics of respiratory brain impulse propagation in patients with focal epilepsy treated with antiseizure medication (ASM) (medicated patients with focal epilepsy; ME, n = 23), drug-naïve patients with at least one seizure (DN, n = 19) and matched healthy control subjects (HC, n = 75). We detected in the two patient groups (ME and DN) several significant alterations in the respiratory brain pulsation propagation velocity, which showed a bidirectional change dominated by a reduction in speed. Furthermore, the respiratory impulses moved more in reversed or incoherent directions in both patient groups vs. the HC group. The speed reductions and directionality changes occurred in specific phases of the respiratory cycle. In conclusion, irrespective of medication status, both patient groups showed incoherent and slower respiratory brain impulses, which may contribute to epileptic brain pathology by hindering brain hydrodynamics.


Conflict of interest statement

The authors declare no competing interests.

Figures

Figure 1
Figure 1
Optical flow analysis demonstration during inhalation. (A) An inspiration increases the MREG BOLD signal to a peak as venous blood is drawn into the thorax and CSF flows into the brain. (B) the inspiratory signal peak propagates through the brain tissue in waves, which can be detected by the signal peak detector. (C) as the respiratory wavefront propagates, the corresponding signal peak in neighboring regions appears with a measurable time dely. (D), optical flow analysis can track magnitude vs and direction v of the propagation velocity of the respiratory brain impulse Vresp wavefront between consecutive 3D time volumes.
Figure 2
Figure 2
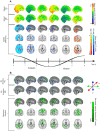
Optical flow analysis to produce mean velocity maps over entire respiratory cycle. (Upper section), optical flow analysis of the input mean data (HC, n = 75) of MREG BOLD signal intensity reflecting the QPP respiratory impulse propagation in healthy brain across the respiratory cycle, which is segmented into six epochs from exhalation to inhalation. (Middle section), mean 3D optical flow results from following the respiratory impulse peaks yield combined speed, magnitude, and directionality vectors in standard MNI space. The 3D optical flow result indicates in 3D the [X, Y, Z] directions in [Red, Green, Blue, respectively] colors for the impulse as it propagates through the brain. (Lower section), a 3D directional rendering of impulse vectors shown separately in X, Y and Z directions in opposing (red/blue) directions across the respiratory cycle. *All the results are also illustrated dynamically in Supplementary Videos. The result of the optical flow mean analysis and the velocity components is presented in Supplementary Video 1. The result of the optical flow mean analysis for HC, ME and DN is presented in Supplementary Video 2.
Figure 3
Figure 3
Alterations in mean velocity of respiratory brain impulse. (A) statistical difference maps of the respiratory impulse propagation speed vs between the ME group (n = 23) vs. HC group (n = 75) (left), and the DN group (n = 19) vs. HC group (n = 75) (right). The statistical differences (cycle randomise test, harmonic mean correction, p < 0.03) show a significant reduction in vs over most parts of the cerebrum and cerebellum as well as brainstem in both patient groups. (B) statistical comparison maps of reversed v of the respiratory impulse propagation between the ME and HC groups (left), and between the DN and HC groups (right). The mean v is widely reversed over the whole respiratory cycle in the ME and DN groups in patchy areas extending throughout the brain (cycle randomise test, harmonic mean correction, p < 0.03).
Figure 4
Figure 4
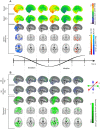
Comparison between HC and ME groups in mean Vresp brain impulse over an entire respiratory cycle. (A) mean magnitude maps of respiratory impulse vs shown across six phases of the inhalation/exhalation cycle for the HC group (n = 75) (top) and the ME group (n = 23) (middle). At the bottom, findings in the X, Y, and Z directions illustrate significant (FSL randomise, family-wise-error-rate (FWER) correction, p < 0.05) group spatial differences between the respective respiratory cycle phase means, with the most significantly reduced vs in ME patients during the early part of exhalation. We see a small phase of increased vs at the late inspiratory phase just preceding before the large exhalation-associated vs decrease. (B) mean respiratory impulse velocity 3D direction maps showing v in across the six phases of inhalation/exhalation cycle averaged over the respiratory cycle, of HC group (top) and ME group (middle). At the bottom, we see (FSL randomise, FWER correction, p < 0.05) differences between the respective respiratory cycle phase averages. Each phase shows a marked reversal of Vresp, which vanishes during the middle phases both of inhalation and exhalation. Supplementary Videos 3 (vs) and 4 (v) visualize the dynamic nature of the Vresp pathology in epilepsy.
Figure 5
Figure 5
Comparison between HC and DN groups regarding mean voxelwise Vresp brain impulse over an entire respiratory cycle. (A) mean vs maps of respiratory impulse shown across six phases across the inhalation/exhalation cycle, HC group (n = 75) (top) and DN group (n = 19) (middle). At the bottom, we see 3-direction (X, Y, and Z) maps illustrating significant (FSL randomise, FWER correction, p < 0.05) group spatial differences between respective respiratory cycle phase averages. Similar to the ME data in Fig. 4, the most significant group difference was the relative reduction of vs in the DN group during early exhalation, preceded by a spatially small phase of increased vs in the late inspiratory phase prior to exhaling. (B) mean respiratory impulse velocity 3D direction maps shown across the six phases of the inhalation/exhalation cycle averaged over the respiratory cycle for the HC group (top) and DN group (middle). At the bottom, there are the reversed v brain direction differences (FSL randomise, FWER correction, p < 0.05) between respective respiratory cycle phase averages. Reversed v was detected in large mainly cortical areas during the early phases both of exhalation and inhalation, but lasting over a shorter period than in the ME group. Supplementary Videos 5 (vs) and 6 (v) the dynamic nature of the Vresp pathology in untreated DN. Directional instability in epileptic brain respiratory impulse propagation.
Figure 6
Figure 6
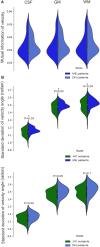
Comparison of the velocity of resampled respiratory MREG signal between ME and DN groups versus the HC group. (A) mean mutual information of mean global Vresp in (ME, n = 23 and DN, n = 19) groups relative to the HC group (n = 75), shows that the mutual information is very close to zero, i.e. the pulsations are highly divergent in the pooled patients, with the ME group being more divergent than the DN group. (B) STD of v between ME and DN groups vs. the HC group shows that the ME group had significantly (unpaired two-sample t-test, p < 0.05) more deviation from the mean flow directionality measured in the HC group, whereas, the DN group differed at the margin of significance (unpaired two-sample t-test, about p = 0.05).

Similar articles

Cited by

References

    1. Lach P, et al. Neuroinflammation in epilepsy—Diagnostics and therapeutic perspectives. Curr. Pharmacol. Rep. 2022;8:31–35. doi: 10.1007/s40495-021-00270-9. - DOI
    1. Armijo J, et al. Ion Channels and Epilepsy. CPD. 2005;11:1975–2003. doi: 10.2174/1381612054021006. - DOI - PubMed
    1. Löscher W, Klein P. The pharmacology and clinical efficacy of antiseizure medications: From bromide salts to cenobamate and beyond. CNS Drugs. 2021;35:935–963. doi: 10.1007/s40263-021-00827-8. - DOI - PMC - PubMed
    1. Nedergaard M. Garbage truck of the brain. Science. 2013;340:1529–1530. doi: 10.1126/science.1240514. - DOI - PMC - PubMed
    1. Iliff JJ, et al. A paravascular pathway facilitates CSF flow through the brain parenchyma and the clearance of interstitial solutes, including Amyloid β. Sci. Transl. Med. 2012 doi: 10.1126/scitranslmed.3003748. - DOI - PMC - PubMed

Publication types