. 2023 May;24(5):814-826.
doi: 10.1038/s41590-023-01473-6. Epub 2023 Mar 30.

G-CSF drives autoinflammation in APLAID

Affiliations

G-CSF drives autoinflammation in APLAID

Elisabeth Mulazzani et al. Nat Immunol. 2023 May.

Abstract

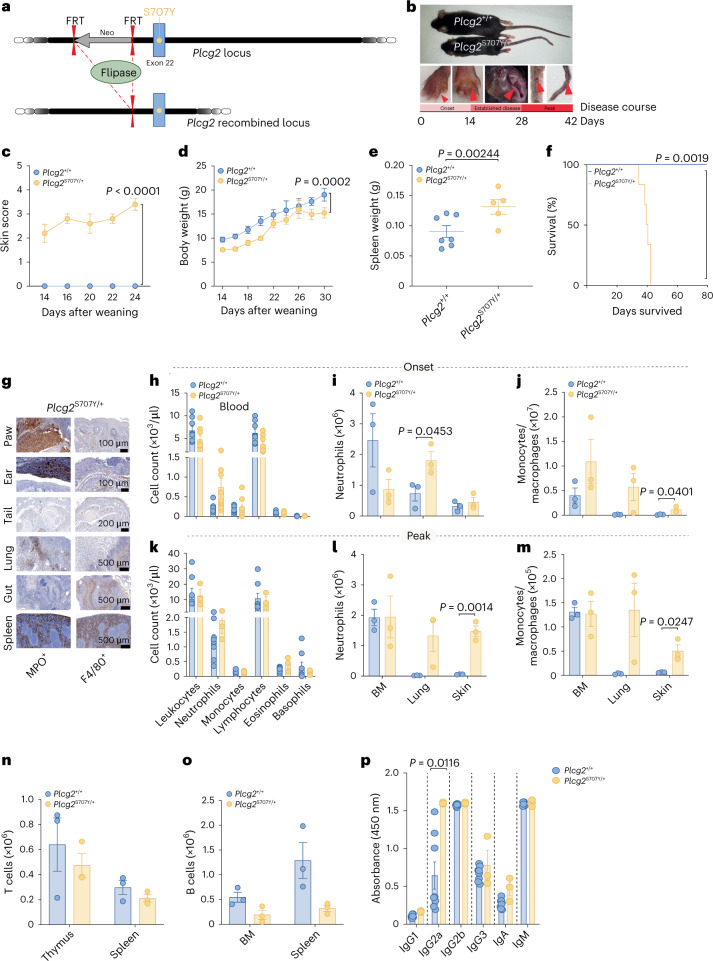
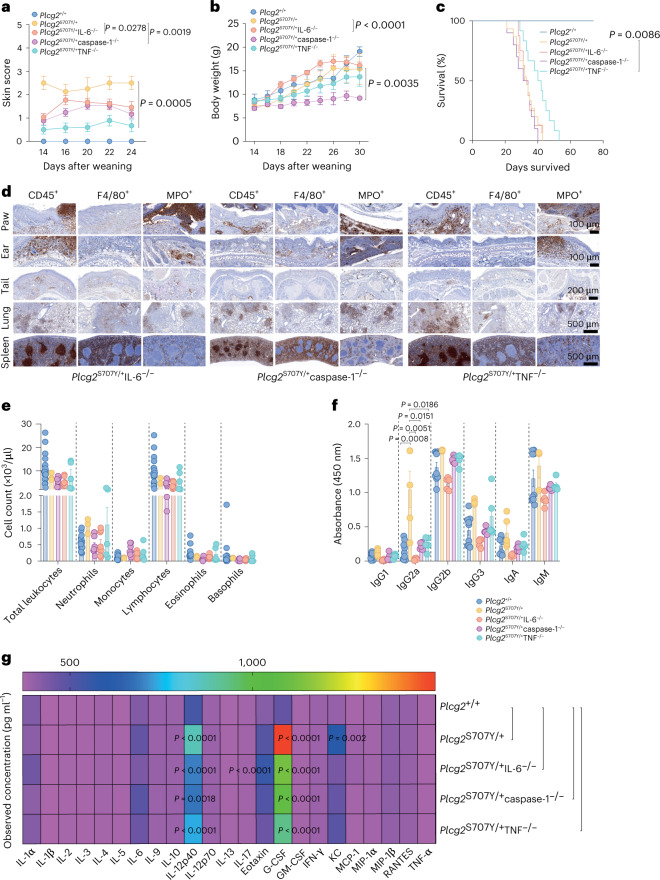
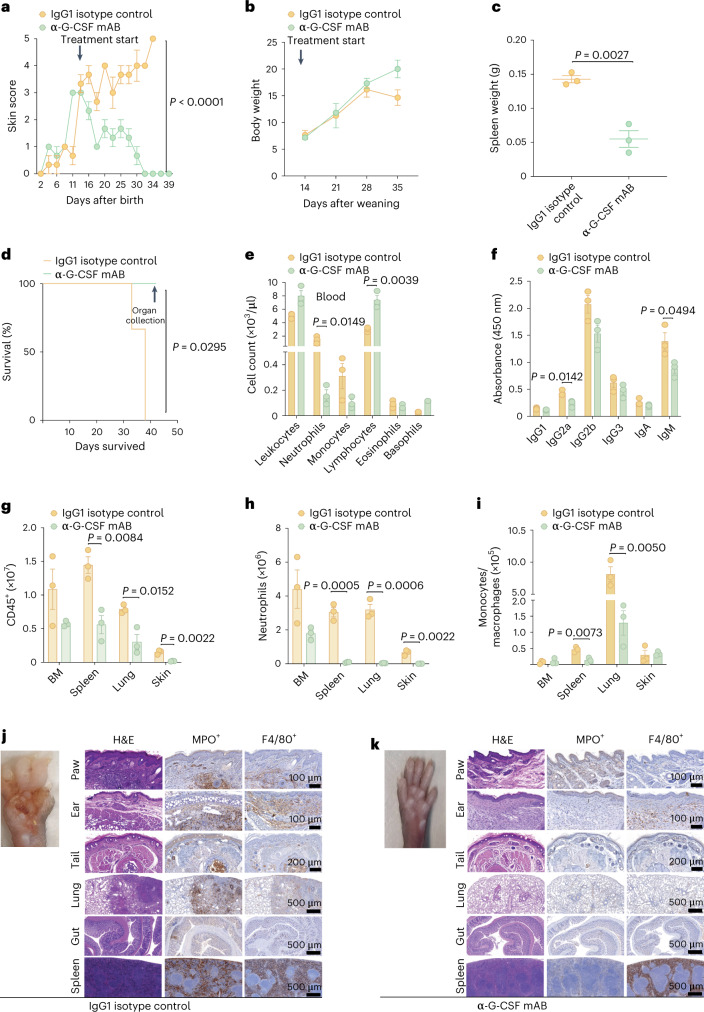
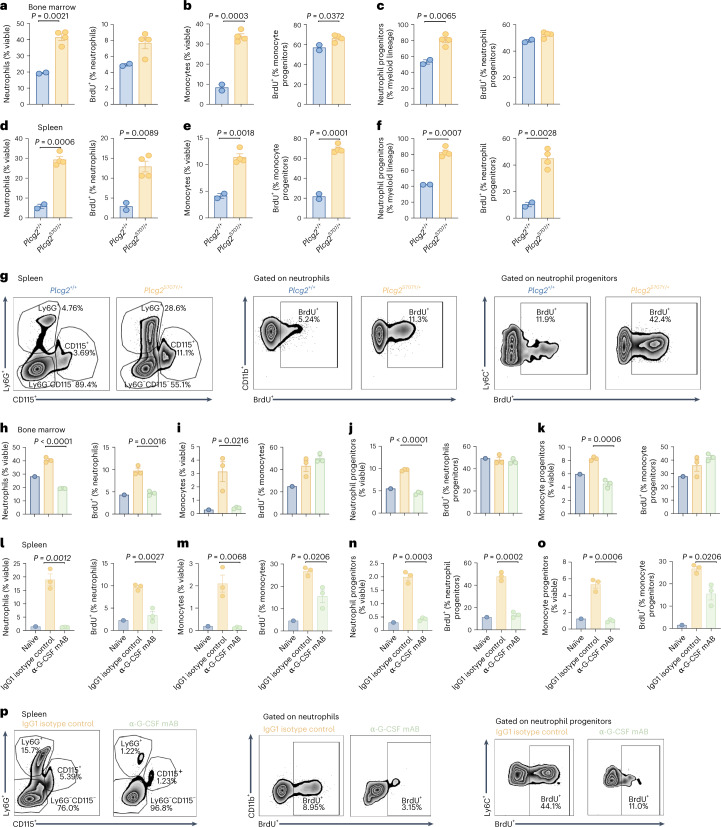
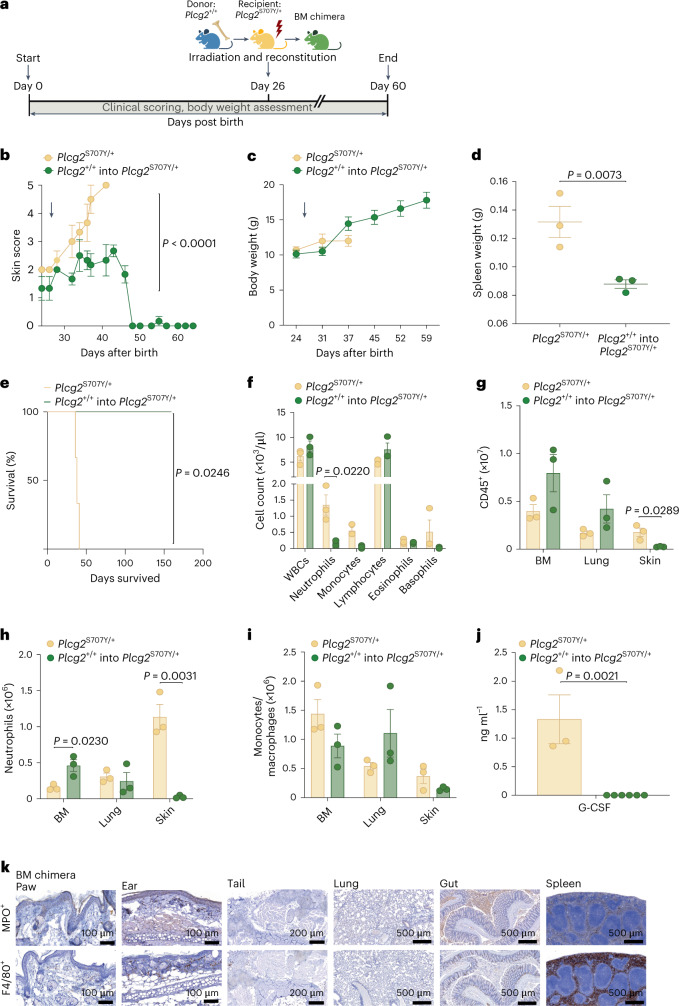
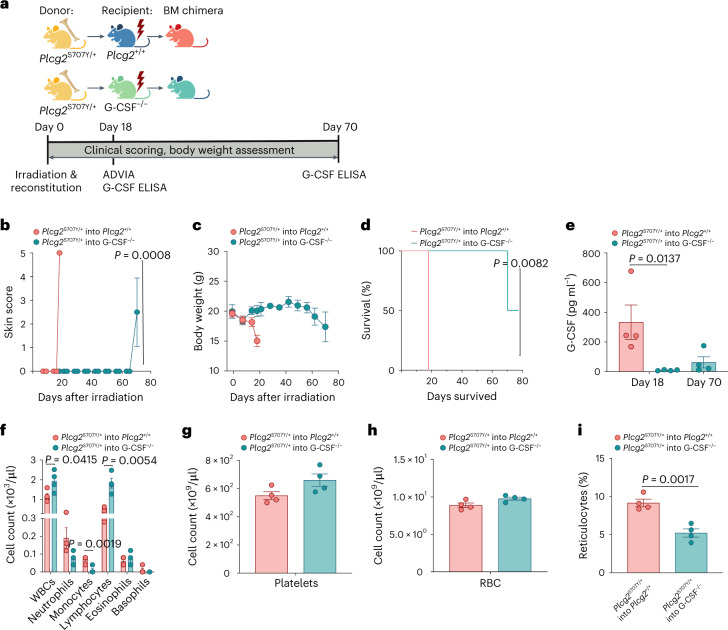
Missense mutations in PLCG2 can cause autoinflammation with phospholipase C gamma 2-associated antibody deficiency and immune dysregulation (APLAID). Here, we generated a mouse model carrying an APLAID mutation (p.Ser707Tyr) and found that inflammatory infiltrates in the skin and lungs were only partially ameliorated by removing inflammasome function via the deletion of caspase-1. Also, deleting interleukin-6 or tumor necrosis factor did not fully prevent APLAID mutant mice from autoinflammation. Overall, these findings are in accordance with the poor response individuals with APLAID have to treatments that block interleukin-1, JAK1/2 or tumor necrosis factor. Cytokine analysis revealed increased granulocyte colony-stimulating factor (G-CSF) levels as the most distinct feature in mice and individuals with APLAID. Remarkably, treatment with a G-CSF antibody completely reversed established disease in APLAID mice. Furthermore, excessive myelopoiesis was normalized and lymphocyte numbers rebounded. APLAID mice were also fully rescued by bone marrow transplantation from healthy donors, associated with reduced G-CSF production, predominantly from non-hematopoietic cells. In summary, we identify APLAID as a G-CSF-driven autoinflammatory disease, for which targeted therapy is feasible.


Conflict of interest statement

S.L.M. is a Scientific Advisor for Odyssey Therapeutics and NRG Therapeutics. S.-L.N. and J.N. are employees of GSK. I.P.W. has acted as a Scientific Advisor for CSL and received funding for research on G-CSF antagonism in inflammatory diseases. All other authors declare no competing interests.

Figures

Fig. 1
Fig. 1. Phenotype of mice encoding an APLAID mutation in Plcg2 (p.Ser707Tyr).
a, Scheme of Flp-excision at the Plcg2 recombined locus. Breeding was established with C57BL/6 Flp deleter mice to excise the Neomycin selection cassette and to generate heterozygous mice carrying the Neo-excised point knock-in mutation p.Ser707Tyr. b, Plcg2S707Y/+ mice displayed cutaneous lesions on paws, ears and tail. c, Severity of skin inflammation is reflected by an APLAID skin score of 2 on a 0–5 scale after weaning up to 24 d of age (Plcg2+/+, n = 19; Plcg2S707Y/+, n = 5; at 2–3 weeks of age). d, A growth curve exhibits stunted weight gain of Plcg2S707Y/+ mice (Plcg2+/+, n = 14; Plcg2S707Y/+, n = 9; at 2–4 weeks of age). e, Plcg2S707Y/+ mice (n = 5) showed splenomegaly compared to their Plcg2+/+ littermate controls (n = 7) at 6 weeks of age. f, Kaplan–Meier analysis demonstrated survival rates of 6 weeks in Plcg2S707Y/+ mice after weaning (Plcg2+/+, n = 5; Plcg2S707Y/+, n = 6; at 4–6 weeks of age). g, At 6 weeks of age, histopathological examination demonstrated myeloid immune cell infiltration in paws, ears, tails, lung, gut and spleen. One representative immunohistochemistry (IHC) section (MPO+ and F4/80+) from three independent experiments is shown. h, During disease onset, data obtained from ADVIA blood cell analyzer revealed an increase of neutrophils and a mild decrease in lymphocytes (Plcg2+/+, n = 7; Plcg2S707Y/+, n = 4; at 2 weeks of age). i,j, FACS analysis showed an increase of myeloid cell counts in the skin and lung at disease onset, while neutrophil numbers were reduced in the BM (n = 3 mice per genotype; at 2 weeks of age). k, During disease, peak neutrophil counts normalized in the blood as assessed by ADVIA analyzer (Plcg2+/+, n = 5; Plcg2S707Y/+, n = 6; at 6 weeks of age). l,m, FACS analysis of the skin and lung demonstrated increased numbers of myeloid cell numbers as APLAID progressed, while myeloid numbers in the BM remained unaltered (n = 3 mice per genotype; at 6 weeks of age). n,o, FACS analysis of lymphoid cells displayed normal T cells and reduced B cells (n = 3 mice per genotype; at 5 weeks of age). p, Quantification of immunoglobulin subtypes measured by ELISA revealed increased IgG2a levels of Plcg2S707Y/+ mice (n = 3; at 6 weeks of age) in comparison to Plcg2+/+ littermate controls (n = 8; at 6 weeks of age). Error bars represent the mean ± s.e.m. Statistical significance for skin score was determined by a two-way analysis of variance (ANOVA) with Bonferroni post-test correction. Statistical significance for the survival curve was determined by a Mantel–Cox test. Spleen weights, longitudinal weight data and cell numbers between two groups were determined by a two-sided unpaired Student’s t-test. Source data
Fig. 2
Fig. 2. Minimal rescue of APLAID due to deletion of IL-6, caspase-1 or TNF.
a, A clinical APLAID skin score demonstrates persistent but attenuated skin inflammation of different Plcg2S707Y/+ knockout mice after weaning (Plcg2+/+, n = 19; Plcg2S707Y/+, n = 4; Plcg2S707Y/+IL-6−/−, n = 26; Plcg2S707Y/+caspase-1−/−, n = 17; Plcg2S707Y/+TNF−/−, n = 20; at 2–3 weeks of age). b, A growth curve exhibiting stunted weight gain during weekly assessments among Plcg2S707Y/+ knockouts (Plcg2+/+, n = 4; Plcg2S707Y/+, n = 5; Plcg2S707Y/+IL-6−/−, n = 5; Plcg2S707Y/+caspase-1−/−, n = 3; Plcg2S707Y/+TNF−/−, n = 4; at 2–4 weeks of age). c, Kaplan–Meier survival curve showing Plcg2S707Y/+ knockout mice with an impaired survival rate in comparison to Plcg2+/+ littermate controls after weaning (Plcg2+/+, n = 10; Plcg2S707Y/+, n = 15; Plcg2S707Y/+IL-6−/−, n = 8; Plcg2S707Y/+caspase-1−/−, n = 10; Plcg2S707Y/+TNF−/−, n = 12; at 3–7 weeks of age). d, Immune cell infiltrates were present in paws, ears, tails, lung, gut and spleen across all different mouse strains. One representative IHC section (from three independent experiments per genotype; at 4 weeks of age) of CD45+, MPO+ and F4/80+ stains is shown. e, ADVIA analyzer data of the blood show variable neutrophil counts and a mild decrease of lymphocytes (Plcg2+/+, n = 15; Plcg2S707Y/+, n = 3; Plcg2S707Y/+IL-6−/−, n = 8; Plcg2S707Y/+caspase-1−/−, n = 7; Plcg2S707Y/+TNF−/−, n = 5; at 4–5 weeks of age). f, Quantification of immunoglobulin subtypes measured by ELISA reveals abnormal levels similar to Plcg2S707Y/+ mice (Plcg2+/+, n = 9; Plcg2S707Y/+, n = 5; Plcg2S707Y/+IL-6−/−, n = 5; Plcg2S707Y/+caspase-1−/−, n = 5; Plcg2S707Y/+TNF−/−, n = 5; at 4 weeks of age). g, Cytokine assessment by a multiplex assay in the plasma of Plcg2 mice and different knockout mice demonstrates a large increase in G-CSF followed by IL-12p40 and eotaxin (n = 11 mice per genotype; at 4–6 weeks of age). Heat map colors represent mean cytokine values. Error bars represent the mean ± s.e.m. Statistical significance for skin score was determined by a two-way ANOVA for repeated measurements with Bonferroni post-test correction. Statistical significance for longitudinal weight data between two groups was determined by a two-sided paired t-test. The survival curves were analyzed by a Mantel–Cox test. Cytokine levels were established by an ordinary two-way ANOVA, and Bonferroni post-test correction was used to adjust for multiple testing. Source data
Fig. 3
Fig. 3. High serum levels of G-CSF in participants with APLAID.
a, Cytokine assessment by a multiplex assay in sera of two APLAID participants showed a relative elevation in G-CSF followed by increased levels of IL-1ß, IL-12 and M-CSF compared to ten sex-matched and age-matched healthy controls (HCs). Color mapping of cytokine heat map represents mean values relative to control in pg ml−1. b, Protein schematic and participant mutations in PLCG2. c,d, Longitudinal cytokine and CRP pattern of two APLAID participants (n = 2; Pat. 1 p.Ala708Pro/male/13 years old; Pat. 2 p.Leu845Phe/848Pro/female/21 years old) under various treatment regimens revealed persistent elevation of G-CSF in participants’ sera. Dashed line represents the cutoff for abnormal CRP values. Error bars represent the mean ± s.e.m. Cytokine levels between two groups were determined by an unpaired two-sided Student’s t-test. ABx, antibiotics; CRP, C-reactive protein; GC, glucocorticoids; IVIG, intravenous immunoglobulins. Source data
Fig. 4
Fig. 4. Blocking G-CSF reverses established disease in Plcg2S707Y/+ mice.
a, Post-weaning in vivo blockage of G-CSF completely reversed established autoinflammation in Plcg2S707Y/+ mice, reflected by an APLAID skin score of 0 on a 0–5 scale after 4 weeks of treatment compared to Plcg2S707Y/+ mice injected with an appropriate IgG1 isotype control. b, Growth curve exhibiting a steady weight gain of Plcg2S707Y/+ mice following G-CSF blockage during weekly assessments. c, Plcg2S707Y/+ mice treated with anti-G-CSF lacked an enlargement of the spleen compared to Plcg2S707Y/+ mice receiving the isotype control. d, Kaplan–Meier analysis demonstrated exceeding survival rates of Plcg2S707Y/+ mice following G-CSF antagonism in comparison with Plcg2S707Y/+ mice treated with an IgG1 isotype control. e, ADVIA analyzer data of the blood revealed reduced neutrophil and increased lymphocyte counts in Plcg2S707Y/+ mice after G-CSF neutralization. f, Quantification of immunoglobulin subtypes measured by ELISA revealed decreased IgG2a and IgM levels (n = 3 mice per genotype) in Plcg2S707Y/+ mice following anti-G-CSF treatment or isotype control. gi, FACS analysis exhibited decreased numbers of total leukocytes and myeloid cells, particularly of neutrophils (Ly6G+CD11b+), across all organs including BM, spleen, skin and lung. j,k, Immune cell infiltrates were sparse in paws, ears, tails, lung, gut and spleen in anti-G-CSF-treated mice compared to isotype control. Representative IHC sections of HE, MPO+ and F4/80+ are shown. For all experiments, three mice per treatment group were used. All mice were 2 weeks old at the start of the experiment. Error bars represent the mean ± s.e.m. Statistical significance for skin score was determined by a two-way ANOVA. Statistical significance for longitudinal weight data was determined by a paired two-sided t-test. Spleen weights between two groups were determined by an unpaired two-sided Student’s t-test. Statistical significance for the survival curve was determined by a Mantel–Cox test. Cell numbers between two groups were determined by an unpaired two-sided Student’s t-test. mAB, monoclonal antibody. Source data
Fig. 5
Fig. 5. Anti-G-CSF treatment suppresses enhanced myelopoiesis in APLAID mice.
af, Plcg2S707Y/+ mice (n = 4 mice per group; yellow bar) had a marked increase in the proportion and numbers of neutrophils, monocytes and their progenitors as well as their proliferation rate in the BM and spleen compared to controls (n = 2 mice per group; blue bar). g, Representative FACS plots showing cell numbers and individual frequencies of BrdU+ cells. ho, Anti-G-CSF treatment (n = 3 mice per group; green bar) reduced myeloid counts and decreased proliferation (BrdU+ cells) in the BM and spleen relative to isotype control-treated APLAID mutant mice (n = 3 mice per group; yellow bar), and to a comparable level as that seen in Plcg2+/+ mice (n = 1 mouse, blue bar). p, Representative FACS plots showing individual cell numbers and frequencies of BrdU+ cells under anti-G-CSF treatment or isotype control. Error bars represent the mean ± s.e.m. All mice were 4–5 weeks of age. Cell numbers between two groups were determined by an unpaired two-sided Student’s t-test. Source data
Fig. 6
Fig. 6. Bone marrow transplantation normalizes G-CSF levels and rescues phenotype in Plcg2S707Y/+ mice.
a, Schematic of BM chimera generation (green). Plcg2+/+ (blue) is the donor for lethally irradiated Plcg2S707Y/+ recipients (yellow). Single-cell suspension of BM cells (1 × 106 per ml) were transplanted by i.v. injection into recipient animals 3 h after irradiation. b, APLAID skin score demonstrates a rescued autoinflammatory phenotype in BM chimeras (n = 6) receiving a healthy transplant compared to Plcg2S707Y/+ (n = 3). The arrow indicates the exact time of irradiation and reconstitution at 26 d after birth. c, Growth curve exhibiting a steady weight gain in BM chimeras (n = 6 mice) compared to controls (n = 3). d, BM chimeras lacked enlarged spleens (n = 3 per group). e, Kaplan–Meier survival curve of BM chimeras (n = 7) showing prolonged survival rates in comparison to Plcg2S707Y/+ mice (n = 3). f, ADVIA analyzer data of the blood revealed reduced neutrophil/monocyte and increased lymphocyte counts in Plcg2S707Y/+ mice after BM transplantation from a healthy donor (n = 3 mice per group). gi, FACS analysis exhibited decreased numbers of myeloid cells, particularly of neutrophils (Ly6G+CD11b+) in skin tissue (n = 3 mice per group). j, Quantification of plasma G-CSF measured by ELISA revealed normalized levels (Plcg2S707Y/+, n = 3; BM chimera, n = 6). k, Anatomic pathology was restored in BM chimeras with sparse immune cell infiltrates in paws, ears, tails, lung, gut and spleen. One representative IHC section (from three independent experiments) of MPO+ and F4/80+ stains is shown. BM chimeras were 3 weeks old at the time of irradiation and reconstitution. Error bars represent the mean ± s.e.m. Statistical significance for skin score was determined by a two-way ANOVA. Statistical significance for longitudinal weight data was determined by a paired two-sided t-test. Spleen weights between two groups were determined by an unpaired two-sided Student’s t-test. Statistical significance for the survival curve was determined by a Mantel–Cox test. Statistical significance for G-CSF levels and cell numbers between two groups were determined by an unpaired two-sided Student’s t-test. Source data
Fig. 7
Fig. 7. Delayed onset of APLAID phenotype in G-CSF-deficient mice.
a, Schematic of BM chimera generation. Plcg2S707Y/+ (yellow) is the donor for lethally irradiated WT (blue) or G-CSF−/− recipients (green). Single-cell suspension of BM cells (1 × 106/ml) were transplanted by i.v. injection into recipient animals 3 h after irradiation. b, APLAID skin score revealed an autoinflammatory phenotype in WT mice receiving a Plcg2S707Y/+ transplant at day 18, while G-CSF knockouts showed a beginning weight loss at day 70. c, Growth curve exhibiting dramatic weight loss in WT mice following irradiation and reconstitution with Plcg2S707Y/+ BM cells. d, Kaplan–Meier survival curve showing prolonged survival rates of 52 d in G-CSF−/− mice receiving Plcg2S707Y/+ BM cells. e, Quantification of plasma G-CSF measured by ELISA demonstrated elevated G-CSF levels in WT mice receiving Plcg2S707Y/+ BM cells at day 18 and increasing G-CSF levels at the onset of clinical signs in G-CSF−/− mice receiving Plcg2S707Y/+ BM cells at day 70. fi, ADVIA analyzer data of the blood at day 18 revealed increased neutrophil/monocyte and reduced lymphocyte counts in WT mice after BM transplantation from Plcg2S707Y/+ mice, while thrombopoiesis and erythropoiesis remained unaltered except for reticulocytes. For all experiments, four mice aged 11 weeks per group were used. Error bars represent the mean ± s.d. in c and the mean ± s.e.m. for the remaining figures. Statistical significance for skin score was determined by a two-way ANOVA and by a paired two-sided t-test for longitudinal weight data. For survival data, statistical significance was determined by a Mantel–Cox test. G-CSF levels and cell numbers between two groups were determined by an unpaired two-sided Student’s t-test. RBC, red blood cell; WBC, white blood cell. Source data
Extended Data Fig. 1
Extended Data Fig. 1. Further validation of PLCγ2S707Y/+ mice.
a) Total bone mass of 3-week-old, male PLCγ2S707Y/+ mutants compared to littermate controls (n = 3 mice per group). b) Whilst increased numbers of CD45+ across all organs are present, lymphoid immune cell infiltrates are sparse in paws, ears, tails, lung, gut, spleen. One representative IHC section (from three independent experiments; at 6 weeks of age) of CD45+, CD3+Ki67, B220+ stains is shown. c) PLCγ2+/+ littermate controls lack immune cells infiltrates. One representative IHC section (from three independent experiments; at 6 weeks of age) of H&E, CD45+, MPO+, F4/80+, CD3+Ki67, B220+ is shown. d) Neutrophils (MPO+ in magenta) reside predominantly in the tissue rather than in the blood endothelial vessels (CD31+ with DAB) of 4-week-old PLCγ2S707Y/+ mice as demonstrated by dual IHC (one representative from three independent experiments). e-g) ADVIA analyzer data of the blood reveal no difference with regards to platelets, red blood cells and reticulocytes in PLCγ2S707Y/+ mutants compared to littermate controls (PLCγ2+/+: n = 5; PLCγ2S707Y/+: n = 6). Error bars represent mean ± SEM. Source data
Extended Data Fig. 2
Extended Data Fig. 2. Phenotype of PLCγ2S707Y/+IL-6−/, PLCγ2S707Y/+TNF−/− and PLCγ2S707Y/+caspase-1−/−.
a) While increased immune cell infiltrations are present across all organs, knock-out mice lack lymphoid immune cell infiltrates in skin and lung. One representative IHC section (from three independent experiments) H&E, CD3+Ki67, B220+ is shown. b-d) ADVIA analyzer data of the blood reveal no major differences with regards to platelets, red blood cells and reticulocytes in PLCg2S707Y/+ knock-out strains (PLCγ2+/+: n = 32; PLCγ2S707Y/+: n = 9; PLCγ2S707Y/+IL-6−/−: n = 8; PLCγ2S707Y/+caspase-1−/−: n = 7; PLCγ2S707Y/+TNF−/−: n = 5; at 6 weeks of age). e) Quantification of M-CSF measured by ELISA were neither elevated in the supernatant of BMDMs nor in the plasma of PLCγ2S707Y/+ mice (n = 3 mice per group; at 4 weeks of age). Error bars represent mean ± SEM.f-g) Cytokine assessment by a multiplex assay in tissue lysates from skin and lung reveal increased G-CSF levels followed by MIP-1α and MIP-1β only in PLCγ2S707Y/+mice (n = 1) and not in PLCγ2+/+(n = 1) PLCγ2S707Y/+IL-6−/− (n = 3), PLCγ2S707Y/+caspase-1−/− and PLCγ2S707Y/+TNF−/− (n = 3) mice (n = 2) (at 5-6 weeks of age). Heatmap colours represent mean cytokine values. h) Enrichment of gene sets are shown as barcode plots drawn by Limma’s barcode plot function. Data are derived from 2 independent experiments with 4 (n = 5) and 6-week-old (n = 6) PLCγ2S707Y/+mice and age-, number- and sex-matched littermate controls.
Extended Data Fig. 3
Extended Data Fig. 3. G-CSF is not specific for APLAID.
Cytokine assessment by a multiplex assay in other autoinflammatory diseases including cryopyrin-associated periodic syndromes (CAPS) (n = 1/female/15-year-old), familial mediterranean fever (FMF) (n = 6/3females/3males/10-,45-,19-,19-.49-years-old), hyper-IgD with periodic fever syndrome (HIDS; n = 2/1female/1male/both 6-year-old), deficiency of adenosin deaminase-2 (DADA2) (n = 2/2 males/15 and 18-years-old) showed increased G-CSF levels relative to age- and sex-matched healthy control levels (n = 10). a) Colour mapping of cytokine heatmap represents mean values relative to control in pg/ml. b-k) Individual cytokine levels of all HC and patients with various autoinflammatory diseases are shown. The limit of detection (LOD) for each cytokine is indicated by a dotted line in each graph. Error bars represent mean ± SEM.Cytokine levels between two groups were determined by an unpaired two-sided Student’s t-test. Source data
Extended Data Fig. 4
Extended Data Fig. 4. G-CSF blockade does not impact lympho-, erythro- and thrombopoiesis.
a) Anti-G-CSF treatment scheme in PLCγ2S707Y/+ mice. b) Lymphocyte numbers also replenished in BM but not in spleen after anti-G-CSF treatment. c-d) ADVIA analyzer data of the blood reveal a decrease with regards to platelets and reticulocytes in PLCγ2S707Y/+ mice following anti-G-CSF treatment whilst red blood cells remain unaltered (n = 3 mice per genotype). All mice were 2 weeks old at the start of the experiment. Error bars represent mean ± SEM. Source data
Extended Data Fig. 5
Extended Data Fig. 5. Skin, lung, and blood are not the primary sites of myelopoiesis in APLAID.
a-f) The myelopoiesis of progenitor and mature neutrophils and monocytes is not taking place in skin, lung and blood (PLCγ2+/+: n = 2; PLCγ2S707Y/+: n = 4). g) Representative FACS plots showing gating strategy used to identify BrdU+ neutrophils and monocytes during different maturation stages in BM of a PLCγ2S707Y/+ mouse. All mice were 4-5 weeks of age. Error bars represent mean ± SEM. Two to four mice were used per genotype. Cell numbers between two groups were determined by an unpaired two-sided Student’s t-test. Source data
Extended Data Fig. 6
Extended Data Fig. 6. Haematopoietic progenitor abnormalities in APLAID indicated by a colony assays.
Type and numbers of colonies from 25,000 unfractionated BM cells and 50,000 splenocytes cultured in G-SCF (103 U/mL), GM-CSF (103 U/mL), SIE [SCF, (100 ng/mL), IL-3 (10 ng/mL), EPO (2 U/mL)] were scored after 7 days. Animals were 4 weeks old at time of irradiation and reconstitution. Error bars represent mean ± SEM. Statistical significance for total colonies was determined by an unpaired two-sided Student’s t-test between groups (n = 3 mice per genotype). Source data
Extended Data Fig. 7
Extended Data Fig. 7. The radioresistant compartment is dispensable for autoinflammation in APLAID.
a) RT-qPCR in FACS sorted immune cells from skin (left) and non-immune cells (right) from lung tissue in PLCγ2S707Y/+ compared to PLCγ2+/+ controls reveals elevated G-CSF transcripts in both skin myeloid cells (monocytes, macrophages, Langerhans Cells) and fibroblasts. Two independent experiments from 4 different mice per genotype are shown. Animals were 4–6 weeks old. b) Scheme of BM chimera generation (in dark yellow). PLCγ2S707/+ (in yellow) are the donor for lethally irradiated PLCγ2S707Y/+ recipients (yellow). Single cell suspension of BM cells (1 × 10⁶/mL) are transplanted by i.v. injection into recipient animals 3 hrs after irradiation. c) Severity of skin inflammation is determined by the APLAID skin score on a 0–5 scale post weaning (n = 3 mice per group). d) A growth curve exhibits a continuous weight loss in PLCγ2S707Y/+ into PLCγ2S707Y/+ chimeras (n = 3 mice per group). e) Splenomegaly persists in the PLCγ2S707Y/+ into PLCγ2S707Y/+ chimera (n = 3 mice per group). f) Kaplan-Meier analysis demonstrate decreased survival rates in PLCγ2S707Y/+ into PLCγ2S707Y/+ chimera (n = 3 mice per group). g-j) ADVIA analyzer data of the blood reveal increased neutrophil and decreased lymphocyte counts in PLCγ2S707Y/+ receiving BM from PLCγ2S707Y/+ mice, whilst thrombo- and erythropoiesis remain unaltered (n = 3 mice per group). k) Proportion between circulating CD45.1+ immune cells from the WT donor (6–8 weeks of age) and CD45.2+ radioresistant immune cells from the recipient (4 weeks of age) 7 weeks post-transplantation (n = 3 mice per group). PLCγ2S707Y/+ mice were 4-week-old. Error bars represent mean ± SEM. Statistical significance for skin score was determined by a two-way ANOVA. Statistical significance for longitudinal weight data was determined by a paired two-sided t-test. Spleen weights between two groups were determined by an unpaired two-sided Student’s t-test. Statistical significance for the survival curve was determined by a Mantel-Cox test. G-CSF levels and cell numbers between two groups were assessed by an unpaired two-sided Student’s t-test. Source data
Extended Data Fig. 8
Extended Data Fig. 8. Proposed model of APLAID.
a) Cytokine assessment by a multiplex assay in plasma samples reveal increasing G-CSF levels following irradiation and reconstitution in PLCγ2+/+ compared to G-CSF−/− chimera (both groups at 11 weeks of age) receiving BM from PLCg2S707Y/+ mice (n = 3 mice per group). b) Schematic illustration shows crosstalk between haematopoietic and non-haematopoietic cells in APLAID. Adapted from ‘Basophil-Mediated Skin Inflammation’, by BioRender.com (2023). Retrieved from https://app.biorender.com/biorender-templates.

Comment in

References

    1. Zhou, Q. et al. A hypermorphic missense mutation in PLCG2, encoding phospholipase Cγ2, causes a dominantly inherited autoinflammatory disease with immunodeficiency. Am. J. Hum. Genet.91, 713–720 (2012). - PMC - PubMed
    1. Neves, J. F. et al. Novel PLCG2 mutation in a patient with APLAID and cutis laxa. Front. Immunol.9, 2863 (2018). - PMC - PubMed
    1. Novice, T. et al. A germline mutation in the C2 domain of PLCγ2-associated with gain-of-function expands the phenotype for PLCG2-related diseases. J. Clin. Immunol.40, 267–276 (2020). - PMC - PubMed
    1. Moran-Villasenor, E. et al. Expanding the clinical features of autoinflammation and phospholipase Cγ2-associated antibody deficiency and immune dysregulation by description of a novel patient. J. Eur. Acad. Dermatol. Venereol.33, 2334–2339 (2019). - PubMed
    1. Martin-Nalda, A. et al. Severe autoinflammatory manifestations and antibody deficiency due to novel hypermorphic PLCG2 mutations. J. Clin. Immunol.40, 987–1000 (2020). - PMC - PubMed

Publication types

MeSH terms