. 2023 Apr;9(4):661-672.
doi: 10.1038/s41477-023-01377-1. Epub 2023 Mar 30.

Low-temperature and circadian signals are integrated by the sigma factor SIG5

Affiliations

Low-temperature and circadian signals are integrated by the sigma factor SIG5

Dora L Cano-Ramirez et al. Nat Plants. 2023 Apr.

Abstract

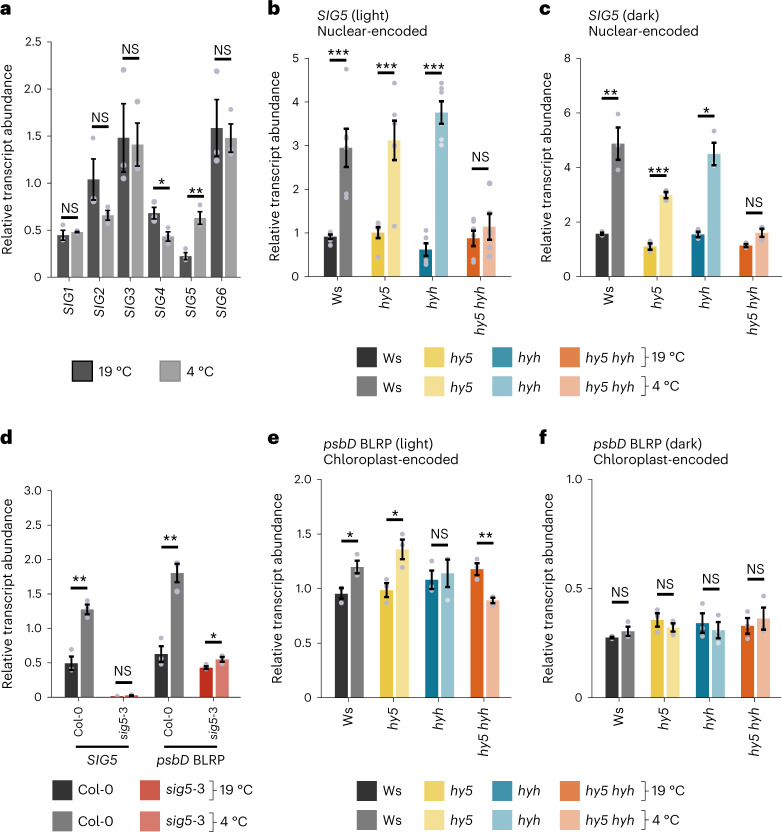
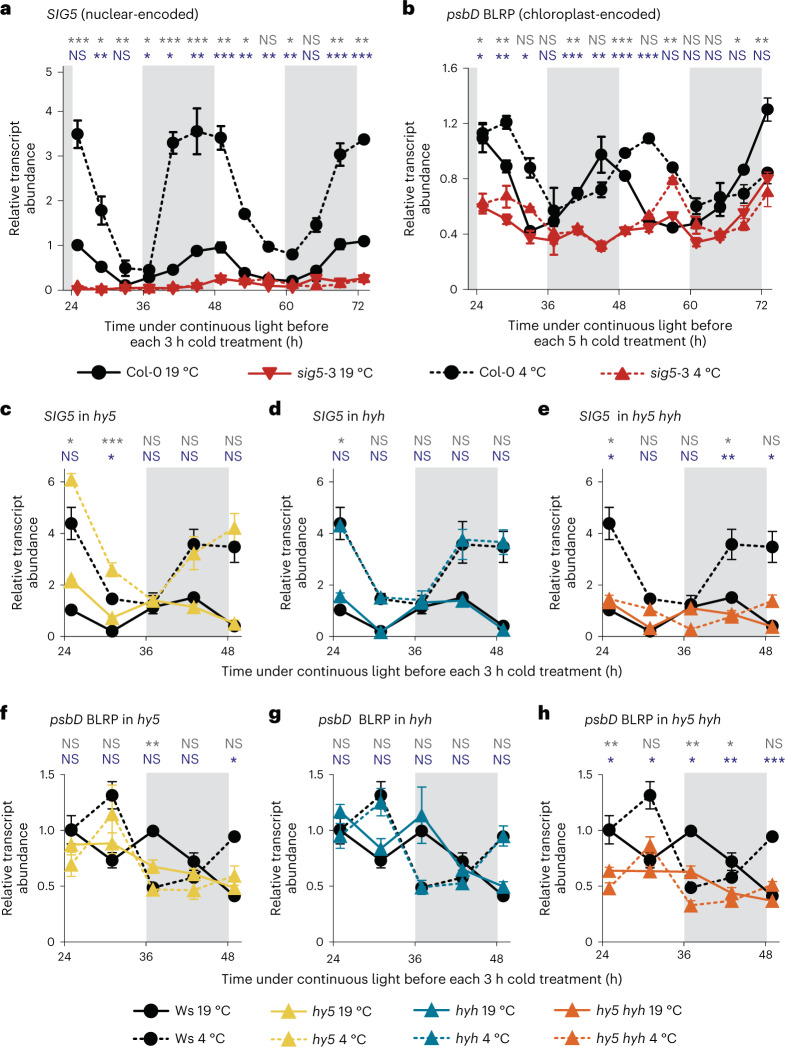
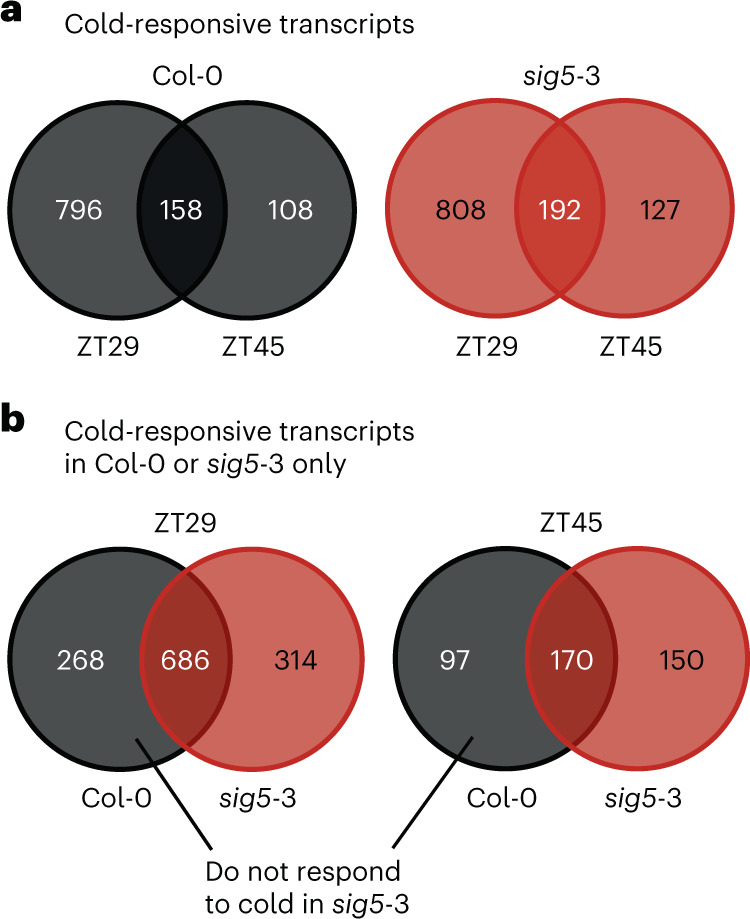
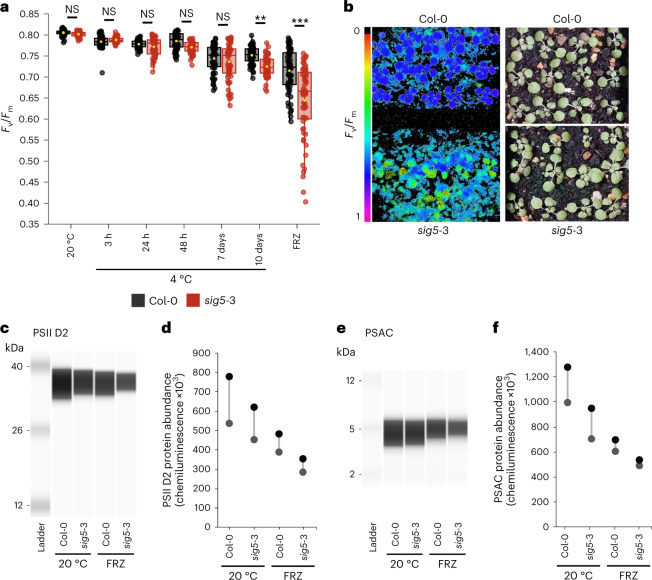
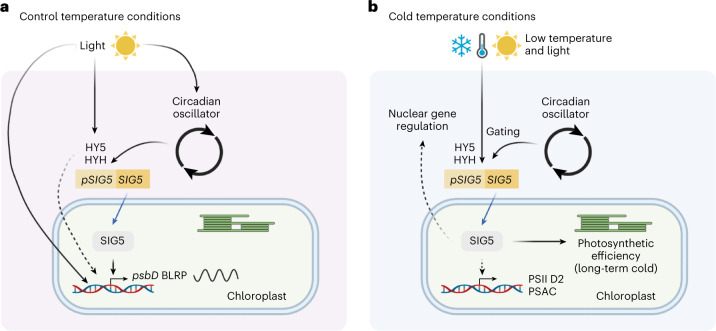
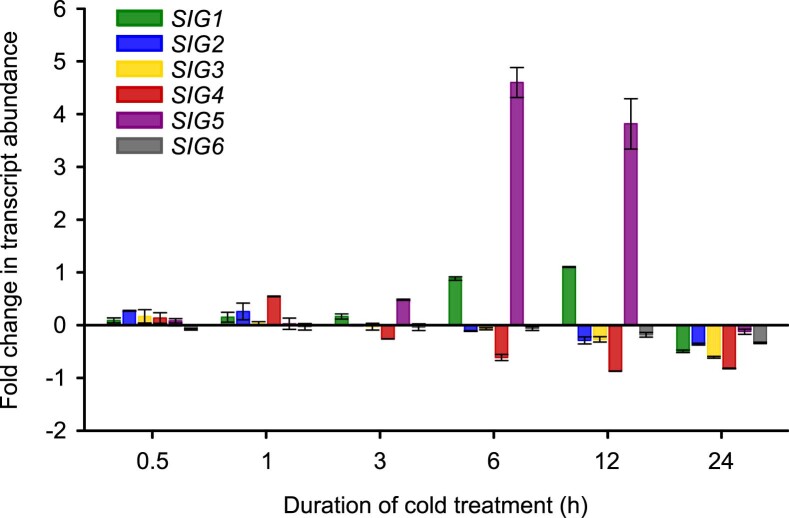
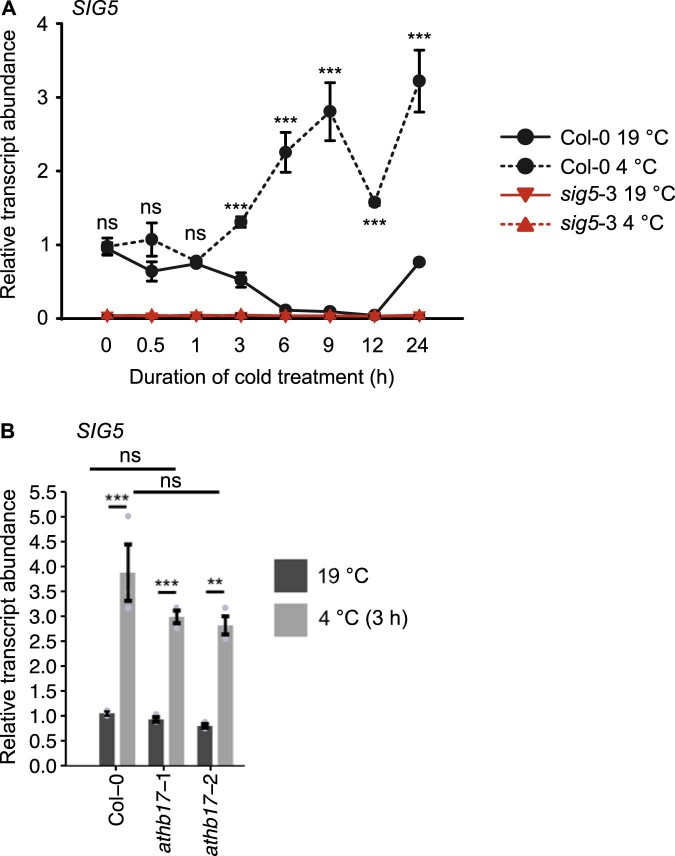
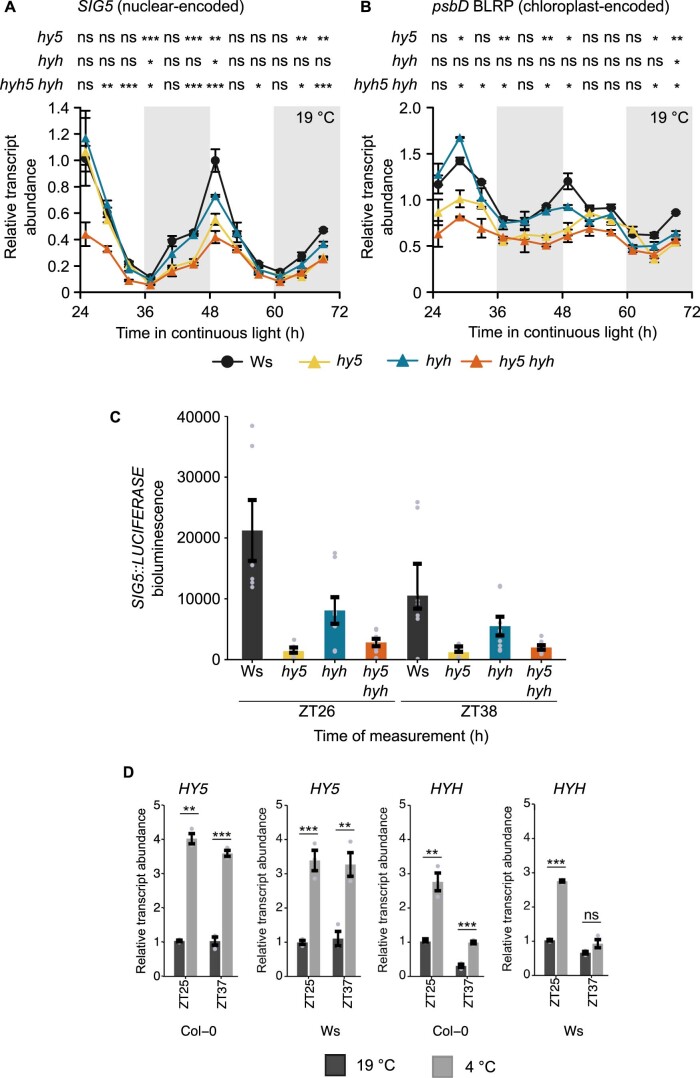
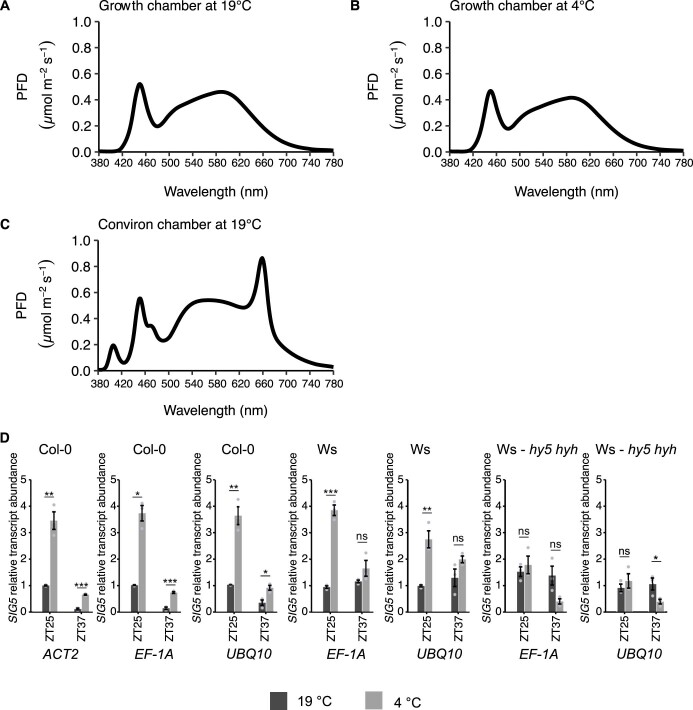
Chloroplasts are a common feature of plant cells and aspects of their metabolism, including photosynthesis, are influenced by low-temperature conditions. Chloroplasts contain a small circular genome that encodes essential components of the photosynthetic apparatus and chloroplast transcription/translation machinery. Here, we show that in Arabidopsis, a nuclear-encoded sigma factor that controls chloroplast transcription (SIGMA FACTOR5) contributes to adaptation to low-temperature conditions. This process involves the regulation of SIGMA FACTOR5 expression in response to cold by the bZIP transcription factors ELONGATED HYPOCOTYL5 and ELONGATED HYPOCOTYL5 HOMOLOG. The response of this pathway to cold is gated by the circadian clock, and it enhances photosynthetic efficiency during long-term cold and freezing exposure. We identify a process that integrates low-temperature and circadian signals, and modulates the response of chloroplasts to low-temperature conditions.


Conflict of interest statement

The authors declare no competing interests.

Figures

Fig. 1
Fig. 1. SIG5 communicates information to chloroplasts about cold temperature conditions, and this requires HY5 and HYH.
a, Relative abundance of all six Arabidopsis sigma factor transcripts in wild type (Col-0) after 3 h at 19 or 4 °C. b,c, SIG5 transcript accumulation in wild type (Ws), hy5, hyh and hy5 hyh double mutant after 3 h at 4 °C in light (b) and darkness (c). d, Abundance of SIG5 and chloroplast psbD BLRP transcripts in Col-0 and sig5-3 mutant after 3 h (SIG5) and 5 h (psbD BLRP) at 4 °C. e,f, psbD BLRP transcript accumulation in Ws, hy5, hyh and hy5 hyh double mutant after 5 h at 4 °C in light (e) and darkness (f). Darker and paler bars indicate control (19 °C) and cold (4 °C) treatments, respectively. Experiments used 11-day-old seedlings. SIG5 and psbD BLRP transcript abundance was measured after 3 and 5 h of cold treatment, respectively, because there is a time delay between the accumulation of SIG5 transcripts and downstream psbD BLRP,. Data represent mean ± s.e.m. and n = 3, except in b where n = 6. Statistical significance represents cold treatments compared with control temperature conditions (two-sided t-tests). ***P < 0.001; **P < 0.01; *P < 0.05; NS, not significant. Exact P values are given in Supplementary Data 1.
Fig. 2
Fig. 2. Circadian gating of the responses to cold of SIG5 and chloroplast psbD BLRP, and the involvement of HY5 and HYH.
a,b, Circadian gating of the response to cold of SIG5 (a) and psbD BLRP (b) transcripts in the Col-0 wild type and sig5-3 mutant. cf, Circadian gating of the response to cold of SIG5 (ce) and psbD BLRP (fh) in the hy5, hyh or hy5 hyh double mutant. Cold treatments comprised 3 h at 4 °C for SIG5 transcript levels, and 5 h at 4 °C for psbD BLRP. Each short cold treatment was applied to a separate batch of seedlings. The x axis indicates the time at which the cold treatment commenced. Grey shading on graphs indicates subjective night, under constant light conditions. Solid and broken lines indicate control (19 °C) and cold (4 °C) treatments, respectively. Wild-type data (black lines) are duplicated across ce and fh for visual clarity. Experiments used 11-day-old seedlings. Data represent mean ± s.e.m. of three independent biological replicates. Statistical information above graphs compares the transcript levels in the wild type and mutant under control temperature conditions (grey text) and in response to cold (blue text) at each time point. ***P < 0.001; **P < 0.01; *P < 0.05; NS, not significant in unpaired two-sided t-tests. Exact P values are given in Supplementary Data 1.
Fig. 3
Fig. 3. Genome-wide influence of SIG5 upon the cold-responsive transcriptome.
a, Overlap between transcripts responsive to cold in Col-0 or sig5-3 at time points ZT29 and ZT45. b, Overlap between transcripts responsive to cold in Col-0 and sig5-3 at the two time points. Numbers within the circles on Venn diagrams indicate the number of transcripts. Experiments used 11-day-old seedlings and 3 h (ZT45) or 5 h (ZT29) cold (4 °C) treatments. ZT refers to the time elapsed under free-running (constant) conditions, after the final dawn.
Fig. 4
Fig. 4. SIG5 influences photosynthetic efficiency under cold temperature conditions.
a, Photosynthetic efficiency of PSII (Fv/Fm) of 14-day-old wild-type (Col-0) and sig5-3 plants exposed to cold (4 °C) and freezing (FRZ) treatments (n = 60). In box plots, the box indicates the interquartile zone with the median line at the centre, whiskers indicate interquartile range and a yellow dot indicates the mean. Data were analysed by two-way analysis of variance followed by post-hoc Tukey test. ***P < 0.001; **P < 0.01; NS, not significant (P values: 20 °C = 0.999; 3 h = 0.999; 24 h = 0.999; 48 h = 0.474; 7 days = 0.994; 10 days = 0.001; FRZ < 0.001). b, Fv/Fm of Col-0 and sig5-3 seedlings after freezing at −8 °C for 6 h (left) and representative image of these plants before freezing (right). cf, Automated semiquantitative capillary immunoassay comparing PSII D2 (c,d) and PSAC protein (e,f) levels between wild type (Col-0) and sig5-3 under control temperature conditions (20 °C) and after freezing at −8 °C for 6 h (FRZ). Samples were analysed in triplicate (three technical replicates) from each independent experiment, with (d,f) two independent experiments shown. d,f, Quantification of PSII D2 (d) and PSAC protein (f) levels (area under each peak), relative to levels in wild type (Col-0) at 20 °C from replicate immunoassays. Circles on plots indicate result from each independent experiment. Cold (4 °C) and freezing treatments (FRZ) were conducted identically for all experiments and included a 10-day cold acclimation period at 4 °C before the freezing treatment.
Fig. 5
Fig. 5. Involvement of SIG5 in cold-temperature responses.
a, Under control temperature conditions, light regulates the circadian clock and also HY5 and HYH-regulated genes. HY5 and HYH are necessary for the circadian regulation of SIG5 transcript accumulation, and circadian clock components might also regulate SIG5 expression directly. SIG5 regulates transcription of psbD via the BLRP, and HY5 or HYH might regulate psbD BLRP transcription through additional mechanisms. b, In response to cold temperatures, HY5 and HYH are necessary for the accumulation of SIG5 transcripts in response to cold, and the circadian clock gates the response to cold of SIG5 transcripts. SIG5 regulates PSII D2 and PSAC protein abundance, either by direct transcriptional regulation or through indirect mechanisms. SIG5 is necessary to maintain photosynthetic efficiency under long-term cold. SIG5 mutants have altered nuclear gene expression in response to cold, suggesting that SIG5 indirectly regulates nuclear genome transcription. Black solid arrows indicate regulatory relationships, broken arrows indicate inferred connections, a blue arrow entering the chloroplast indicates SIG5 targeting to chloroplasts and the sine wave icon indicates circadian regulation. Subcellular localization is inferred.
Extended Data Fig. 1
Extended Data Fig. 1. Transcriptome data identifies SIG5 transcript accumulation in response to cold.
Transcriptome data identifies SIG5 transcript accumulation in response to cold. Data indicate the fold-change in abundance of all six Arabidopsis sigma factors (SIG1-6) during a prolonged cold treatment, measured using microarray analysis in. Data extracted using the Arabidopsis eFP Browser (https://bar.utoronto.ca). Data are means from two biological replicates + /- s.d., as described in.
Extended Data Fig. 2
Extended Data Fig. 2. SIG5 transcript accumulation during cold treatments of up to 24 h.
SIG5 transcript accumulation during cold treatments of up to 24 h. (A) Relative abundance of SIG5 transcripts in Col-0 wild type and sig5-3 plants after cold treatment (4 °C) for durations ranging from 30 mins to 24 hours. (B) Abundance of SIG5 transcripts in wild type (Col-0) and two athb17 mutants after 3 h at 19 °C or 4 °C. Plants were under constant light conditions and given a 3 h cold treatment 1 h after subjective dawn. Experiments used 11-day old seedlings. Data are mean + /- s.e.m. (n = 3 independent biological replicates). Statistical comparisons are of (A) transcript abundance between Col-0 19 °C and Col-0 4 °C and (B) transcript abundance between control temperature and cold-treated plants, and between genotypes. Data analysed by (A) one-way ANOVA and (B) two-way ANOVA, both followed by one-sided post-hoc Tukey test, where *** = p < 0.001; ** = p < 0.01, * = p < 0.05 and n.s = not significant. p-values (A) 19 °C vs 4 °C for Col-0 at 0 h (p = 1.0000), 0.5 h (p = 0.9277), 1 h (p = 1.0000), 3 h (p = 0.1867), 6 h (p < 0.0001), 9 h (p < 0.0001), 12 h (p = 0.0001), 24 h (p < 0.0001); (B) 19 °C vs 4 °C for Col-0 (p = 0.0000425), athb17-1 (p = 0.0008523); athb17-2 (p = 0.0010056); Col-0 vs athb17-1 at 4 °C (p = 0.1958629); Col-0 vs athb17-2 at 4 °C (p = 0.0918899).
Extended Data Fig. 3
Extended Data Fig. 3. Accumulation of SIG5 and psbD BLRP transcripts in the wild type (Ws), hy5, hyh and hy5 hyh double mutant.
Accumulation of (A) SIG5 and (B) psbD BLRP transcripts in the wild type (Ws), hy5, hyh and hy5 hyh double mutant. Experiments used 11-day old seedlings. All data represent means + /- s.e.m. of three independent biological replicates. Statistical comparison of each mutant with the wild type, at each timepoint, is provided above time-series plots, where *** = p < 0.001; ** = p < 0.01, * = p < 0.05 and n.s = not significant (one-way ANOVA followed by one-sided post-hoc Tukey test; 3 biological replicates; p values for panels A and B in Supplementary Data 1). (C) Quantification of luciferase bioluminescence after transient expression of SIG5::LUCIFERASE in wild type, hy5, hyh and hy5 hyh mutants, at two timepoints, using particle bombardment (n = 8 replicates per condition and genotype, except for Ws at ZT26 where n = 6; mean + /- s.e.m.). (D) Response of HY5 and HYH transcripts to a treatment of 3 h at 4 °C, given at two different timepoints, under free running conditions. Transcript levels normalized to ACT2 and confirmed with two other reference transcripts (not shown), 3 biological replicates show as mean + /- s.e.m; *** = p < 0.001; ** = p < 0.01, * = p < 0.05 and n.s = not significant in unpaired two-sided t-tests. p values for (D) are Col-0 HY5 (ZT25 0.002; ZT37 0.000), Ws HY5 (ZT25 0.001; ZT37 0.006), Col-0 HYH (ZT25 0.003; ZT37 0.000), Ws HYH (ZT25 0.000; ZT37 0.098).
Extended Data Fig. 4
Extended Data Fig. 4. RNA sequencing analysis of transcripts in Col-0 wild type and sig5-3 that respond to a cold treatment at two different times of day.
RNA sequencing analysis of transcripts in Col-0 wild type and sig5-3 that respond to a cold treatment at two different times of day. (A) Overlap between cold-responsive transcripts in Col-0 from this study and cold-responsive transcriptome from. (B) Overlap between cold-responsive transcripts in Col-0 or sig5-3 from this study and circadian-regulated transcripts from and. (C) Overlap between cold-responsive transcripts in Col-0 or sig5-3 from this study and putative HY5 targets. (D) Overlap between cold-responsive transcripts in Col-0 or sig5-3 from this study and transcripts regulated in response to cold by HY5. Statistical significance and representation factors were calculated using a hypergeometric test (one-sided; see methods). Experiments used 11-day old seedlings.
Extended Data Fig. 5
Extended Data Fig. 5. Altered photosystem protein abundance in sig5-3 mutant.
Altered photosystem protein abundance in sig5-3 mutant. (A, B) Automated semi-quantitative immunoassay comparing (A) PSII D2 and (B) PSAC protein abundance between wild type (Col-0) and sig5-3 under control temperature conditions (20 °C) and after freezing at -8 °C for 6 h (FRZ). Analysis shows two independent experiments, each containing triplicate immunodetection analyses. (C) Coomassie blue-stained SDS-PAGE separation of 0.5 mg/mL total protein from leaf protein extracts, run as a single example to demonstrate consistent protein input into the automated semi-quantitative immunoassay when samples were prepared identically for immunodetection.
Extended Data Fig. 6
Extended Data Fig. 6. RbcL protein abundance is unaltered by sig5-3 mutant and freezing.
RbcL protein abundance is unaltered by sig5-3 mutant and freezing. (A) Automated semi-quantitative immunoassay comparing RbcL protein abundance between wild type (Col-0) and sig5-3 under control temperature conditions (20 °C) and after freezing at -8 °C for 6 h (FRZ). Analysis shows two independent experiments, each containing triplicate immunodetection analyses. (B) Comparison of RbcL protein abundance from (A, B). Circles on plots indicate result from each independent experiment (two independent repeats, each with three technical replicates). (C, D) Ratio of (C) mean PSII D2 abundance and (D) mean PSAC abundance to mean RbcL abundance, calculated from the protein abundance data in Fig. 4D, F and Extended Data Fig. 6B.
Extended Data Fig. 7
Extended Data Fig. 7. Responses to low and freezing temperature conditions in the sig5-3 mutant.
Responses to low and freezing temperature conditions in the sig5-3 mutant. (A) Abundance of SIG5 and psbD BLRP transcripts in the wild type (Col-0) and sig5-3 mutant after 10 days at 4 °C and after exposure to freezing (FRZ) conditions. Conditions were comparable to those shown in Fig. 4A and C (n = 3 independent repeats, mean + /- s.e.m.). (B) Photosynthetic efficiency of PSII (Fv/Fm) of 14-day old wild type (Ws) and hy5 hyh plants exposed to cold and freezing (FRZ) treatments (n = 60). (C) Survival of Col-0 wild type and sig5-3 plants grown for 14 days at 20 °C then acclimated at 4 °C for 10 days. Plants were subjected to -8 °C for 6 h and then allowed to recover at 20 °C for 7 days (n = 6; data analysed by Student’s t-test; two-sided; not significant; mean + /- s.e.m.). (D) Representative appearance of Col-0 and sig5-3 plants after 7 days of recovery at 20 °C after the freezing treatment, showing variation across three replicate pots per genotype. (E, F) Electrolyte leakage after freezing of leaf discs from plants of wild type (Col-0) and sig5-3. Plants were tested after 5 weeks of growth (E, not acclimated) or 5 weeks of growth plus 2 weeks of acclimation at 4 °C (F, cold acclimated). n = 15. (G) Photosynthetic efficiency of PSII (Fv/Fm) of 5-week-old Col-0 and sig5-3 plants after treatment at 19 °C or 4 °C for 3, 6, 24 hours, 7 and 14 days (n = 24, mean + /- s.e.m; p-values of Col-0 vs sig5-3 are p = 1.0000 (19 °C), p = 0.9999 (3 h), p = 0.9999 (6 h), p = 1.0000 (24 h), p = 0.7955 (7 days), p = 0.0011 (14 days)). (A, B, E-G) Data analysed by two-way ANOVA followed by post-hoc one-sided Tukey test, with (E, F) arcsine correction before analysis. *** = p < 0.001; ** = p < 0.01, * = p < 0.05 and n.s = not significant. On boxplots (B, E-G), box indicates interquartile zone with median line at the centre, whiskers indicate interquartile range, and yellow dot indicates the mean.
Extended Data Fig. 8
Extended Data Fig. 8. Light spectra and RT-qPCR controls.
Light spectra and RT-qPCR controls. (A, B) Comparison of spectra in Panasonic MLR-352 growth chambers set to (A) control and (B) cold temperature conditions. (C) Spectrum of Conviron growth chambers used to propagate mature plants. (D) Comparison of response of SIG5 to cold, at two different timepoints, in two background lines, and in the hy5 hyh double mutant. The transcript dynamics are broadly similar when each of ACT2, EF-1A and UBQ10 was used as a reference gene. *** = p < 0.001; ** = p < 0.01, * = p < 0.05 and n.s = not significant in unpaired two-sided t-tests, n = 3 biological replicates shown as mean + /- s.e.m. p values: Col-0 ACT2 (ZT25 0.002; ZT37 0.000), Col-0 EF-1A (ZT25 0.011; ZT37 0.000), Col-0 UBQ10 (ZT25 0.002; ZT37 0.014), Ws EF-1A (ZT25 0.000; ZT37 0.239), Ws UBQ10 (ZT25 0.006; ZT37 0.239), hy5 hyh EF-1A (ZT25 0.534; ZT37 0.57), hy5 hyh UBQ10 (ZT25 0.432; ZT37 0.048).

Similar articles

Cited by

References

    1. Thomashow MF. PLANT COLD ACCLIMATION: freezing tolerance genes and regulatory mechanisms. Annu. Rev. Plant Physiol. Plant Mol. Biol. 1999;50:571–599. doi: 10.1146/annurev.arplant.50.1.571. - DOI - PubMed
    1. Knight MR, Knight H. Low‐temperature perception leading to gene expression and cold tolerance in higher plants. New Phytol. 2012;195:737–751. doi: 10.1111/j.1469-8137.2012.04239.x. - DOI - PubMed
    1. Crosatti C, et al. Harden the chloroplast to protect the plant. Physiol. Plant. 2013;147:55–63. doi: 10.1111/j.1399-3054.2012.01689.x. - DOI - PubMed
    1. Moellering ER, Muthan B, Benning C. Freezing tolerance in plants requires lipid remodeling at the outer chloroplast membrane. Science. 2010;330:226–228. doi: 10.1126/science.1191803. - DOI - PubMed
    1. Steponkus PL, et al. Mode of action of the COR15a gene on the freezing tolerance of Arabidopsis thaliana. Proc. Natl Acad. Sci. USA. 1998;95:14570–14575. doi: 10.1073/pnas.95.24.14570. - DOI - PMC - PubMed

Publication types

LinkOut - more resources