. 2023 Apr;4(4):485-501.
doi: 10.1038/s43018-023-00536-9. Epub 2023 Mar 30.

Precision-activated T-cell engagers targeting HER2 or EGFR and CD3 mitigate on-target, off-tumor toxicity for immunotherapy in solid tumors

Affiliations

Precision-activated T-cell engagers targeting HER2 or EGFR and CD3 mitigate on-target, off-tumor toxicity for immunotherapy in solid tumors

Fiore Cattaruzza et al. Nat Cancer. 2023 Apr.

Abstract

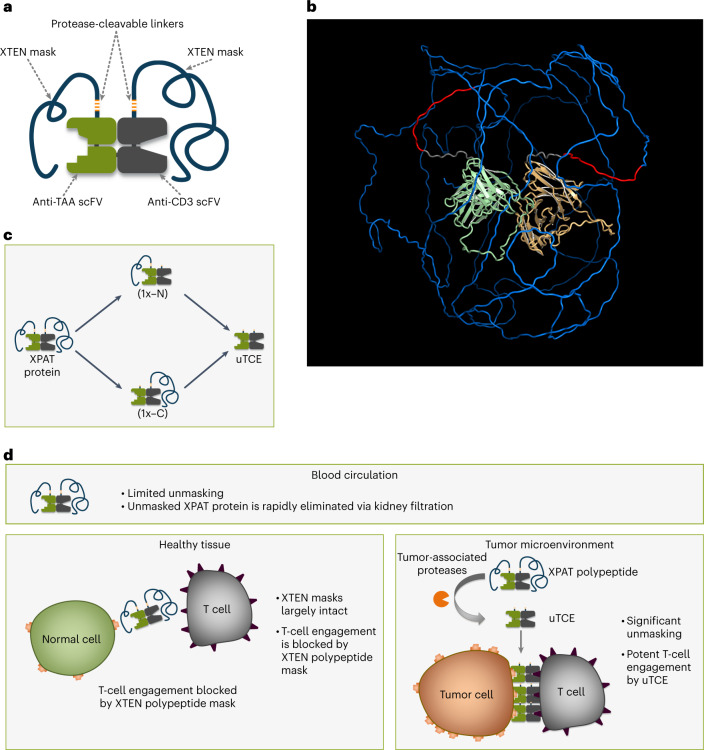
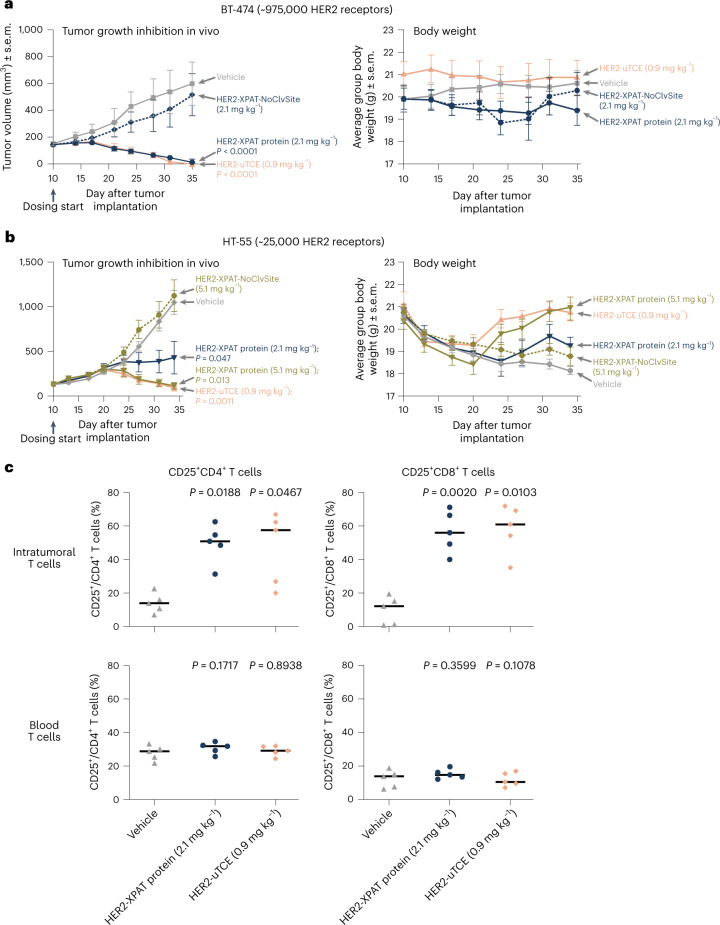
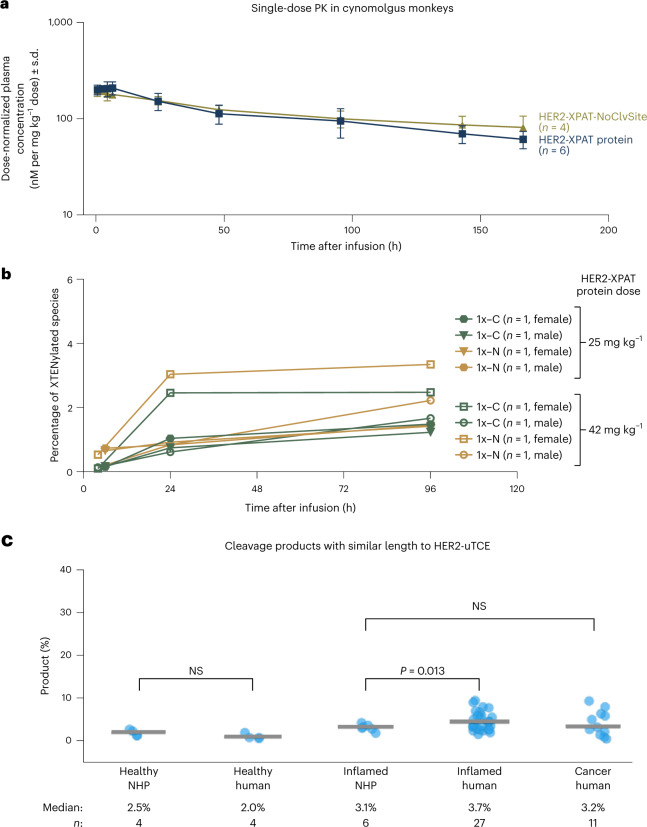
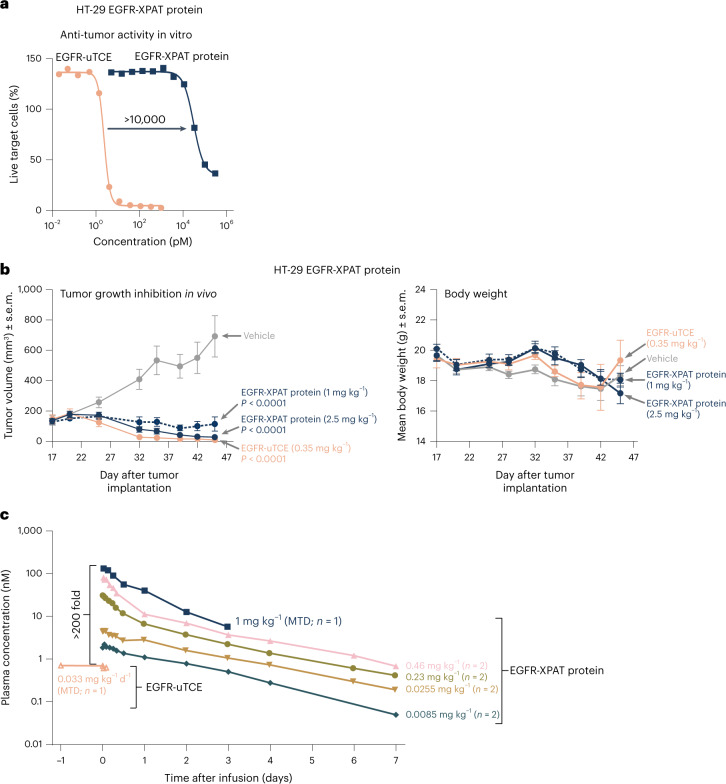
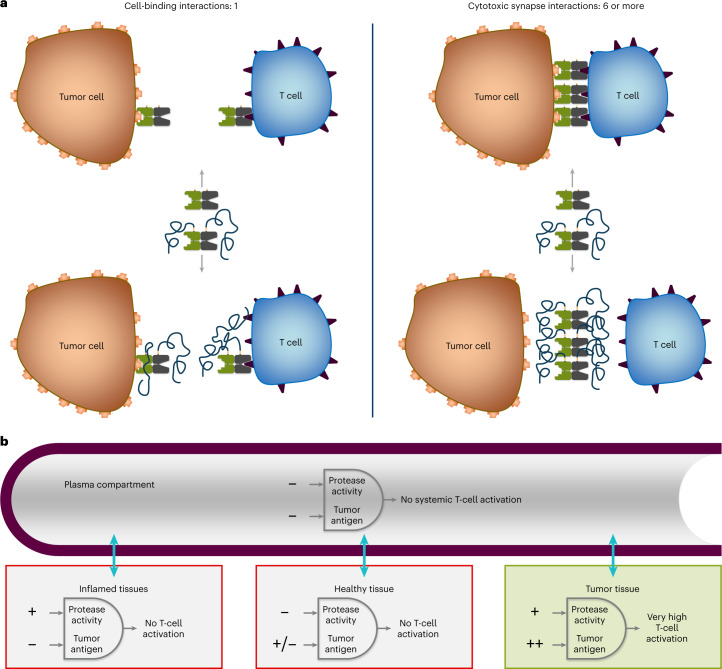
To enhance the therapeutic index of T-cell engagers (TCEs), we engineered masked, precision-activated TCEs (XPAT proteins), targeting a tumor antigen (human epidermal growth factor receptor 2 (HER2) or epidermal growth factor receptor (EGFR)) and CD3. Unstructured XTEN polypeptide masks flank the N and C termini of the TCE and are designed to be released by proteases in the tumor microenvironment. In vitro, unmasked HER2-XPAT (uTCE) demonstrates potent cytotoxicity, with XTEN polypeptide masking providing up to 4-log-fold protection. In vivo, HER2-XPAT protein induces protease-dependent antitumor activity and is proteolytically stable in healthy tissues. In non-human primates, HER2-XPAT protein demonstrates a strong safety margin (>400-fold increase in tolerated maximum concentration versus uTCE). HER2-XPAT protein cleavage is low and similar in plasma samples from healthy and diseased humans and non-human primates, supporting translatability of stability to patients. EGFR-XPAT protein confirmed the utility of XPAT technology for tumor targets more widely expressed in healthy tissues.


Conflict of interest statement

All authors are employees of and own stock in Amunix Pharmaceuticals (a Sanofi company). This study was funded by Amunix Pharmaceuticals.

Figures

Fig. 1
Fig. 1. Structure and mechanism of action of XPAT therapeutics.
a, An XPAT protein comprises a TCE core with two scFvs, one targeting CD3 and the other, a TAA. Each scFv is masked by a protease-releasable XTEN mask, unstructured, hydrophilic polypeptides that act as modular, tunable masks, in addition to extending the half-life of the TCE. Each XTEN mask connects to the TCE core via a protease-cleavable linker, designed to be cleavable by any of eight proteases from three different classes (matrix metalloproteinases, serine proteases and cysteine proteases) involved in cancer progression. b, Predicted structure of HER2-XPAT protein visualized using AlphaFold2 v.2.0, a machine-learning-based computational method for predicting protein structures with reasonable accuracy. Colors indicate anti-HER2 domain, pale green; anti-CD3 domain, light orange; XTEN masks, blue; protease-cleavable linker, red; linkers, gray. The model represents a static picture showing a plausible conformation of the unstructured XTEN masks and the length of unstructured XTEN relative to the folded antibody domains in an XPAT protein. c, XPAT proteins are expected to remain largely intact in healthy tissues, where protease activity is well controlled by protease inhibitors. XPAT protein unmasking occurs in two steps via one of two potential paths to the fully unmasked state. The two requisite cleavage events can occur in either order and each sequence (either the top or bottom paths shown) is equally likely. In aggregate, both 1x-N and 1x-C partially unmasked forms will exist, depending on the cleavage path. Removal of both XTEN masks liberates the unmasked HER2-TCE (uTCE). d, XPAT proteins are designed to exploit the dysregulated protease activity present in tumors versus healthy tissues and expand the therapeutic index of TCEs through preferential unmasking in the TME. The active uTCE promotes the formation of immunologic synapses between tumor and T cells, resulting in potent cytotoxicity. Notably, the uTCE has a short half-life and should be rapidly cleared, thereby sparing healthy tissues when the uTCE diffuses away from the TME. By design, the molecular weight of the uTCE (∼59 kDa) is sufficiently small to allow rapid kidney filtration.
Fig. 2
Fig. 2. Binding and in vitro activity of HER2-XPAT protein, its partially unmasked metabolites and unmasked HER2-TCE.
a, Binding affinities to human HER2 and CD3 at 37 °C by surface plasmon resonance. Data are KD (n = 12 technical replicates of a single experiment for HER2-XPAT protein and HER2(1x-N); n = 8 for HER2(1x-C) and uTCE). Surface plasmon resonance sensorgrams for these data are provided in Supplementary Figs. 3–10. bd, In vitro tumor cytotoxicity of HER2-XPAT protein and its metabolites following a 48-h incubation with co-cultures of huPBMCs and the high HER2-expressing human tumor cell lines (1:1 effector–target ratio) SKOV3 (b), BT-474 (c) or the medium-low HER2-expressing MCF7 cell line (d). e, In vitro cytotoxicity of HER2-XPAT protein and its metabolites against BT-474 cells co-cultured with huPBMCs (1:1 effector–target ratio). f, Impact of the protease-cleavable linker on in vitro cytotoxicity versus BT-474 cells co-cultured with huPBMCs. g,h, CD69-positive T cells (g) and IL-2 secretion (h) following 72-h incubation of huPBMC/SKOV3 co-cultures with HER2-XPAT protein or its unmasked form (uTCE). i, Target-dependent T-cell activation with HER2-XPAT protein and its metabolites. CD3-expressing Jurkat reporter T cells were incubated with BT-474 cells at a 5:1 effector–target ratio for 6 h, followed by quantification of NFAT-induced luciferase activity and measured in relative luminescence units (RLUs). Mean data for n = 2 technical replicates within one single experiment (bi). Extended Data Table 1 provides a summary of EC50 values for the different forms of the HER2-XPAT proteins in the cytotoxicity and reporter T-cell activation assays. Source data
Fig. 3
Fig. 3. Effects of HER2-XPAT protein and unmasked HER2-TCE in HER2-high BT-474 human breast cancer and HER2-low HT-55 colorectal cancer xenografts, engrafted with huPBMCs.
a, TGI ± s.e.m. (n = 8 mice for each concentration tested within one single experiment) promoted by the i.v. administration of equimolar doses (every week (QW) for 3 weeks) of HER2-XPAT protein (2.1 mg kg−1) or uTCE to NOG mice bearing established (maximum tolerated volume (MTV) ~185 mm3) BT-474 human tumors. The dependence of tumor-resident proteases for activity was demonstrated by the lack of significant TGI in mice treated with HER2-XPAT-NoClvSite. The average body weight of the mice bearing tumor xenografts remained generally stable for the duration of the experiment following dosing with the HER2-XPAT proteins or the vehicle control. b,TGI ± s.e.m. (n = 8 mice for each concentration tested within one single experiment) in established human HT-55 xenografts (MTV ∼150 mm3) following i.v. administration of HER2-XPAT protein (QW for 4 weeks) and HER2-uTCE (0.9 mg kg−1 three times a week (TIW) for 4 weeks). HER2-XPAT-NoClvSite (QW for 4 weeks) had no impact on tumor growth. The average body weight ± s.e.m. of the mice bearing tumor xenografts remained generally stable for the duration of the experiment following dosing with the HER2-XPAT proteins or the vehicle control. c, T-cell activation in BT-474 human tumor xenografts and peripheral blood evaluated by flow cytometry on day 18 following equimolar TIW i.v. dosing with HER2-XPAT protein and HER2-uTCE (day 40 following tumor inoculation). HER2-XPAT and HER2-uTCE induced robust and comparable activation of intratumoral CD4+ and CD8+ T cells, whereas no trends for T-cell activation were apparent in blood samples in which HER2 was not present. Statistical differences in TGI and T-cell activation for test compounds versus vehicle were assessed using mixed-effects multiple comparison analyses followed by Tukey’s post hoc test. Source data
Fig. 4
Fig. 4. Preferential XPAT protein unmasking in tumor tissue.
a, Fluorescent dye-labeled HER2-XPAT or EpCAM-XPAT protein was used to track proteolytic cleavage in PDX tumor-bearing mice. b, A representative SDS–PAGE gel showing XPAT protein cleavage forms arising in a single PDX-bearing mouse, after imaging by LI-COR Biosciences. Four bands representing HER2-XPAT protein and its three unmasked forms are visible in the tumor sample (green channel) while the other (red channel) predominantly shows the XPAT protein form. c, Concentration of XPAT protein forms in tumors and healthy tissues. Results are the mean ± s.d. from 20 mice within one single experiment, with tumors consisting of ten different PDX (Supplementary Table 3); mice were injected with fluorescent dye-labeled HER2-XPAT or EpCAM-XPAT protein. Note that tissues for which ≥14 samples were below the limit of quantification (BLQ) were reported as ‘BLQ.’ Tissues with averages calculated using some samples with BLQ readings are marked with an asterisk. Source data
Fig. 5
Fig. 5. Evaluation of the toxicological, PK and PD characteristics of HER2-XPAT protein and unmasked HER2-uTCE in NHPs.
HER2-XPAT protein was administered via short i.v. infusions (∼1–3 h), whereas the unmasked counterpart, due to its short half-life, was administered via 48-h continuous i.v. infusion to provide prolonged systemic exposure. a, A dose-escalation study with a single dose of HER2-XPAT protein administered to each cynomolgus monkey. *At doses below 21 mg kg−1, a HER2-XPAT prototype was used. b, Dose de-escalation study of uTCE in NHPs administered as a 48-h continuous infusion due to its short half-life. c, Plasma concentrations in NHPs following administration of a single i.v. dose of HER2-XPAT protein (42 mg kg−1, n = 2 NHPs; 25 mg kg−1, n = 4 NHPs; 6 mg kg−1, n = 12 NHPs; 2 mg kg−1, n = 12 NHPs) or a 48-h continuous infusion of uTCE (0.2 mg kg−1 d−1, n = 1 NHP; 0.1 mg kg−1 d−1, n = 1 NHP; 0.06 mg kg−1 d−1, n = 1 NHP). Data represent mean plasma concentration (±s.d. when n > 3 NHP treated) for the NHPs treated at each dose within one single experiment. d,e, Activation of circulating CD4+ T cells (d) and CD8+ T cells (e) 24 h after drug administration (HER2-XPAT protein, n = 16 NHPs; HER2-uTCE, n = 5 NHPs). fh, Highest plasma levels of TNF-α (f), IL-6 (g) and IFN-γ (h) measured 0–24 h following drug administration (HER2-XPAT protein, n = 23 NHPs; HER2-uTCE, n = 8 NHPs). Note that the normal ranges for cytokine levels in NHP are as follows: IL-6 0.3–1.2 pg ml−1, TNF-α 1–10 pg ml−1, IFN-γ 1.1–8.0 pg ml−1 (ref. ). Data in df represent a single sample from each NHP receiving the test material within each single experiment. TNF, tumor necrosis factor; IFN, interferon. Source data
Fig. 6
Fig. 6. XPAT protein protease-cleavable linkers show minimal cleavage in vivo in healthy NHPs.
a, Mean plasma concentrations (±s.d.) following a single i.v. administration of HER2-XPAT protein (single plasma samples from n = 6 NHPs) and HER2-XPAT-NoClvSite (n = 4 NHPs) within one single experiment. b, Plasma concentrations of HER2-XPAT(1x−N) and HER2XPAT(1x−C) relative to the entire HER2-XPAT protein, following a single i.v. dose of HER2-XPAT protein (25 mg kg−1, n = 4 NHPs; 42 mg kg−1, n = 4 NHPs) within one single experiment. c, Quantification of cleavage products with a similar molecular weight to the uTCE generated following incubation of fluorescent-labeled HER2-XPAT protein in plasma from cancer patients (n = 11), patients with inflammatory diseases (n = 27), healthy donors (n = 4) and NHPs (with (n = 6) and without (n = 4) drug-induced inflammation). The plasma incubation experiment represents a closed system with no clearance mechanisms and will therefore overestimate the accumulation of cleavage products occurring in vivo. Horizontal bars represent median values; dots represent individual observations. P values are based on unpaired t-tests. Source data
Fig. 7
Fig. 7. Evaluation of the antitumor activity and in vivo PK of EGFR-XPAT prototype.
a, In vitro activity of the EGFR-XPAT protein and its corresponding unmasked EGFR-TCE (EGFR−uTCE) against HT-29 (BRAFmut) cells (effector–target ratio, 5:1; n = 2 technical replicates at each concentration tested within one single experiment). Extended Data Table 1 provides a summary of EC50 values for unmasked EGFR-TCE and EGFR-XPAT protein in the cytotoxicity assays. b, TGI in the HT-29 huPBMC-engrafted xenograft model following i.v. administration of EGFR-XPAT protein (TIW dosing starting on day 14 post-tumor implantation; n = 6 mice for each concentration tested within one single experiment) and EGFR-uTCE (TIW dosing starting on day 14 post-tumor implantation; n = 6 mice for each concentration tested within one single experiment); P < 0.0001 for both versus vehicle at day 26 (mixed-effects multiple comparison analyses followed by Tukey’s post hoc test). The average body weight of the mice bearing tumor xenografts remained generally stable for the duration of the experiment following dosing with the EGFR-XPAT proteins or the vehicle control. c, PK following a single dose of EGFR-XPAT protein and EGFR-uTCE in NHPs. Sparse data were available for the unmasked EGFR-TCE due to PK assay sensitivity (lower limit of quantification ∼540 pM). Data represent mean plasma concentration based on a single plasma sample collected per time point from each NHP following administration of EGFR-XPAT protein (1 mg kg−1, n = 1 NHP; 0.46 mg kg−1, n = 2 NHPs; 0.23 mg kg−1, n = 2 NHPs; 0.0255 mg kg−1, n = 2 NHPs; 0.0085 mg kg−1, n = 2 NHPs) or EGFR-uTCE (0.033 mg kg−1 d−1, n = 1 NHP) within one single experiment. Source data
Fig. 8
Fig. 8. Regulation of XPAT protein activity.
a, Mechanism for XPAT protein binding to cells (left) and promoting T-cell engagement. Binding of XPAT protein to cells is a bimolecular event in which equilibrium should be directly proportional to the binding affinities of the component molecules. In contrast, synapse formation (right) is a high-order molecular process that involves many individual binding events. b, Proposed mechanisms for differential regulation of XPAT protein activity in different tissue compartments are depicted. By harnessing the potency of bispecific TCEs with an enhanced therapeutic window, XPAT proteins may provide an opportunity to improve clinical outcomes beyond those achieved with TAA-targeted monoclonal antibodies or antibody–drug conjugates, enabling patients to safely mobilize T cells independent of their antigen specificity.
Extended Data Fig. 1
Extended Data Fig. 1. Binding affinity of HER2-XPAT protein and its partially and fully unmasked metabolites to cynomolgus monkey HER2 and CD3.
Binding was assessed in vitro at 37°C by surface plasmon resonance. Data are KD (n=8 to 12 technical replicates of a single experiment; individual data points are displayed on the graph). Surface plasmon resonance sensorgrams for these data are provided in Supplementary Figs. 11–18. HER2, human epidermal growth factor receptor 2; uTCE, unmasked HER2 T-cell engager; XPAT proteins, TCEs fused to XTEN polypeptides. Source data
Extended Data Fig. 2
Extended Data Fig. 2. Target-dependent T-cell activation with HER2-XPAT protein and unmasked HER2-TCE.
CD3+ Jurkat reporter T cells were incubated with or without BT-474 cells at a 5ː1 effector-target ratio for 6 hours, followed by quantification of NFAT-induced luciferase activity. The graph shows individual data points from a single representative experiment. There were n = 2 biological repeats at each concentration tested within the same experiment for each cell line. HER2, human epidermal growth factor receptor 2; RLU, relative luminescence unit; uTCE, unmasked T-cell engager; XPAT proteins, TCE fused to XTEN polypeptides. Source data
Extended Data Fig. 3
Extended Data Fig. 3. Binding affinity of EGFR-XPAT protein to human and cynomolgus monkey EGFR and CD3.
Binding was assessed in vitro at 37°C by surface plasmon resonance. Data are KD (n=12 technical replicates of a single experiment). Surface plasmon resonance sensorgrams for these data are provided in Supplementary Figs. 19–22. cy, cynomolgus; hu, human; EGFR, epidermal growth factor receptor; XPAT proteins, TCEs fused to XTEN polypeptides. Source data

Comment in

References

    1. Goebeler M-E, Bargou RC. T cell-engaging therapies—BiTEs and beyond. Nat. Rev. Clin. Oncol. 2020;17:418–434. doi: 10.1038/s41571-020-0347-5. - DOI - PubMed
    1. Havel JJ, Chowell D, Chan TA. The evolving landscape of biomarkers for checkpoint inhibitor immunotherapy. Nat. Rev. Cancer. 2019;19:133–150. doi: 10.1038/s41568-019-0116-x. - DOI - PMC - PubMed
    1. Ribas A, Wolchok JD. Cancer immunotherapy using checkpoint blockade. Science. 2018;359:1350–1355. doi: 10.1126/science.aar4060. - DOI - PMC - PubMed
    1. Clynes RA, Desjarlais JR. Redirected T cell cytotoxicity in cancer therapy. Ann. Rev. Med. 2019;70:437–450. doi: 10.1146/annurev-med-062617-035821. - DOI - PubMed
    1. Lowe KL, et al. Novel TCR-based biologics: mobilising T cells to warm ‘cold’ tumours. Cancer Treat. Rev. 2019;77:35–43. doi: 10.1016/j.ctrv.2019.06.001. - DOI - PubMed