. 2023 Apr;26(4):579-593.
doi: 10.1038/s41593-023-01284-w. Epub 2023 Mar 30.

Norepinephrine links astrocytic activity to regulation of cortical state

Affiliations

Norepinephrine links astrocytic activity to regulation of cortical state

Michael E Reitman et al. Nat Neurosci. 2023 Apr.

Abstract

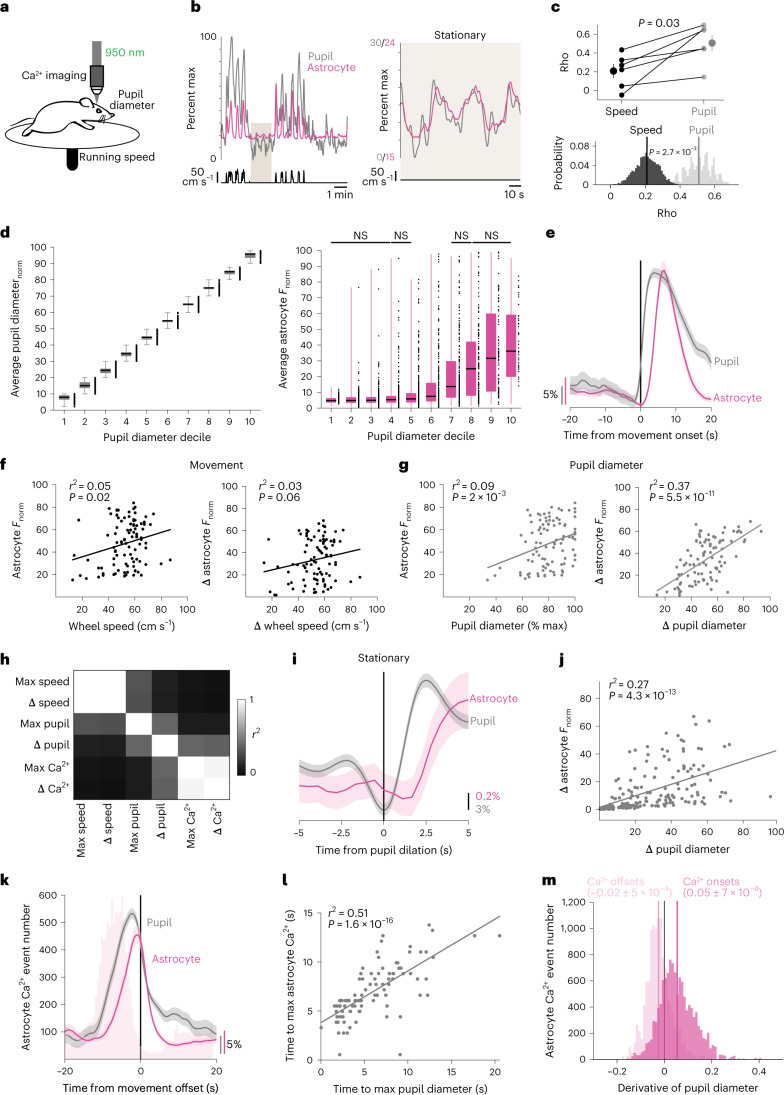
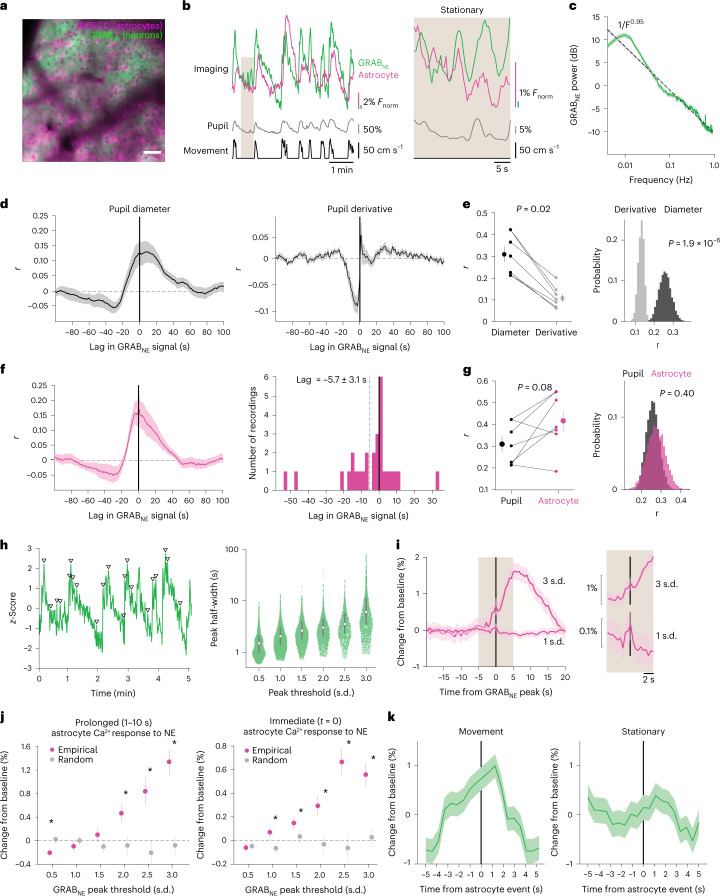
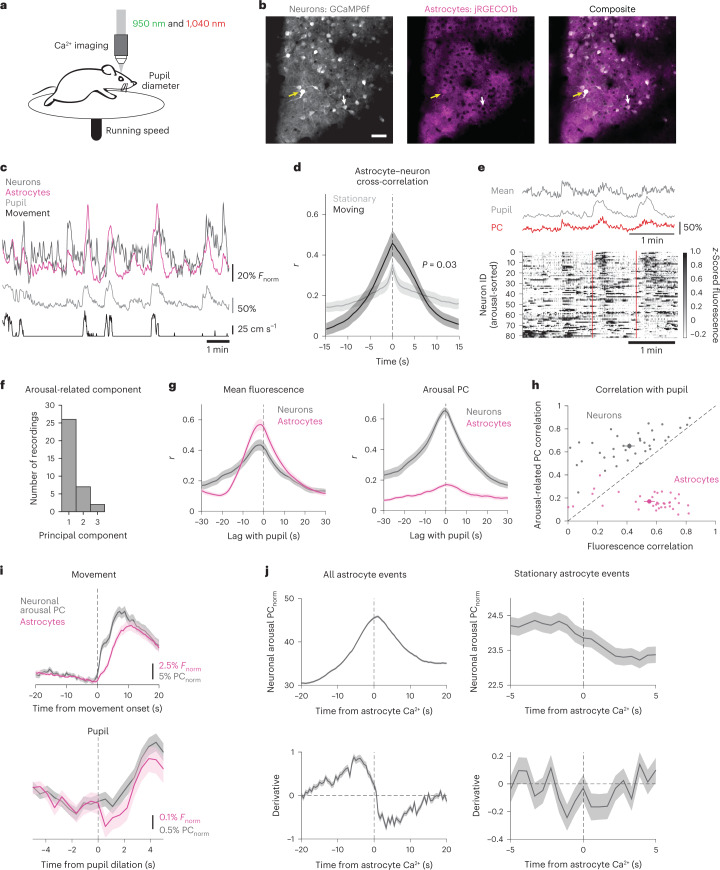
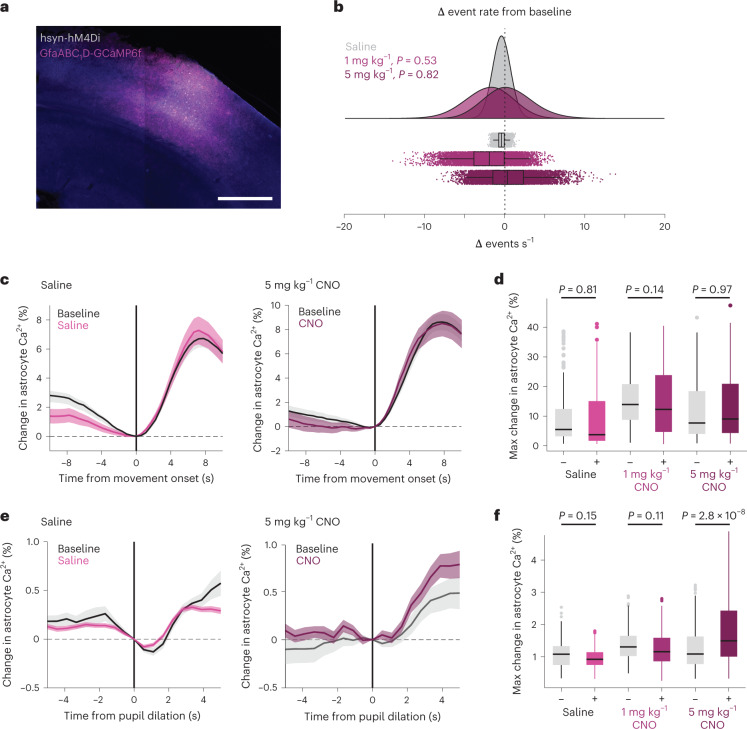
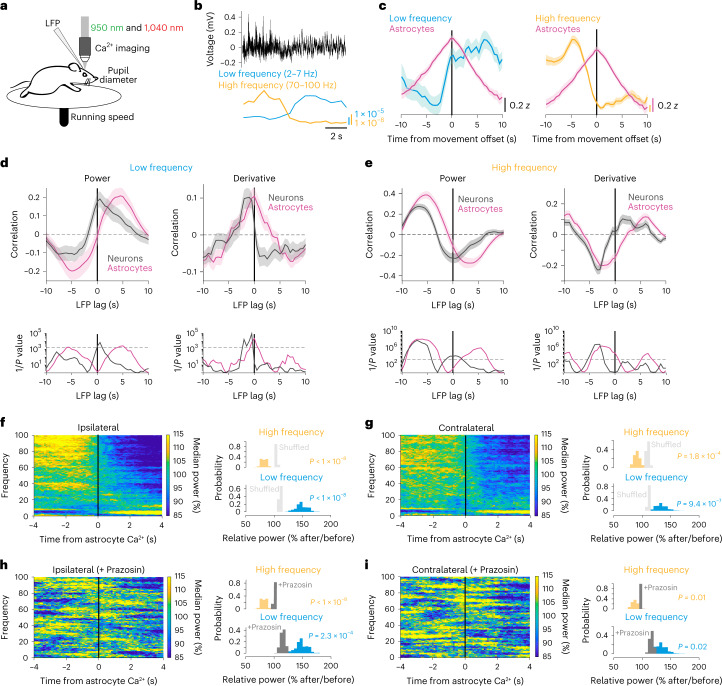
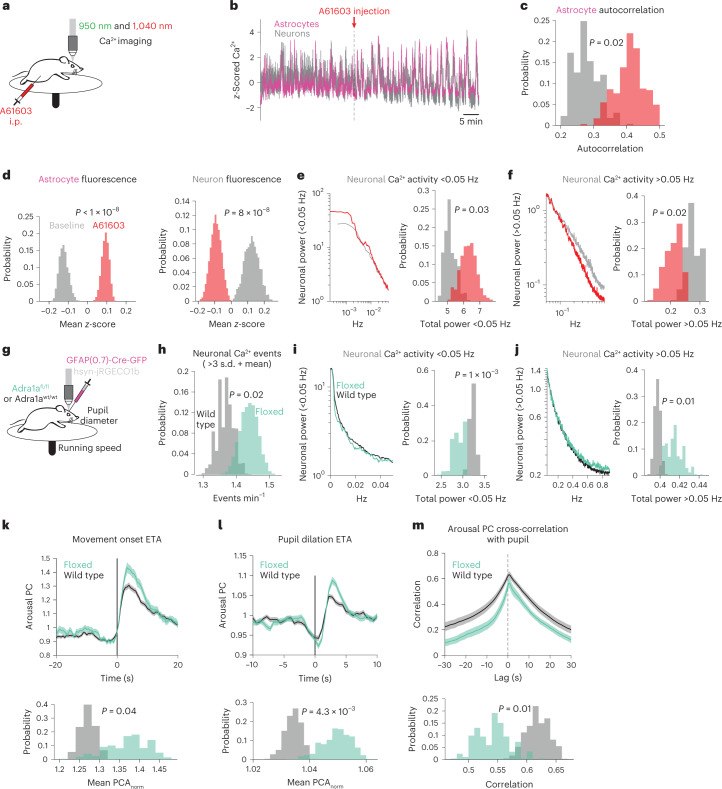
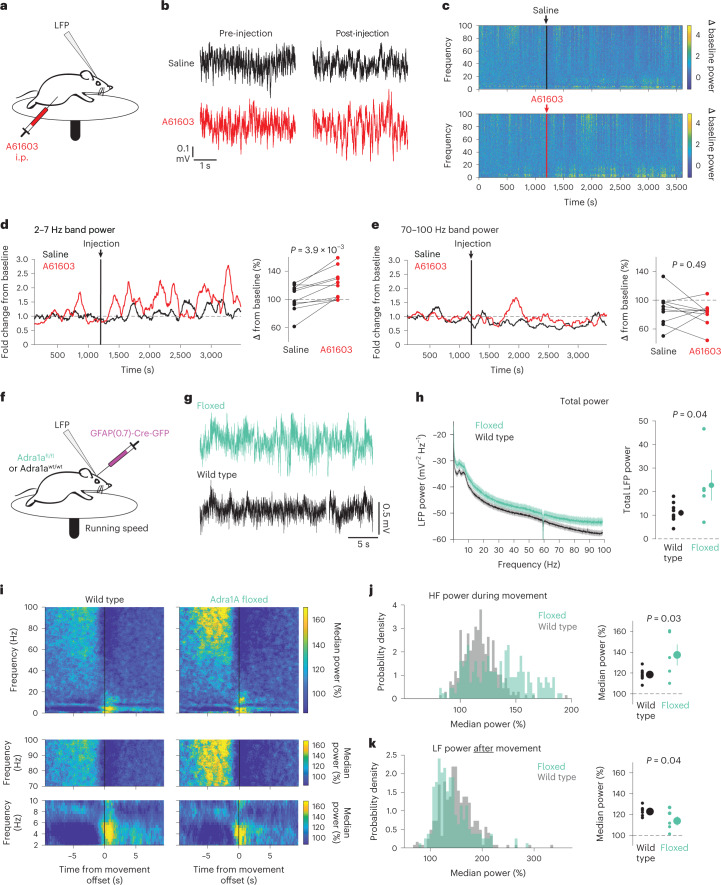
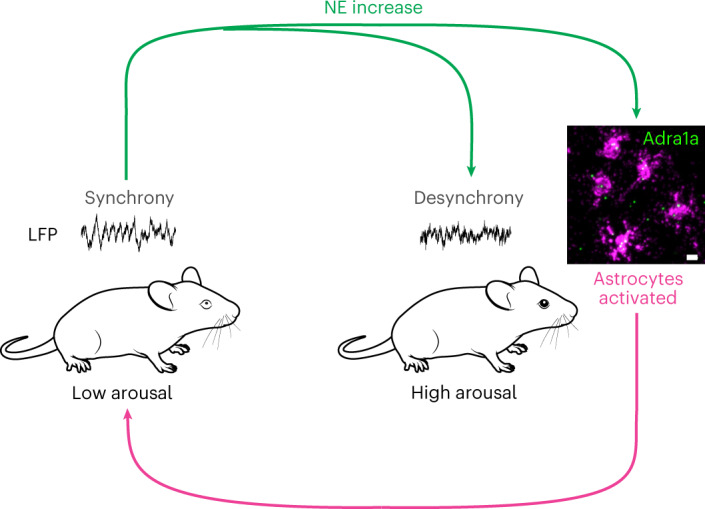
Cortical state, defined by population-level neuronal activity patterns, determines sensory perception. While arousal-associated neuromodulators-including norepinephrine (NE)-reduce cortical synchrony, how the cortex resynchronizes remains unknown. Furthermore, general mechanisms regulating cortical synchrony in the wake state are poorly understood. Using in vivo imaging and electrophysiology in mouse visual cortex, we describe a critical role for cortical astrocytes in circuit resynchronization. We characterize astrocytes' calcium responses to changes in behavioral arousal and NE, and show that astrocytes signal when arousal-driven neuronal activity is reduced and bi-hemispheric cortical synchrony is increased. Using in vivo pharmacology, we uncover a paradoxical, synchronizing response to Adra1a receptor stimulation. We reconcile these results by demonstrating that astrocyte-specific deletion of Adra1a enhances arousal-driven neuronal activity, while impairing arousal-related cortical synchrony. Our findings demonstrate that astrocytic NE signaling acts as a distinct neuromodulatory pathway, regulating cortical state and linking arousal-associated desynchrony to cortical circuit resynchronization.


Conflict of interest statement

The authors declare no competing interests.

Figures

Fig. 1
Fig. 1. Changes in arousal shape astrocyte Ca2+ activity independent of movement.
a, Experimental setup. b, Representative astrocyte Ca2+ (magenta), pupil diameter (gray) and wheel speed (black) show that these measures are closely related (left), even during stationary periods (right, smoothed with a five-frame window). Percent max indicates percent of maximum recorded value. c, Astrocyte Ca2+ correlates better with pupil diameter than speed when comparing across mice (top, two-sided signed-rank test) or using HB of recordings (n = 6 mice). Values of n are applied throughout the figure. d, Left: separating pupil diameter on the basis of size. Right: astrocyte Ca2+ was not different within low or high pupil sizes (n = 3,206 time bins, one-sided Kruskal–Wallis test, P > 0.05 indicated as NS, Supplementary Table 1). Box plot shows median and interquartile range (IQR). Whiskers extend to the most extreme data points. e, Astrocyte Ca2+ and pupil diameter dynamics aligned to mouse movement onset at t = 0 (n = 104 movement onsets). f,g, Linear regression (trend lines) of astrocyte Ca2+ and either wheel speed or pupil diameter, after movement onset (n = 104 movement onsets, two-sided t-test): neither maximum wheel speed (left) nor changes in wheel speed (right) correlate well with astrocyte Ca2+ responses (f); maximum pupil diameter (left) predicts astrocyte Ca2+ less strongly than changes in pupil diameter (right) (g). h, Heat map of r2 values between the variables in f and g. i, Astrocyte Ca2+ response to pupil dilation during stationary periods (n = 188 stationary dilations). j, Changes in stationary pupil diameter correlate with astrocyte Ca2+ (n = 188 stationary dilations, two-sided t-test). k, Astrocyte Ca2+ events (light-pink bars) begin before movement offset, but average astrocyte Ca2+ fluorescence (magenta trace) peaks with pupil diameter at the end of movement (n = 104 movement offsets). l, The latency to maximum astrocyte Ca2+ and pupil diameter after movement onset (n = 104 movement bouts, two-sided t-test) are correlated. m, Astrocyte Ca2+ events (n = 1.17 × 104 astrocyte Ca2+ events) begin (dark pink) with pupil dilation (that is, when pupil derivative is positive) and end (light pink) with constriction (negative pupil derivative). Data are presented as mean ± s.e.m. unless otherwise noted.
Fig. 2
Fig. 2. Astrocytes are sensitive to a range of NE increases.
a, In vivo 2P image showing dual-color expression of neuronal GRABNE and astrocyte jRGECO1b. Scale bar, 50 µm. n = 28 recordings from seven mice throughout figure. b, Representative traces smoothed with a five-frame window. Astrocyte Ca2+ (magenta), GRABNE (green), pupil diameter (gray) and wheel speed (black) show a close relationship over the course of minutes (left), and over the course of seconds during stationary periods (right). c, The power spectrum of GRABNE dynamics shows an inverse relationship with frequency (F−0.95, dotted line) and increased power in slow fluctuations (period >30 s, mean with jackknifed error bars). d, GRABNE positively correlates with pupil diameter (left), but not the derivative of pupil diameter (right). e, GRABNE is more strongly correlated with pupil diameter than pupil derivative across mice (left, two-sided signed-rank test) and across recordings (HB). f, Left: astrocyte Ca2+ activity positively correlates with GRABNE activity. Right: astrocyte Ca2+ activity follows changes in GRABNE. g, No difference was found between the GRABNE correlation with astrocytes compared with pupil diameter across mice (left, P = 0.08, two-sided signed-rank test) or across recordings (HB). h, Left: phasic increases in GRABNE signal, with arrowheads marking a subset of peaks. Right: larger increases in GRABNE had longer durations (P < 0.05 for all bins, one-sided Kruskal–Wallis test, n and P values listed in Supplementary Table 2). Box plot shows median and IQR. i, Example astrocyte Ca2+ traces separated by GRABNE peak amplitude. Left: astrocyte Ca2+ activity showed large and persistent responses to large increases (for example, 3 s.d.) in GRABNE. Right (shaded area, 5 s before and after t = 0): both large and small (for example, 1 s.d.) changes in GRABNE drove small transient increases in astrocyte Ca2+. j, Left: astrocyte Ca2+ persistently increased after large (≥2 s.d.) increases in GRABNE, and scaled with GRABNE amplitude (*P < 0.05, two-sided rank-sum test, n and P values listed in Supplementary Table 3). Right: astrocyte Ca2+ showed proportional, time-locked responses to even small changes (≥1 s.d.) in GRABNE (*P < 0.05, two-sided rank-sum test; for details, see Supplementary Table 3). k, GRABNE activity around astrocyte Ca2+ onsets at t = 0 s (n = 1.2 × 104 events) shows increased extracellular NE before astrocyte Ca2+ events in both movement and stationary periods. Data are presented as mean ± s.e.m.
Fig. 3
Fig. 3. Astrocyte Ca2+ is positioned to reduce effects of arousal on population-level neuronal activity.
a, Experimental paradigm for dual-color Ca2+ imaging of neurons and astrocytes. n = 33 recordings from eight mice throughout figure. b, 2P images from one recording of in vivo neuronal GCaMP6f (gray) and astrocyte jRGECO1b (magenta). Yellow arrows indicate bleed-through in the red channel which was accounted for (Methods), while white arrows show a neuron with no bleed through. Scale bar, 50 µm. c, Example of neuronal (dark gray) and astrocyte (magenta) Ca2+ activity, with pupil diameter (light gray) and wheel speed (black). d, Astrocyte and neuronal Ca2+ were positively correlated, and increased their correlation during movement compared with stationary periods (two-sided rank sum test). e, Top: an example of pupil diameter (light gray) fluctuations alongside changes in the neuronal mean fluorescence (dark gray) and arousal-associated PC of neuronal activity (red). Bottom: an example heat map of single-cell neuronal activity sorted by arousal PC weight shows that the arousal PC captured heterogeneous neuronal responses to arousal, including around movement events (red dashed lines). f, The component number of the arousal PC. g, Both neurons (gray) and astrocytes (pink) showed positive correlations between mean Ca2+ fluorescence and pupil diameter (left). Using PC analysis, we identified neuronal activity that showed strong correlation with pupil diameter, whereas astrocyte Ca2+ activity was not amenable to this analysis. h, Scatter plot of the correlation between either arousal PC (y axis) or mean fluorescence (x axis) for each recording. PC analysis identified arousal-associated neuronal activity for neurons (gray dots), but not astrocytes (magenta dots). i, Astrocyte Ca2 signaling (magenta) occurred alongside increases in arousal-associated neuronal activity (gray), and peaked with reductions in neuronal activity, for both movement (top, n = 134 movement bouts) and stationary increases in arousal (bottom, n = 772 pupil dilations). j, Top: arousal-associated neuronal activity tends to peak and then decrease around astrocyte Ca2+ activity both overall (left, n = 8.9e4 events) and during stationary periods (right, n = 3.2 × 104 events). Bottom: the derivative of arousal-associated neuronal activity demonstrates that arousal-associated neuronal activity decreases directly following astrocyte Ca2+ events both overall (left) and during stationary periods (right). All data are presented as mean ± s.e.m. unless otherwise noted.
Fig. 4
Fig. 4. Arousal-driven astrocyte Ca2+ is not dependent on local neuronal activity.
a, Confocal image showing representative cortical expression from one mouse of both astrocyte GCaMP6f (magenta) and neuronal inhibitory DREADD hM4Di (gray). Scale bar, 500 µm. b, Bootstrapped change in astrocyte event rate (n = 1 × 105 resampled events from five mice) after saline (gray) or CNO (purple) administration. No significant change in astrocyte Ca2+ event rate was found (P < 0.05, One-sided test of the proportion of bootstrapped change in event rates below saline). c, Average change in astrocyte Ca2+ response to movement after saline (left) or CNO (right, 5 mg kg−1) compared with the baseline in each animal (black lines). d, No significant (P < 0.05) difference in astrocyte Ca2+ responses (% change in astrocyte Ca2+ relative to t = 0; box-and-whisker plot with outliers as open circles), to movement after saline or either 1 mg kg−1 or 5 mg kg−1 of CNO was found (one-sided Kruskal–Wallis test, n and P values listed in Supplementary Table 4). e, Average change in astrocyte Ca2+ response to stationary pupil dilation after saline (left) or CNO (right, 5 mg kg−1). f, No significant difference (P < 0.05) was found within saline or 1 mg kg−1 CNO conditions. 5 mg kg−1 CNO caused an enhancement in astrocyte responses to arousal (Kruskal–Wallis test, n and P values listed in Supplementary Table 5). Box plots show median and IQR, with whiskers extended to 1.5× IQR. Line plots are presented as mean ± s.e.m.
Fig. 5
Fig. 5. NE-dependent astrocyte Ca2+ occurs at the crux of cortical state changes.
a, Experimental setup. b, Example LFP data (black) with calculated LF (2–7 Hz, blue) and HF (70–100 Hz, orange) power. c, Average LFP LF (left) and HF (right) power with astrocyte Ca2+ activity (magenta) around movement offset at t = 0 s (n = 52 offsets from four mice). d, Top: cross-correlation between astrocyte (magenta) or neuronal Ca2+ (gray) activity and LF power (left), or the derivative of LF power (right). Bottom: significance (1/P, two-sided signed-rank test) for astrocytes and neurons. Dashed line is the threshold of correction for multiple comparison. e, HF power and its derivative are cross-correlated to neuronal and astrocyte Ca2+, as for LF power in d. Neuronal Ca2+ correlated with LFP power, while astrocyte Ca2+ correlated with the derivative of LFP power. f,g, LFP power dynamics in ipsilateral (f) and contralateral (g) cortex, centered around astrocyte Ca2+ onsets at t = 0 s. LFP power in a 5 s window around astrocyte Ca2+ events was computed, and each frequency was normalized by its median power. (All p-values from one-sided HB). Left: astrocyte Ca2+ events occur at the crux of ipsilateral (f, n = 4 mice) and contralateral (g, n = 5 mice) LFP state transitions from HF- to LF-dominated states. Comparisons are made using HB between empirical data (colored bars) and shuffled distributions (light gray). Right: HF power decreased (orange) and LF power (blue) increased after astrocyte Ca2+ events. h,i, This relationship was abolished in both ipsilateral (h) and contralateral (i) cortical LFP recordings after administration of the Adra1 receptor antagonist Prazosin (5 mg kg−1, i.p., n = 4 mice), for both LF and HF power (comparisons are made using HB between state changes without Prazosin (colored bars) and with the addition of Prazosin (dark gray). Line plots are presented as mean ± s.e.m.
Fig. 6
Fig. 6. Adra1a receptors modulate basal neuronal activity and neuronal population responses to arousal.
a, Experimental schematic for dual-color imaging with in vivo pharmacology. b, A striking example of population astrocyte (magenta) and neuron (gray) Ca2+ activity in response to A61603 (10 µg kg−1, i.p.). cf, Histograms show differences between metrics at baseline (gray) or after A61603 (red) using HB (n = 4 mice in cg): astrocyte Ca2+ activity became more homogeneous as measured by autocorrelation (c); astrocytes (left) showed increased population Ca2+ fluorescence while neurons (right) showed decreased population Ca2+ fluorescence after A61603 administration (d); neuronal activity power spectra <0.05 Hz (left) showed more power after A61603 injection (right, HB) (e); same as in e for power >0.05 Hz (f). g, Schematic for neuronal Ca2+ imaging in homozygous Adra1afl/fl mice and wild-type littermate controls; all mice were injected with GFAP-Cre (n = 4 Adra1afl/fl and four wild-type littermate controls in hl). h, Overall, neuronal activity was increased in Adra1afl/fl mice (green) relative to wild type (gray). i,j, Neuronal activity <0.05 Hz was decreased and neuronal activity >0.05 Hz was increased in Adra1afl/fl mice. k, Arousal-associated neuronal activity was increased following movement in Adra1afl/fl mice (green, n = 177 movement bouts) compared with wild type (gray, n = 400). l, Adra1afl/fl mice (green, n = 923 pupil dilations) showed increased arousal-associated neuronal activity compared with wild type (gray, n = 1,396 pupil dilations) following stationary increases in pupil diameter. m, Arousal-associated neuronal activity was less correlated with the pupil diameter overall in Adra1afl/fl (green, n = 23 recordings) compared with wild-type mice (gray, n = 14 recordings). For all panels, histograms show HB distributions (n = 4 Adra1afl/fl and 4 wild-type littermate controls). All line plots are presented as mean ± s.e.m. and P values from histograms show one-sided HB tests.
Fig. 7
Fig. 7. Genetic removal of astrocyte Arda1a impairs cortical resynchronization after arousal.
a, Experimental setup for LFP recording with in vivo pharmacology. b, Example cortical LFP data following i.p. injections of either saline (black) or the Adra1a-specific agonist A61603 (1 µg kg−1, red). c, Representative spectrograms from saline-injected (top) and A61603 -injected (bottom) mice. Arrows and vertical lines indicate time of injection. d, Left: example of 2–7 Hz band power change with saline or A61603 injection, smoothed with a 2 min moving average. Right: A61603 increased LF power compared with saline (two-sided signed-rank test, n = 10 mice). e, Left: representative trace of 70–100 Hz band power with saline or A61603 injection. Right: A61603 did not affect HF power compared with saline (two-sided signed-rank test, n = 10 mice). f, LFP recordings were performed in homozygous Adra1afl/fl mice and wild-type littermate controls; all mice were injected with GFAP-Cre. g, Representative 30 s of LFP data from Adra1afl/fl (green) and wild-type (black) mice. h, Average LFP spectra from Adra1afl/fl (n = 5) and wild-type (n = 9) mice, with total LFP power higher in Adra1afl/fl mice (two-sided t-test, shaded region shows theoretical error bars with P = 0.05). i, Average LFP spectrograms around movement offset (t = 0 s) for wild-type (left) and Adra1afl/fl (right) mice. Data are normalized by the median power at each frequency to show state-related changes in LFP. Top: entire spectrograms from 0–100 Hz. Middle: 70–100 Hz range showing increased power in Adra1afl/fl mice compared with wild type during movement. Bottom: 2–7 Hz range showing reduced power after movement offset in Adra1afl/fl mice. j, There was increased 70–100 Hz power in Adra1afl/fl mice during movement (left, n = 303 wild-type and 194 Adra1afl/fl movement offsets) between cohorts (right, n = 5 Adra1afl/fl and 9 wild-type mice, two-sided t-test). k, Same as in j for 2–7 Hz power after mice stopped moving. For all scatter plots, individual data are plotted as mean ± s.e.m.
Fig. 8
Fig. 8. Model of astrocyte regulation of arousal-associated cortical state.
NE (green arrows) drives changes from states of low arousal with synchronized cortical activity (left) to states of high arousal with desynchronized cortical activity (right). Simultaneous activation of astrocytes through the Adra1a receptor leads to Ca2+ signaling (magenta arrow) that drives the cortex back to a synchronized state following increases in arousal. Scale bar, 10 µm. Mouse images from SciDraw.io under a Creative Commons licence CC BY 4.0.
Extended Data Fig. 1
Extended Data Fig. 1. Dissection of astrocyte Ca2+ and behavioral state.
(a) Representative 2P mean projection image from one ten-minute recording of in vivo astrocyte GcaMP6f (left, scale bar = 100 µm). AQuA detected both large (middle) and small (right) astrocyte Ca2+ events within the entire movie, even when they were spatially overlapping. Arrows indicate two pairs of spatially overlapping events (arrows 1 and 3, and arrows 2 and 4).(b) Traces from the AQuA events shown in (a), with the time period of the AQuA-detected event highlighted in red. (c) Related to Fig. 1c: Individual astrocyte Ca2+ events correlated better with pupil diameter (left, n = 1.2e4 Ca2+ events, One-sided Kruskal-Wallis test) and had a shorter lag with pupil diameter than wheel speed (right, pupil n = 9.6e3, wheel n = 8.3e3, rank-sum test). (d) Related to Fig. 1d: average pupil diameter during movement (n = 100) and stationary periods (n = 76). (e) Classification of behavioral state by both pupil diameter and movement. (f) Pupil dilation is smaller (left) and shorter (right, rank-sum tests) during stationary periods (n = 261 dilations, blue) compared with movement-associated dilations (n = 136 dilations, red, boxplots show median and IQR with whiskers to 1.5 * IQR, two-sided Rank Sum test). (g) Related to Fig. 1l: Left: Movement duration (n = 104) was related to the maximum wheel speed (top) and pupil diameter (middle), but not to the maximum astrocyte Ca2+ (bottom). Right: the latency to the maximum wheel speed (top), pupil diameter (middle), and astrocyte Ca2+ (bottom) were strongly linked to movement duration. (h) Heatmap summary of the r2 between the latencies in (g) right, and movement bout duration.
Extended Data Fig. 2
Extended Data Fig. 2. Hemodynamic correction of 2P GRABNE signals.
(a) Left: Average projection of a single GRABNE recording with four regions-of-interest (ROI) in areas with clear GRABNE fluorescence (black squares, labeled 1–4) and one ROI in a blood vessel (red square, labeled BV). Middle: standard deviation projection. Right: average fluorescence in each ROI before hemodynamic correction. (b) Left: Estimated hemodynamic signal present in each pixel. Middle: recovered average projection after hemodynamic correction. Note average fluorescence after hemodynamic correction is broadly similar the uncorrected data in (a) with some blurring due to Gaussian smoothing in preprocessing. Right: average ROI fluorescence after hemodynamic correction. (c) ROI-free methodology for obtaining GRABNE signal. Left: Following hemodynamic correction, the bottom quartile of pixels with the lowest hemodynamic weights, excluding the bottom 1% which often had artefactual signals, were kept. Right: These pixels were averaged together to produce the corrected GRABNE signal (bottom) which had substantially less hemodynamic contamination than the uncorrected field fluorescence (top). (d) Correlation between the corrected GRABNE signal and the uncorrected ROIs in (a) and (b). (e) Left: Correlation between uncorrected GRABNE fluorescence and pupil diameter. Right: Example traces from the average of pixels that were positively correlated (top), negatively correlated (bottom), or showed little relationship (middle) with pupil diameter. (f) The corrected GRABNE signal is not similar to the uncorrected GRABNE signal (red dot) but instead reflects the GRABNE signal of binned pixels (black dots) correlated to pupil diameter (R2 = 0.62, p = 1.55−5, two-sided t-test).
Extended Data Fig. 3
Extended Data Fig. 3. Freely moving fiber photometry recordings of GRABNE and astrocyte Ca2+.
(a) Schematic of fiber photometry recording set-up. (b) A 5-minute example fiber photometry recording of GRABNE signal. (c) GRABNE power spectrum. n = 4 mice, 19 recordings over multiple days, 10–30 minutes/recording. Error lines are ± s.e.m. across all mice.) (d) GRABNE (green) and astrocyte jRGECO1b (magenta) signals evoked by startle responses due to tail lifts (grey arrow heads). (e) Average startle-response evoked traces for GRABNE and jRGECO, aligned to onset of astrocyte Ca2+. n = 4 mice, 4 tail lifts per mouse. Error is ± s.e.m. across mice.
Extended Data Fig. 4
Extended Data Fig. 4. Analysis of contributions to astrocyte Ca2+.
(a) Left: A Random Forest Regression model was trained (80% of data, 2.3e4 samples) to predict (20% of data, 5.63 samples) average astrocyte Ca2+ fluorescence accurately (mean r2 = 0.85 ± 4.5e-3 std, n = 10 cross-validations). Right: Relative feature importance based on permutation testing of each predictor. Randomly generated data was included as a negative control and did not inform model predictions. (b) Same analysis as in (a), using the neuronal arousal PC rather than average neuronal activity. Random Forest Regression using the neuronal arousal PC showed a similar accuracy to that using mean neuronal fluorescence (mean r2 = 0.87 ± 6.4e-3 std, n = 10 cross-validations). Boxplots show median and IQR with whiskers to 1.5 * IQR.
Extended Data Fig. 5
Extended Data Fig. 5. Cortical astrocyte expression of adrenergic receptors.
(a) Ribosomal-mRNA expression in visual cortex astrocytes of P120 mice from the Farhy-Tselnicker et. al. publicly available dataset. Visual cortex astrocytes show expression of many adrenergic receptors (left) but preferentially express the Adra1a receptor relative to input control (right). Boxplots show median and IQR with whiskers to 1.5 * IQR (N = 3 mice for astrocyte ribosomal-mRNA and 1 input control). (b) Left: Representative brain section with Adra1a (green), Adra1b (red), and Adra2a (yellow) mRNA labeled by smFISH using the LaST map pipeline. SLC1a3 (GLAST) mRNA expression (purple) was used to define the location of astrocytes. The white square shows a representative ROI used to quantify visual cortex expression. Right: High-magnification image of visual cortex, showing receptor mRNA both within astrocytes marked by high GLAST mRNA (purple), and outside of astrocytes. (c) Quantification of NE-receptor mRNA expression in visual cortex astrocytes, quantified by relative cortical depth. Line plots show mean ± std (n = 3 mice, 7 ROIs).
Extended Data Fig. 6
Extended Data Fig. 6. Generation of Adra1afl/fl mice.
Top: schematic of the genetic strategy used to generate conditional deletion of Adra1a. Primers (green arrows) were designed to identify and distinguish between the endogenous and knock-in Adra1a alleles. Bottom: Numbers are in base pairs. Validation of the knock-in strategy used to generate Adra1afl/fl mice. PCR of Adra1afl/+ mice generates both a 154 base pair band corresponding to the wild type allele and a 235 base pair band corresponding to successful LoxP knock-in, which is not found in wild-type mice. N = 5 Adra1afl/+ and 4 wild type mice.
Extended Data Fig. 7
Extended Data Fig. 7. Astrocyte-specific Cre expression.
(a) Representative average 2 P image of in vivo neuronal jRGECO1b (gray) and astrocytes expressing Cre-GFP (magenta) (b) Example images show astrocyte-specific Cre-GFP (magenta) expression overlaps with the astrocyte marker S100β (left, green) but not the neuronal marker NeuN (right, grey), scale bar = 100 µm. (c) Representative mean-projection of a confocal 60x z-stack used for cell counting. Each animal had two sections with each section having six distinct field-of-views containing 20 z-planes. GFAP(0.7)-Cre-GFP expression (left) was highly astrocytic and the neuronal marker NeuN (middle) was rarely colocalized (right, scale bars = 50 µm). (d) Cre expression in neurons (grey bars) was low across genotypes (overall = 2.2 ± 0.39 neurons/50 µm3) and no difference was found between Cre expression in Adra1afl/fl mice and control mice or the cohort as a whole (One-sided Kruskal-Wallis test). (e) Cre-expressing neurons were rare in both wild-type (black, 4.0% ± 0.75%) and Adra1afl/fl mice (green, 4.1% ± 0.65%, two-sided ranked-sum test). (n = 7 Adra1afl/fl and n = 5 wild-type mice for all graphs. Data are presented as mean ± S.E.M.).
Extended Data Fig. 8
Extended Data Fig. 8. Resonant galvo imaging (7.5 Hz effective frame rate) confirms increased neuronal activity in Adra1afl/fl mice.
(a–c) Histograms show neuronal activity in Adra1afl/fl (green) and wild-type littermate mice (grey) based on HB. (a) Neuronal Ca2+ event rate was increased in Adra1afl/fl (green, n = 4 mice) compared to wild-type mice (grey, n = 4 mice). (b) Left: power spectrum of Adra1afl/fl (green) and wild-type (black) Ca2+ activity between 0–0.05 Hz. Right: Total power in 0–0.05 Hz neuronal Ca2+ activity, comparing Adra1afl/fl and wild-type mice. (c) Same analysis as (b), comparing power in neuronal Ca2+ fluctuations > 0.05 Hz. All p-values from one-sided HB tests.
Extended Data Fig. 9
Extended Data Fig. 9. Quantification of arousal-associated neuronal activity.
(a) Cumulative distribution plots of the duration of movement bouts (left) and stationary pupil dilations (right) for wild-type (black, n = 400 movement bouts and 1396 pupil dilations) and Adra1afl/fl (green, n = 177 movement bouts and n = 923 pupil dilations) mice. (b) Analysis range (red) used to quantify the normalized arousal PC response to movement in wild-type (left) and Adra1afl/fl (right) mice. Each row represents one movement event, and the movements from all recordings and mice are concatenated to show the entire dataset (n = 4 wild-type mice and n = 4 Adra1afl/fl mice). (c) Same analysis as in (b), showing stationary pupil dilations in Adra1afl/fl mice compared to wild-type.

References

    1. Harris KD, Thiele A. Cortical state and attention. Nat. Rev. Neurosci. 2011;12:509–523. doi: 10.1038/nrn3084. - DOI - PMC - PubMed
    1. Crochet S, Petersen CCH. Correlating whisker behavior with membrane potential in barrel cortex of awake mice. Nat. Neurosci. 2006;9:608–610. doi: 10.1038/nn1690. - DOI - PubMed
    1. Niell CM, Stryker MP. Modulation of visual responses by behavioral state in mouse visual cortex. Neuron. 2010;65:472–479. doi: 10.1016/j.neuron.2010.01.033. - DOI - PMC - PubMed
    1. Steriade M, McCormick DA, Sejnowski TJ. Thalamocortical oscillations in the sleeping and aroused brain. Science. 1993;262:679–685. doi: 10.1126/science.8235588. - DOI - PubMed
    1. Fries P. Neuronal gamma-band synchronization as a fundamental process in cortical computation. Annu. Rev. Neurosci. 2009;32:209–224. doi: 10.1146/annurev.neuro.051508.135603. - DOI - PubMed

Publication types