. 2023 May;8(5):973-985.
doi: 10.1038/s41564-023-01350-w. Epub 2023 Mar 30.

No evidence for a common blood microbiome based on a population study of 9,770 healthy humans

Affiliations

No evidence for a common blood microbiome based on a population study of 9,770 healthy humans

Cedric C S Tan et al. Nat Microbiol. 2023 May.

Abstract

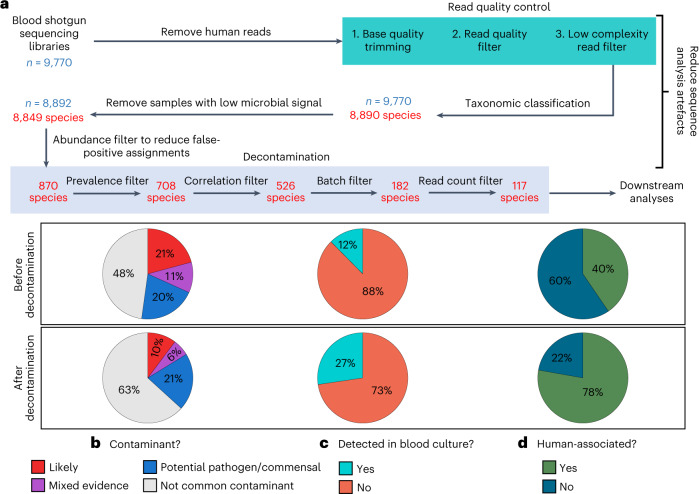
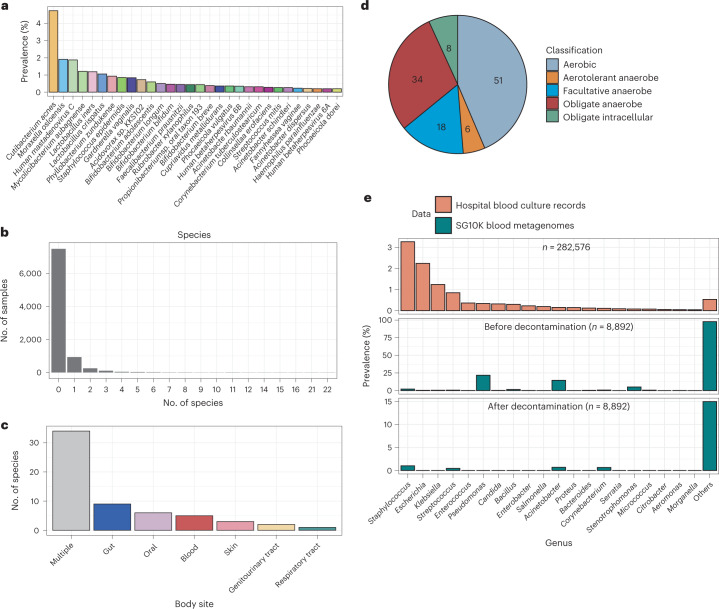
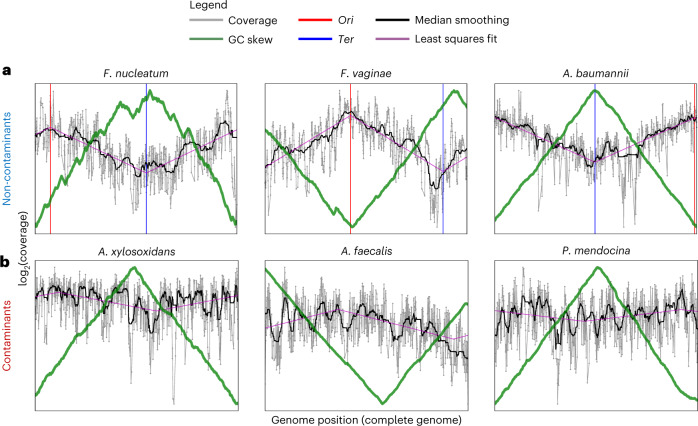
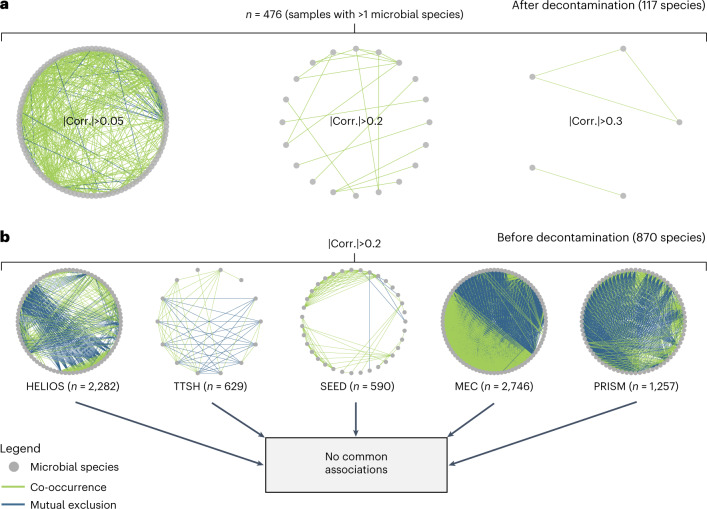
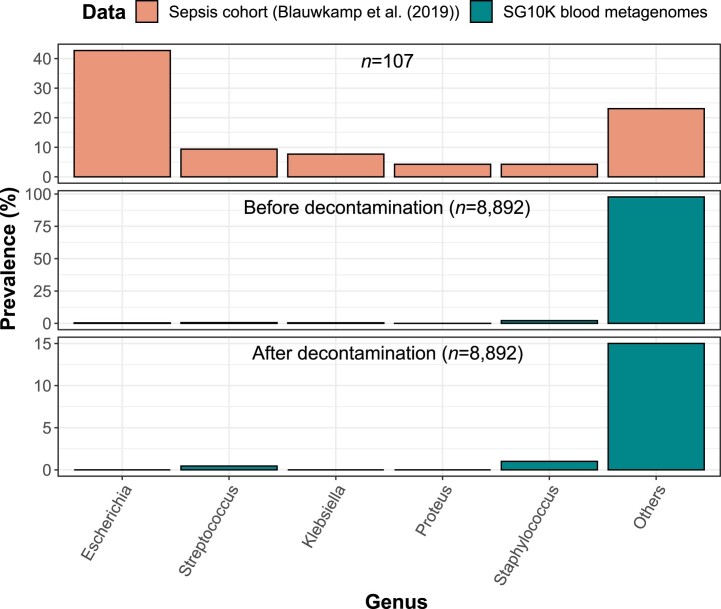
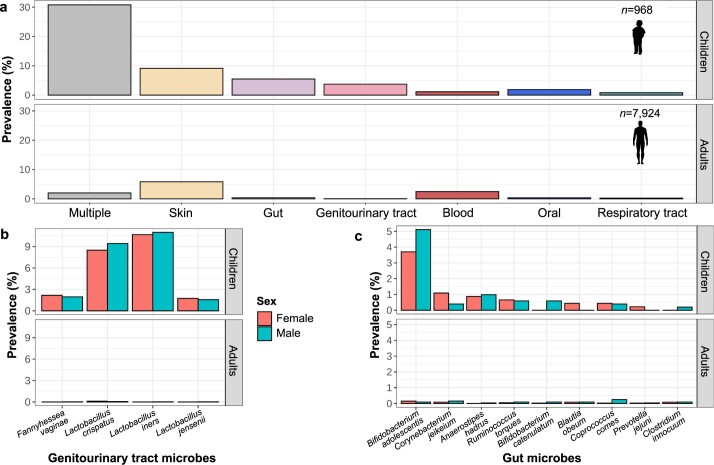
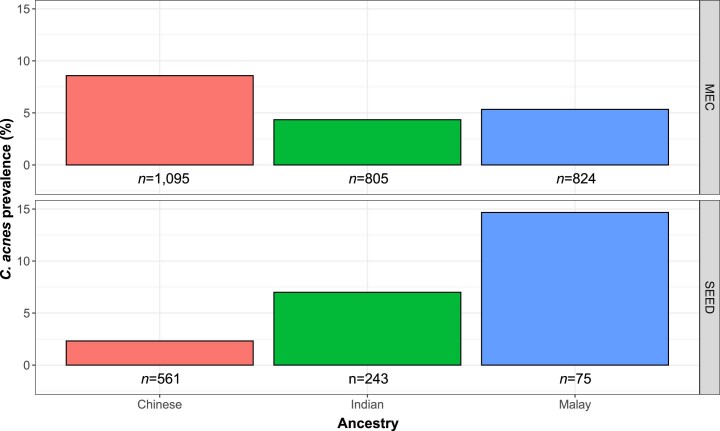
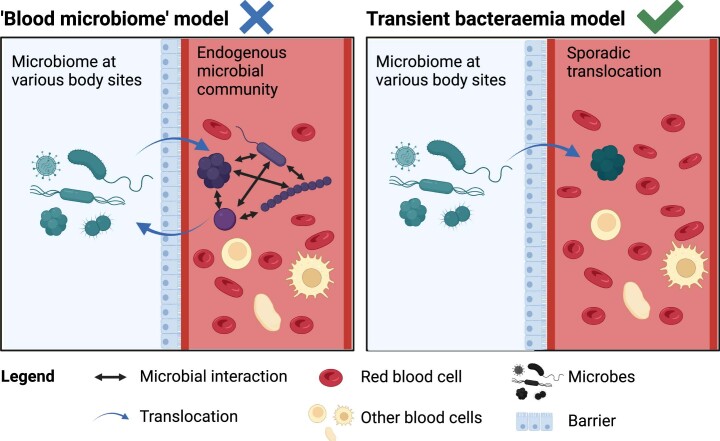
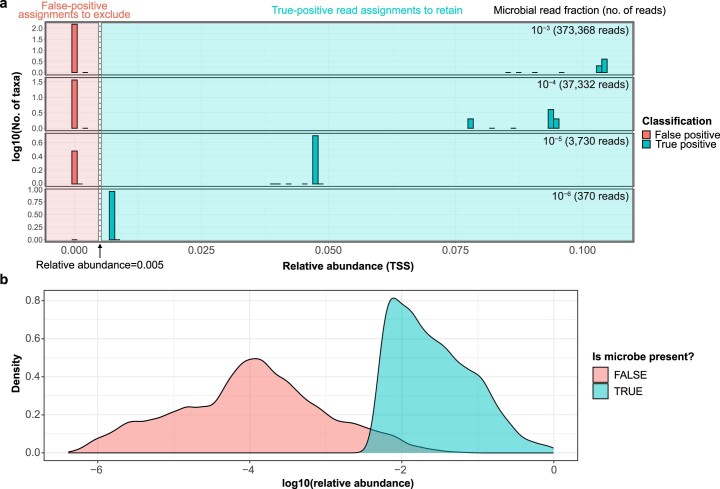
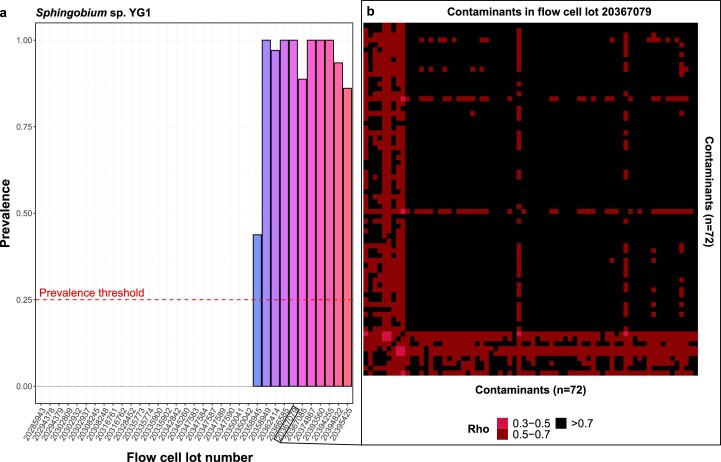
Human blood is conventionally considered sterile but recent studies suggest the presence of a blood microbiome in healthy individuals. Here we characterized the DNA signatures of microbes in the blood of 9,770 healthy individuals using sequencing data from multiple cohorts. After filtering for contaminants, we identified 117 microbial species in blood, some of which had DNA signatures of microbial replication. They were primarily commensals associated with the gut (n = 40), mouth (n = 32) and genitourinary tract (n = 18), and were distinct from pathogens detected in hospital blood cultures. No species were detected in 84% of individuals, while the remainder only had a median of one species. Less than 5% of individuals shared the same species, no co-occurrence patterns between different species were observed and no associations between host phenotypes and microbes were found. Overall, these results do not support the hypothesis of a consistent core microbiome endogenous to human blood. Rather, our findings support the transient and sporadic translocation of commensal microbes from other body sites into the bloodstream.


Conflict of interest statement

The authors declare no competing interests.

Figures

Fig. 1
Fig. 1. Robust identification of microbial DNA signatures in blood.
a, Summary of pre-processing steps and filters applied to taxonomic profiles (n = 9,770 individuals) and the number of species retained after each filter. bd, Pie charts showing the proportion of microbial species that are (b) common sequencing contaminants, (c) detected in blood culture records and (d) human-associated, before and after applying the decontamination filters. Source data
Fig. 2
Fig. 2. Microbial signatures in blood from healthy individuals.
a, Bar chart showing the prevalence of the top 30 confidently detected microbial species in all 8,892 blood sequencing libraries. b, Histogram of the number of microbial species per sample. c, Bar chart of the human body sites the 117 confidently detected species are associated with, as determined using the Disbiome database. Species are classified as ‘multiple’ if they are associated with more than one body site and classified otherwise if they are only associated with a single body site. d, Pie chart showing the microbiological classification of the 117 confidently detected species. e, Bar chart showing the prevalence of genera in blood culture records and in the blood sequencing libraries before and after decontamination. Source data
Fig. 3
Fig. 3. Evidence for replicating bacteria in blood samples from healthy individuals.
a,b, Coverage plots of three representative (a) non-contaminant and (b) contaminant species. a, The sinusoidal shape of the coverage plots, characterized by higher depth of coverage nearer to the origin of replication (Ori) and lower coverage nearer to the terminus (Ter), is a signature of replicating bacterial cells. Source data
Fig. 4
Fig. 4. Microbial co-occurrence networks.
a, SparCC co-occurrence networks computed for all samples with at least two microbial species following decontamination at different SparCC correlation thresholds (0.05, 0.2, 0.3). Only associations with a magnitude of SparCC correlation greater than the respective thresholds are retained. b, SparCC networks for individual cohorts at a correlation threshold of 0.2. No co-occurrence associations were retained after taking the intersection of edges between all cohort networks. In a and b, each node represents a single microbial species, and each edge a single association between a pair of microbial species. Edge thickness is scaled by the magnitude of correlation. The number of samples used to compute each network and the correlation thresholds used are annotated. Positive and negative SparCC correlations are indicated in green and blue, respectively. Source data
Extended Data Fig. 1
Extended Data Fig. 1. Strong linear relationship between the number of Bowtie2 mapped and Kraken2 assigned reads on the log10 scale.
All data points (n = 122) are shown on the scatter plot. The linear regression line and associated parameter estimates annotated here were computed after removing outlier data points (in red). These outliers had studentised residuals >2 as computed from an initial linear regression including all data points. A two-sided F-test was used to determine if the slope parameter in the linear regression model differed from zero. Source data
Extended Data Fig. 2
Extended Data Fig. 2. Between-batch variability and within-batch consistency of contamination signals.
Heatmap of contaminant species prevalence stratified by the different lot numbers of the HiSeq SBS kit used for sequencing and by the different DNA extraction kits used to process the blood samples. Contaminant species are sorted by genus and notable genera known to be common contaminants are annotated on the figure. The prevalence of microbes varies greatly between the batches and kit types used (between-batch variability) and multiple species appear strongly correlated within a single batch (within-batch consistency). Source data
Extended Data Fig. 3
Extended Data Fig. 3. Decontamination filters significantly improve signal-to-noise ratio of microbial taxa retained.
Null distributions for the proportions of species classified as not likely contaminants, detected in blood, or human-associated. To generate these null distributions, for each of 1000 iterations, we randomly selected 117 microbial species from the list of species before decontamination and classified them based on same procedure used to generate Fig. 1b–d. The observed proportions following the application of our decontamination filters are indicated by black dashed lines. P-values were calculated as the fraction of iterations where the species proportions were greater or equal to the observed proportions (one-sided test; no multiple-testing correction performed). Source data
Extended Data Fig. 4
Extended Data Fig. 4. Distribution of total microbial reads for samples with no detected non-contaminant taxa.
Total microbial read counts are equivalent to the number of reads classified as microbial after applying the abundance filter but before decontamination (see Methods, Fig. 1a). Source data
Extended Data Fig. 5
Extended Data Fig. 5. Microbial prevalence in sepsis patients differs from that in healthy individuals.
Bar chart showing prevalence of genera detected in sepsis patients and in our blood sequencing libraries before and after decontamination. Blauwkamp et al. used shotgun sequencing of blood plasma collected from sepsis patients to determine the etiological agents involved and assessed the analytical sensitivity of this approach via multiple alternative culture-based and PCR-based detection methods. Source data
Extended Data Fig. 6
Extended Data Fig. 6. Higher prevalence of microbes in the blood of healthy children.
(a) The disproportionately high prevalence of microbes in the children’s cohort GUSTO relative to the other adult cohorts. Silhouette icons were sourced from Adobe Stock with a standard license. Prevalence of (b) genitourinary tract-associated and (c) gut-associated microbes in children’s and adult cohorts, stratified by sex. Body site classifications were determined using the Disbiome database. Source data
Extended Data Fig. 7
Extended Data Fig. 7. Inconsistent associations between C. acnes and genetic ancestry.
Samples were stratified by source cohort and genetic ancestry to calculate C. acnes prevalence. Only the cohorts where a significant (p < 0.05) association between the presence of C. acnes and genetic ancestry was found are shown (that is, MEC and SEED). The number of samples used as the denominator when calculating prevalence is annotated. Source data
Extended Data Fig. 8
Extended Data Fig. 8. Potential models for microbes in blood.
Our findings suggest that there is no consistent circulating blood microbiome (that is, the blood microbiome model). The more likely model is where microbes from other body sites transiently and sporadically translocate into blood. Created with BioRender.com under an academic subscription. Source data
Extended Data Fig. 9
Extended Data Fig. 9. Simulation experiments to determine the abundance cutoff for reducing false-positive species assignments.
(a) Histogram of the relative abundance of true-positive and true-negative Kraken2 species assignments. Approximately 373 million total reads were generated from human (GRCh38) and 10 microbial reference genomes at various microbial read fractions using InSillicoSeq. An abundance cutoff delineating the false-positive (FP) from true was selected (relative abundance=0.005) that retains and excludes all true-positive and false-positive Kraken2 species assignments, respectively. (b) Relative abundance distributions of taxa considered present or absent as demarcated by our abundance thresholds (that is, relative abundance ≤0.005, read pairs assigned ≤10). Source data
Extended Data Fig. 10
Extended Data Fig. 10. Illustration of decontamination filters used.
(a) The prevalence filter flagged Sphingobium sp. YG1 as a contaminant because its prevalence in at least one batch (that is, flow cell lot used) is greater than 25% (threshold indicated by dotted red line) and more than two-fold higher than the prevalence in at least one other batch. (b) Heatmap of pairwise Spearman’s Rho (that is, correlation) between the 72 contaminant species identified by the correlation filter for flow cell batch 20367079. The highly correlated nature of these species indicates that they are indeed likely contaminants specific to batch 20367079. Source data

References

    1. Singer M, et al. The third international consensus definitions for sepsis and septic shock (Sepsis-3) JAMA. 2016;315:801–810. doi: 10.1001/jama.2016.0287. - DOI - PMC - PubMed
    1. Brecher ME, Hay SN. Bacterial contamination of blood components. Clin. Microbiol. Rev. 2005;18:195–204. doi: 10.1128/CMR.18.1.195-204.2005. - DOI - PMC - PubMed
    1. Damgaard C, et al. Viable bacteria associated with red blood cells and plasma in freshly drawn blood donations. PLoS ONE. 2015;10:e0120826. doi: 10.1371/journal.pone.0120826. - DOI - PMC - PubMed
    1. Schierwagen R, et al. Circulating microbiome in blood of different circulatory compartments. Gut. 2019;68:578–580. doi: 10.1136/gutjnl-2018-316227. - DOI - PubMed
    1. Païssé S, et al. Comprehensive description of blood microbiome from healthy donors assessed by 16S targeted metagenomic sequencing. Transfusion. 2016;56:1138–1147. doi: 10.1111/trf.13477. - DOI - PubMed

Publication types