. 2023 Mar 30;22(1):64.
doi: 10.1186/s12943-023-01762-6.

CDK9 inhibition induces epigenetic reprogramming revealing strategies to circumvent resistance in lymphoma

Affiliations

CDK9 inhibition induces epigenetic reprogramming revealing strategies to circumvent resistance in lymphoma

Elana Thieme et al. Mol Cancer. .

Abstract

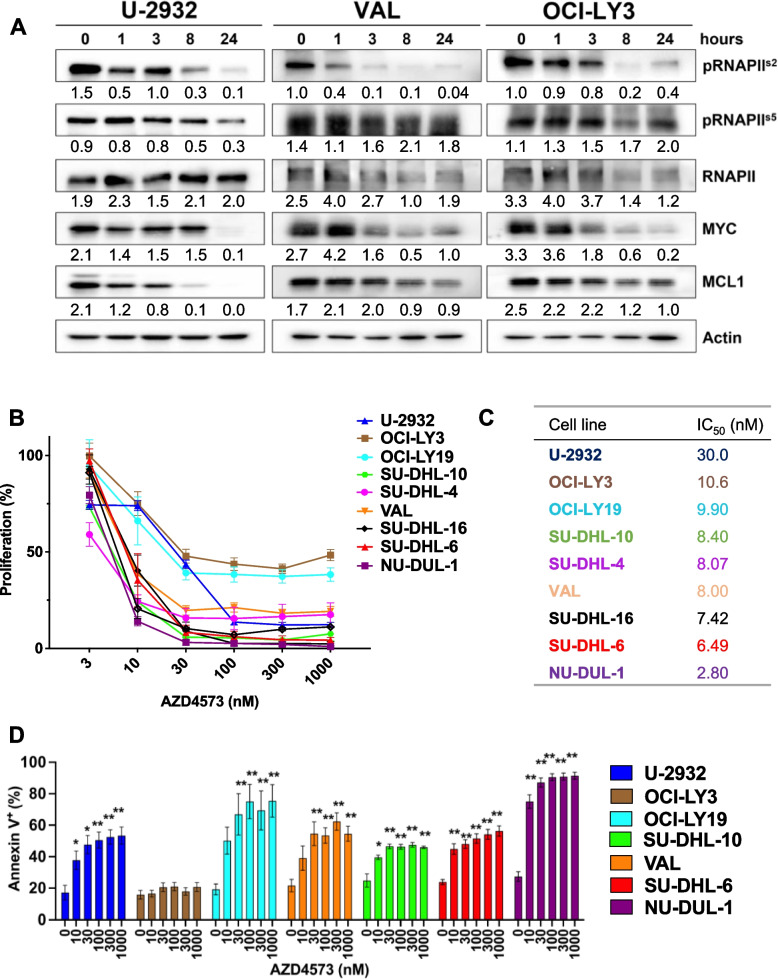
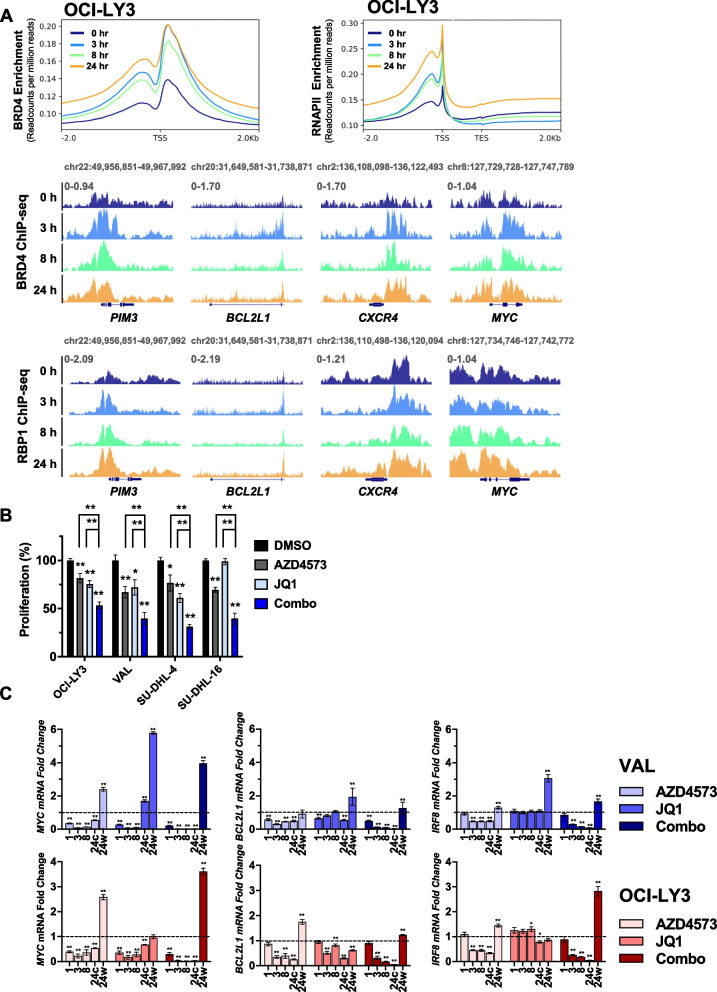
Diffuse large B-cell lymphoma (DLBCL) exhibits significant genetic heterogeneity which contributes to drug resistance, necessitating development of novel therapeutic approaches. Pharmacological inhibitors of cyclin-dependent kinases (CDK) demonstrated pre-clinical activity in DLBCL, however many stalled in clinical development. Here we show that AZD4573, a selective inhibitor of CDK9, restricted growth of DLBCL cells. CDK9 inhibition (CDK9i) resulted in rapid changes in the transcriptome and proteome, with downmodulation of multiple oncoproteins (eg, MYC, Mcl-1, JunB, PIM3) and deregulation of phosphoinotiside-3 kinase (PI3K) and senescence pathways. Following initial transcriptional repression due to RNAPII pausing, we observed transcriptional recovery of several oncogenes, including MYC and PIM3. ATAC-Seq and ChIP-Seq experiments revealed that CDK9i induced epigenetic remodeling with bi-directional changes in chromatin accessibility, suppressed promoter activation and led to sustained reprograming of the super-enhancer landscape. A CRISPR library screen suggested that SE-associated genes in the Mediator complex, as well as AKT1, confer resistance to CDK9i. Consistent with this, sgRNA-mediated knockout of MED12 sensitized cells to CDK9i. Informed by our mechanistic findings, we combined AZD4573 with either PIM kinase or PI3K inhibitors. Both combinations decreased proliferation and induced apoptosis in DLBCL and primary lymphoma cells in vitro as well as resulted in delayed tumor progression and extended survival of mice xenografted with DLBCL in vivo. Thus, CDK9i induces reprogramming of the epigenetic landscape, and super-enhancer driven recovery of select oncogenes may contribute to resistance to CDK9i. PIM and PI3K represent potential targets to circumvent resistance to CDK9i in the heterogeneous landscape of DLBCL.

Keywords: BRD4; CDK9; Mediator; PI3K; Super-enhancer.


Conflict of interest statement

A.V.D. has received consulting fees from Abbvie, AstraZeneca, Bayer Oncology, BeiGene, Bristol Meyers Squibb, Genentech, Incyte, Lilly Oncology, Morphposys, Nurix, Oncovalent, Pharmacyclics and TG Therapeutics and has ongoing research funding from Abbvie, AstraZeneca, Bayer Oncology, Bristol Meyers Squibb, Cyclacel, MEI Pharma, Nurix and Takeda Oncology.

Figures

Fig. 1
Fig. 1
AZD4573 shows preclinical efficacy in DLBCL. A Cells were treated with 30 nM AZD4573 as indicated. Whole cell lysates were subjected to immunoblotting. Values for phosphorylated RNAPII are expressed numerically below the blots as a ratio of phosphorylated pRNAPII to total RNAPII, while RNAPII, MYC and MCL1 are expressed as a ratio of protein to Actin. B-C Proliferation was assessed in 9 DLBCL cell lines using a colorimetric tetrazolium-based assay, following 48-h treatment. Data is shown as mean ± SEM of three independent experiments, and a table of calculated IC50 values. IC50 was calculated using GraphPad Prism 9 software set to variable slope (four parameters). D Apoptosis was tested in 7 DLBCL cell lines treated with AZD4573, measured by flow cytometry at 24 h using Annexin-V staining. Data is shown as mean ± SEM of three independent experiments. *p < 0.05 and **p < 0.01 vs. untreated control
Fig. 2
Fig. 2
CDK9i transiently suppresses expression of oncoproteins. A OCI-LY3 and VAL cells treated with 30 nM AZD4573 or vehicle control for 3 h and subjected to proteomic analysis. Heatmap of all detected proteins is shown. Data are represented as z scores calculated from normalized protein abundance. B Volcano plot of all differentially expressed proteins common to both cell lines (|FC| ≥|1.5| treatment versus control; p ≤ 0.05). The identities of select proteins are shown. C Cell lines were treated with AZD4573 (30 nM) for 0, 3 and 8 h prior to harvest. After 8 h exposure, the compound was either washed out (w) or not (c = continuous exposure) and harvested after 24 h. Whole cell lysates were subjected to immunoblotting. D Top enriched and depleted pathways from IPA analysis of proteomics data from AZD4573-treated VAL and OCI-LY3 cells. Data is presented as a dot plot ranked by pathway Z-score, with size representing the number of genes and color indicating the -Log10 of the significance. E VAL (blue) and OCI-LY3 (red) cell were treated with AZD4573 for 0, 3 and 8 h prior to harvest. After 8 h exposure, the compound was washed out and cells were harvested after 24 h. mRNA expression of select genes was quantified by RT-PCR. Data is shown as mRNA fold change in cells treated with AZD4573 versus time-matched cells treated with DMSO. Bars represent mean ± SEM of three independent experiments. Note that plots for the gene PIM3 were separated from the other genes due to the higher y-axis scale. *p < 0.05 and **p < 0.01, AZD4573 vs. time-matched DMSO control
Fig. 3
Fig. 3
CDK9 inhibition reprograms the promoter and enhancer landscape. OCI-LY3 and VAL cells were treated with AZD4573 (30 nM) for 0, 3 and 8 h prior to harvest. After 8 h exposure, the compound was washed out and cells were harvested after 24 h. Samples were analyzed using ATAC-seq and ChIP-seq. A Differential ATAC-seq peaks were calculated using DESeq2 software (|FC| ≥|1.5|; padj ≤ 0.05). Significantly gained and lost peaks are considered regions of increased and decreased chromatin accessibility, respectively. B Table of top enriched motifs in regions of decreased chromatin accessibility in ATAC-seq. Table includes position weight matrices of nucleotide sequences comprising motifs identified using gene-based HOMER motif analysis. C Metagene analysis of normalized H3K4me3 and H3K27ac ChIP-seq signal intensity plots for all human UCSC genes ± 3 kb of the transcription start site. Gene tracks are shown highlighting the PIM3 locus. D Representative hockey stick plot of super enhancers in Val and OCI-LY3 cell lines. Enhancers were identified and ranked based on H3K27ac ChIP-seq read density as a percentage of total signal, and labeled with the nearest gene. Enhancer ranking was carried out using the ROSE2 algorithm with default parameters. The number of super enhancers per sample is shown in black. SE-associated genes are depicted as red dots. Ranks of 5 top SE-associated oncogenes are included in parenthesis. E Heatmap depicting Z-score of genes with differential SEs in VAL cells at 24 versus 0 h of treatment with AZD4573, performed in duplicate
Fig. 4
Fig. 4
BRD4 enhances transcriptional recovery. A OCI-LY3 cells were treated with AZD4573 for 0, 3 and 8 h prior to harvest. After 8 h exposure, the compound was washed off and cells were harvested after 24 h. Samples were analyzed by ChIP-seq for BRD4 and RBP1. Data is shown as normalized ChIP-seq signal intensity plots for all human UCSC genes ± 2 kb, as well as snapshots of select gene tracks. B DLBCL cell lines were treated with AZD4573 (3 nM) and the BET-bromodomain inhibitor JQ1 (50 nM) as single agents or in combination for 48 h. Proliferation was analyzed using a colorimetric tetrazolium-based assay. Data is shown as mean ± SEM of three independent experiments. *p < 0.05 and **p < 0.01 vs. untreated control unless otherwise notated. C Gene expression fold change of select genes following treatment with AZD4573 at 30 nM, JQ1 at 1 µM, or a combination of the two in VAL and OCI-LY3 cell lines, determined by RT-PCR. Cells were treated for 0, 3 and 8 h prior to harvest. After 8 h exposure, the compound was either washed out (w) or not (c = continuous exposure) and cells were harvested after 24 h. Data is shown as mean ± SEM of three independent experiments. *p < 0.05 and **p < 0.01 vs. time-matched DMSO control
Fig. 5
Fig. 5
The Mediator complex regulates response to CDK9i. Genome-wide loss of function CRISPR library screening was carried out in U-2932 and SU-DHL-10 cell lines as described in the methods. Data was analyzed using the MaGeCK pipeline. A Volcano plot of library screen data in SU-DHL-10 and U-2932 cells. Dots represent the log2(mid fold change) vs. –log10(mid p-value) of all sgRNA for one gene in CDK9i-treated cells versus control. Genes with a fold change significance of p < 0.1 are depicted in blue and select genes are highlighted in red and identified with a label. B-C Gene set enrichment analysis of the library screening was carried out with WebGestalt software. B Enrichment plots from U-2932 cells using the Cellular Component gene ontology. C Significantly enriched gene sets in SU-DHL-10 and U2932 cells are shown as bar graphs using the Cellular Component gene ontology. D MED12 knockout was established in U-2932 and VAL cells using RNP electroporation as described in the methods. Whole cell lysates were subjected to immunoblotting. Cells were treated with AZD4573 or vehicle control at the indicated concentrations for 48 h. Proliferation was quantified using a colorimetric tetrazolium-based assay. Mean ± SEM is shown. *p < 0.05 and **p < 0.01 vs. NT control. A table of IC50 values is included to the right
Fig. 6
Fig. 6
Combination strategies to overcome resistance to CDK9i. A DLBCL cell lines were treated with the CDK9 inhibitor AZD4573 and/or the PIM family inhibitor AZD1208, or the PIM1 inhibitor SGI1776, as single agents or in combination at the indicated doses for 48 h. Proliferation was analyzed using a colorimetric tetrazolium-based assay. Data is shown as mean ± SEM of three independent experiments. *p < 0.05 and **p < 0.01 vs. untreated control unless otherwise notated. B Primary MCL cells were co-cultured with CD40 ligand expressing stroma for 24 h then were treated with AZD4573, AZD1208, or SGI1776 as single agents or in combination for 48 h. Apoptosis was determined by flow cytometry using Annexin-V-FITC staining. Data is from three patient samples. *p < 0.05 and **p < 0.01. C DLBCL cell lines were treated with the CDK9 inhibitor AZD4573 (3 nM) and/or the PI3K inhibitor AZD8835 (100 nM) as single agents or in combination for 48 h. Proliferation was analyzed using a colorimetric tetrazolium-based assay. Data is shown as mean ± SEM of three independent experiments. *p < 0.05 and **p < 0.01 vs. untreated control unless otherwise notated. D Primary MCL cells were co-cultured with CD40 ligand expressing stroma for 24 h then were treated with the CDK9 inhibitor AZD4573 or the PI3K inhibitor AZD8835 as single agents or in combination for 48 h. Apoptosis was determined by flow cytometry using Annexin-V-FITC staining. Data is from five patient samples. *p < 0.05 and **p < 0.01. E–F Mice were inoculated with OCI-LY3 cells as described in the methods. Once tumor volume reached 100 mm3, mice began treatment with AZD4573 (15 mg/kg; IP; once weekly), copanlisib (15 mg/kg; IP; twice weekly), a combination of both, or vehicle control. E Tumor growth starting from the first day of engraftment is shown. Data is represented as mean ± SEM of 10 tumors. *p < 0.05 and **p < 0.01, combo treatment versus control. F Kaplan–Meier survival curve is shown, significance determined by Log-rank test

References

    1. Malumbres M, Barbacid M. Cell cycle, CDKs and cancer: a changing paradigm. Nat Rev Cancer. 2009;9:153–166. doi: 10.1038/nrc2602. - DOI - PubMed
    1. Hashiguchi T, Bruss N, Best S, Lam V, Danilova O, Paiva CJ, Wolf J, Gilbert EW, Okada CY, Kaur P, et al. Cyclin-Dependent Kinase-9 Is a Therapeutic Target in MYC-Expressing Diffuse Large B-Cell Lymphoma. Mol Cancer Ther. 2019;18:1520–1532. doi: 10.1158/1535-7163.MCT-18-1023. - DOI - PubMed
    1. Anshabo AT, Milne R, Wang S, Albrecht H. CDK9: A Comprehensive Review of Its Biology, and Its Role as a Potential Target for Anti-Cancer Agents. Front Oncol. 2021;11:678559. doi: 10.3389/fonc.2021.678559. - DOI - PMC - PubMed
    1. Donati B, Lorenzini E, Ciarrocchi A. BRD4 and Cancer: going beyond transcriptional regulation. Mol Cancer. 2018;17:164. doi: 10.1186/s12943-018-0915-9. - DOI - PMC - PubMed
    1. Donner AJ, Ebmeier CC, Taatjes DJ, Espinosa JM. CDK8 is a positive regulator of transcriptional elongation within the serum response network. Nat Struct Mol Biol. 2010;17:194–201. doi: 10.1038/nsmb.1752. - DOI - PMC - PubMed

Publication types

MeSH terms

Substances

LinkOut - more resources