. 2023 Mar 31;42(1):78.
doi: 10.1186/s13046-023-02637-w.

Methylglyoxal: a novel upstream regulator of DNA methylation

Affiliations

Methylglyoxal: a novel upstream regulator of DNA methylation

Gaurav Dube et al. J Exp Clin Cancer Res. .

Abstract

Background: Aerobic glycolysis, also known as the Warburg effect, is predominantly upregulated in a variety of solid tumors, including breast cancer. We have previously reported that methylglyoxal (MG), a very reactive by-product of glycolysis, unexpectedly enhanced the metastatic potential in triple negative breast cancer (TNBC) cells. MG and MG-derived glycation products have been associated with various diseases, such as diabetes, neurodegenerative disorders, and cancer. Glyoxalase 1 (GLO1) exerts an anti-glycation defense by detoxifying MG to D-lactate.

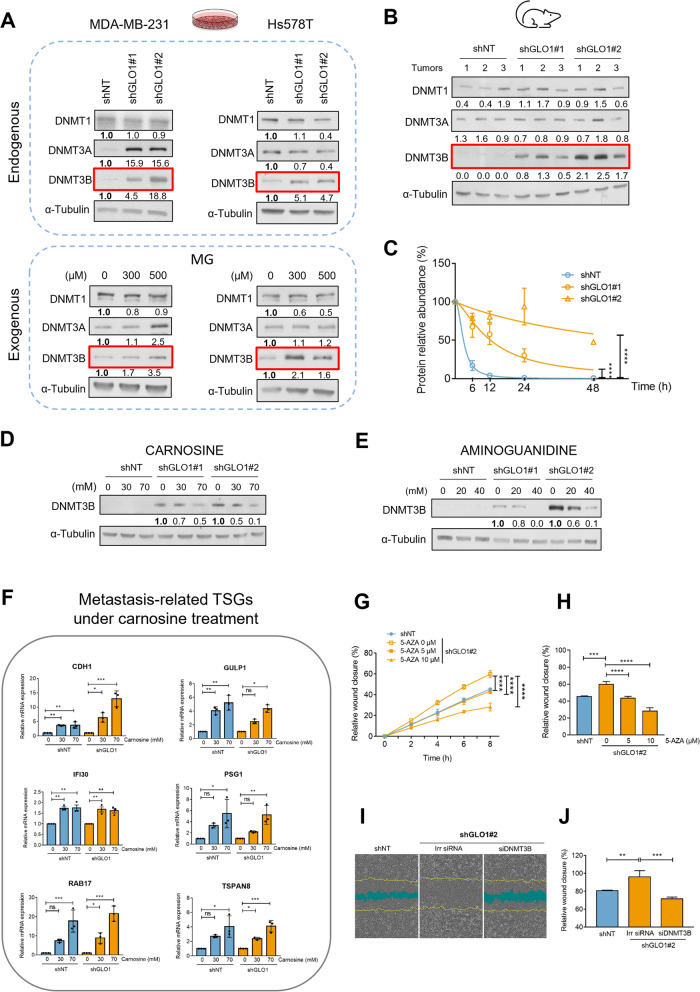
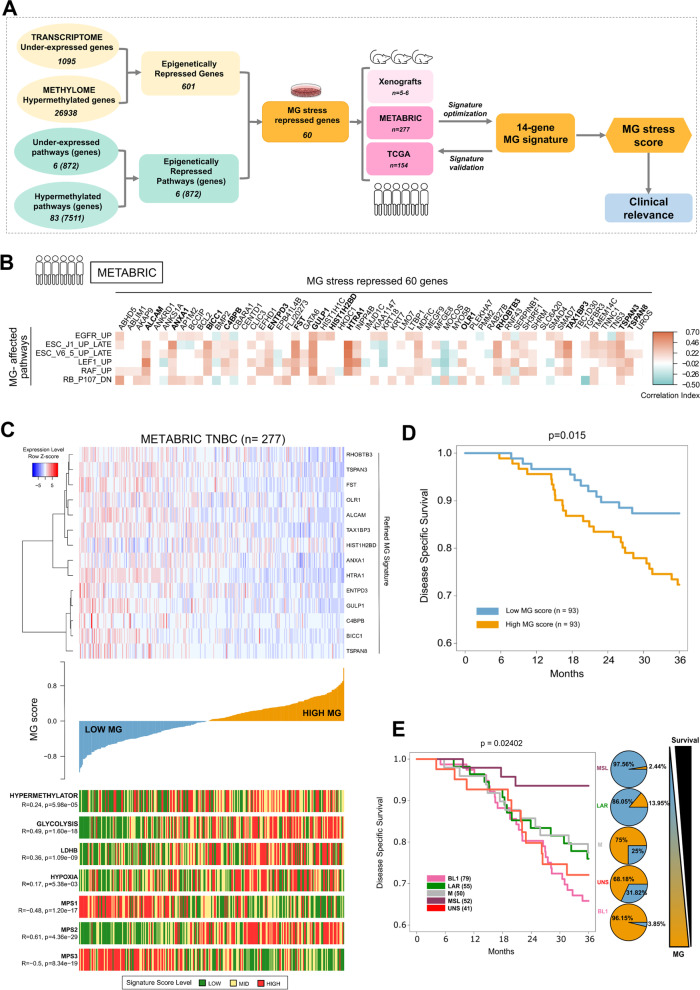
Methods: Here, we used our validated model consisting of stable GLO1 depletion to induce MG stress in TNBC cells. Using genome-scale DNA methylation analysis, we report that this condition resulted in DNA hypermethylation in TNBC cells and xenografts.

Results: GLO1-depleted breast cancer cells showed elevated expression of DNMT3B methyltransferase and significant loss of metastasis-related tumor suppressor genes, as assessed using integrated analysis of methylome and transcriptome data. Interestingly, MG scavengers revealed to be as potent as typical DNA demethylating agents at triggering the re-expression of representative silenced genes. Importantly, we delineated an epigenomic MG signature that effectively stratified TNBC patients based on survival.

Conclusion: This study emphasizes the importance of MG oncometabolite, occurring downstream of the Warburg effect, as a novel epigenetic regulator and proposes MG scavengers to reverse altered patterns of gene expression in TNBC.

Keywords: Breast cancer; DNA methylation; Metastasis; Methylglyoxal; Tumor suppressor genes.


Conflict of interest statement

None of the authors have a conflict of interest.

Figures

Fig. 1
Fig. 1
GLO1-depleted MDA-MB-231 breast cancer cells exhibit major DNA hypermethylation and loss of metastasis-related TSGs. A andPie charts summarizing the proportion of hypomethylation (FDR < 0.05, Δβ < -0.2) and hypermethylation (FDR < 0.05, Δβ > 0.2) within differentially methylated CpGs (DMCs) found in MDA-MB-231 cells and mouse xenografts, respectively. Heatmap representing unsupervised clustering of DMCs (rows) identified between control (shNT, n = 3) and GLO1-depleted (shGLO1, n = 6) cells (columns) and their corresponding status in xenograft methylation data. Color key scale blue: low methylation and orange: high methylation. D Proportion of hypo- and hypermethylated DMCs distributed across the genome regulatory regions. Mixed regions correspond to Infinium array probes referring to either promoter or enhancer, according to the considered cell line. E Tumor suppressor gene activated (TSG-A) and oncogene inhibited (OG-I) pathways enriched in genes that were affected by hypermethylation in GLO1-depleted cells as estimated from GSEA tool enrichment scores (with FDR < 0.05). For example, P53 knockdown led to down expression of genes that composed the P53 TSG pathway (‘P53_DN.V1_DN’) whose activation (TSG-A) was affected by high methylation (enrichment score). Please refer to Data S8 for more details on TSG-A and OG-I pathways. F Representative metastasis-related TSGs that were hypermethylated and low expressed under MG stress. Data represent the mean values ± SEM of three independent experiments and were analyzed using a one-way analysis of variance (ANOVA) followed by a Dunnett test (** p < 0.01, *** p < 0.001 and **** p < 0.0001)
Fig. 2
Fig. 2
MG stress induces the overexpression of DNMT3B that is reversed using MG scavengers and that mediates enhanced migratory capacity of GLO1-depleted cells.A Among DNMTs, endogenous MG stress consistently increased DNMT3B protein levels across GLO1-depleted (shGLO1 #1 and #2) MDA-MB-231 and Hs578T TNBC breast cancer cells as assessed using western blot on total protein cell extracts and compared with control (shNT) cells. Additionally, exogenous MG treatment significantly up regulated DNMT3B levels in both breast cancer cell lines $, †. B Among DNMTs, expression of DNMT3B was elevated in shGLO1 (n = 6) when compared with shNT mouse xenografts (n = 3), as assessed using western blot on total protein tumor extracts . C DNMT3B protein abundance, in presence of cycloheximide (10 μg/mL) at the indicated timing, in shNT MDA-MB-231 cells demonstrated shorter DNMT3B half-life contrasting with GLO1-depleted cells. Data are represented as means ± SEM of three independent experiments and were analyzed using two-way analysis of variance (ANOVA) followed by Dunnett test (**** p < 0.0001). Corresponding western blots are shown in Fig. S2C. D and E Carnosine (48 h) and aminoguanidine (24 h) treatments significantly reduced DNMT3B protein expression in a dose-dependent manner in GLO1-depleted MDA-MB-231 cells, respectively $, †. F Carnosine re-induces the expression of metastasis-related TSGs under study in MDA-MB-231 cells as assessed using RT-QPCR §. G The migratory capacity of GLO1-depleted MDA-MB-231 cells was evaluated upon 5-AZA treatment (72 h) using a scratch wound assay under Incucyte® life cell microscopy. Results are given as a percentage of relative wound closure over time for shGLO1#2 $, ¥. H Relative wound closure at 8 h time point post scratch in shGLO1#2 cells treated with increasing doses of 5-AZA $, ‡. I Representative pictures illustrating the wound closure at 8 h post scratch of MDA-MB-231 shGLO1#2 cells silenced (siDNMT3B) or not (Irr siRNA) for DNMT3B and compared to shNT cells. J Migratory capacity (8 h time point) of MDA-MB-231 shGLO1#2 cells upon DNMT3B silencing $, . $ One of three experiments is shown. † Alpha-tubulin was used as a loading control. Data represent the mean values ± SD of three technical replicates and were analyzed using a one-way analysis of variance (ANOVA) followed by a Dunnett test (** p < 0.01, *** p < 0.001, **** p < 0.0001). § Data represent the mean values ± SEM of three independent experiments and were analyzed using a one-way analysis of variance (ANOVA) followed by a Dunnett test (* p < 0.05, ** p < 0.01, *** p < 0.001 and ns: not significant). ¥ Data represent the mean values ± SD of three technical replicates and were analyzed using a two-way analysis of variance (ANOVA) followed by a Dunnett test (**** p < 0.0001)
Fig. 3
Fig. 3
Integrative analysis of DNA methylation and gene expression data identifies a 14-gene signature of MG stress with clinical relevance.A Workflow showing the integration of differential gene expression, methylation and their corresponding GSEA pathway enrichment under MG stress condition. This integration led to the selection of 60 potential candidates that represented genes repressed under MG stress. These 60 genes were validated in xenografts and refined further using pathway correlation approach (detailed in Material and Methods) using TNBC patient data from METABRIC cohort. This resulted in a final 14-gene based signature of MG stress. Next, MG score was derived from this MG signature and was evaluated for its clinical relevance in TNBC patients. The numbers in the yellow boxes correspond to the genes resulting from the indicated analysis. The numbers in the green boxes represent GSEA pro-oncogenic pathways with their respective total number of genes specified between brackets. B Signature optimization data are represented in a heatmap showing correlation between the six MG stress-affected pathways (rows) and 60 integration genes (columns) using METABRIC TNBC patient cohort. Genes with statistically significant correlation greater than 0.25 with at least one of the pathways were selected for composing the final MG signature. The outcome of this optimization step is 14 genes highlighted in bold in the columns and composing MG signature (detailed in Material and Methods). Positive and negative correlations are shown in red and cyan colors, respectively. Insignificant correlation values (p-value > 0.05 or correlation coefficient = 0) are shown as white boxes. C Top panel represents a heatmap of the 14-gene MG signature in METABRIC TNBC patients (n = 277). Middle panel shows the waterfall plot representing TNBCs distribution from low to high MG score (Y-axis). Bottom panel represents signature status of hypermethylator phenotype [27], metabolic glycolysis and hypoxia signatures based on Reactome gene lists, LDHB gene expression, and metabolic-pathway-based subtypes (MPS1, MPS2, MPS3) [53]. All these signature scores are represented as low (green), mid (yellow) and high (red) level and their respective Spearman correlation (R) with p-values is given when compared to MG signature score. D Kaplan–Meier curves showing significant differences (p = 0.015) in disease specific survival between low (n = 93) and high (n = 93) MG score TNBC tumors from METABRIC cohort. E Kaplan–Meier curves showing significant differences of disease specific survival across Lehmann subtypes using METABRIC TNBC cohort with respective MG score status highlighted in the pie plots shown beside. As MG score increases the survival probability decreases, with patients bearing BL1 and UNS tumor subtypes being among the worst survivors. Respective number of patients for each TNBC subtype are mentioned in parentheses

Similar articles

Cited by

References

    1. Vander Heiden MG, DeBerardinis RJ. Understanding the intersections between metabolism and cancer biology. Cell. 2017;168(4):657–669. doi: 10.1016/j.cell.2016.12.039. - DOI - PMC - PubMed
    1. Phillips SA, Thornalley PJ. The formation of methylglyoxal from triose phosphates. Investigation using a specific assay for methylglyoxal. Eur J Biochem. 1993;212(1):101–5. doi: 10.1111/j.1432-1033.1993.tb17638.x. - DOI - PubMed
    1. Thornalley PJ. The glyoxalase system in health and disease. Mol Aspects Med. 1993;14(4):287–371. doi: 10.1016/0098-2997(93)90002-U. - DOI - PubMed
    1. Nokin MJ, Durieux F , Peixoto P, Chiavarina B, Peulen O, Blomme A, et al. Methylglyoxal, a glycolysis side-product, induces Hsp90 glycation and YAP-mediated tumor growth and metastasis. eLife. 2016;5:19375. doi: 10.7554/eLife.19375. - DOI - PMC - PubMed
    1. Nokin MJ, Durieux F, Bellier J, Peulen O, Uchida K, Spiegel DA, et al. Hormetic potential of methylglyoxal, a side-product of glycolysis, in switching tumours from growth to death. Sci Rep. 2017;7(1):11722. doi: 10.1038/s41598-017-12119-7. - DOI - PMC - PubMed