. 2023 May;10(15):e2207417.
doi: 10.1002/advs.202207417. Epub 2023 Mar 30.

Tumor Immunophenotyping-Derived Signature Identifies Prognosis and Neoadjuvant Immunotherapeutic Responsiveness in Gastric Cancer

Affiliations

Tumor Immunophenotyping-Derived Signature Identifies Prognosis and Neoadjuvant Immunotherapeutic Responsiveness in Gastric Cancer

Jia-Bin Wang et al. Adv Sci (Weinh). 2023 May.

Abstract

The effectiveness of neoadjuvant immune checkpoint inhibitor (ICI) therapy is confirmed in clinical trials; however, the patients suitable for receiving this therapy remain unspecified. Previous studies have demonstrated that the tumor microenvironment (TME) dominates immunotherapy; therefore, an effective TME classification strategy is required. In this study, five crucial immunophenotype-related molecules (WARS, UBE2L6, GZMB, BATF2, and LAG-3) in the TME are determined in five public gastric cancer (GC) datasets (n = 1426) and an in-house sequencing dataset (n = 79). Based on this, a GC immunophenotypic score (IPS) is constructed using the least absolute shrinkage and selection operator (LASSO) Cox, and randomSurvivalForest. IPSLow is characterized as immune-activated, and IPSHigh is immune-silenced. Data from seven centers (n = 1144) indicate that the IPS is a robust and independent biomarker for GC and superior to the AJCC stage. Furthermore, patients with an IPSLow and a combined positive score of ≥5 are likely to benefit from neoadjuvant anti-PD-1 therapy. In summary, the IPS can be a useful quantitative tool for immunophenotyping to improve clinical outcomes and provide a practical reference for implementing neoadjuvant ICI therapy for patients with GC.

Keywords: gastric cancer; immune contexture; neoadjuvant immune checkpoint inhibitor therapy; prognosis; tumor microenvironment.


Conflict of interest statement

The authors declare no conflict of interest.

Figures
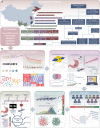
Figure 1
Figure 1
The overall design of the study. GC, Gastric Cancer; DEGs, Differentially Expressed Genes; WTS, Whole‐Transcriptome Sequencing; IHC, Immunohistochemistry; IPS, Immunophenotypic Score; mIHC, Multiplex Immunohistochemistry Staining; TRG, Tumor Regression Grade; CPS, Combined Positive Score.
Figure 2
Figure 2
Data from four cohorts consisting of seven independent medical centers confirm the prognostic value of IPS for GC (A–D). Time‐dependent ROC curves of four cohorts demonstrate the accuracy and stability of IPS in predicting the prognosis. E–H) Comparison of the prognostic value of the IPS versus clinicopathological features in four cohorts by ROC curves. I–L) Kaplan–Meier curves for OS according to the IPS in four cohorts (log‐rank test, all p < 0.001). M,N) Univariate and multivariate Cox regression analysis was performed to explore the prognostic value of IPS (all p < 0.001). Variables with statistical significance in the univariate analysis were integrated into the multivariate analysis. In addition, the results of other clinicopathological variables are presented in Figure S6, Supporting Information. The dotted line represents the hazard ratio (HR) = 1. Training Cohort: n = 506, Central China Cohort: n = 178, North China Cohort: n = 194, South China Cohort: n = 166.
Figure 3
Figure 3
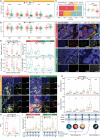
The IPS‐specific landscape of the tumor immune microenvironment. A) Comparison of immune infiltration in the core of the tumor (CT; CD3+, CD4+, CD8+, CD45RO+, and FOXP3+) between the IPSLow and IPSHigh in the Discovery Cohort (n = 253, IPSLow = 115, IPSHigh = 138). ***p < 0.001; ****p < 0.0001, Mann–Whitney U‐test. B) Comparing the ratio of immune cell infiltration (CD3+, CD4+, CD8+, CD45RO+, and FOXP3+) in the CT to the invasive margin (IM) between the IPSLow and IPSHigh. Cases with density <5 cells/mm2 were excluded to reduce the abnormal oversize/undersize ratio (CD3+: n = 251, CD4+: n = 244, CD8+: n = 239, CD45RO+: n = 249, FOXP3+: n = 130). *p < 0.05; ***p < 0.001, Mann–Whitney U‐test. C) Components of the immunophenotypes (Inflamed, Excluded, and Desert) of IPSLow versus IPSHigh (p < 0.001, χ 2 test), while comparing the IPS between the three immunophenotypes. ****p < 0.0001, Mann–Whitney U‐test. D) Multiplexed immunohistochemical staining was used to visualize the effector T cells (Teffs; GZMB+CD8+) in the CT of IPSLow versus IPSHigh, and panCK+ was used to segment the tumor nest and stroma (CD8‐red, GZMB‐green, panCK‐grey, and DAPI‐blue; n = 31; scale bar = 100 µm). E) Comparison of the density and ratio (to total CD8+ cells) of Teffs in the CT between IPSLow and IPSHigh (Mann–Whitney U‐test), and the distribution characteristics of Teffs in different locations of the tumor nest and stroma (Wilcoxon matched‐pairs signed rank test). IPSLow: n = 15, IPSHigh: n = 16; *p < 0.05; **p < 0.01; ***p < 0.001. F) Multiplex immunofluorescence staining characterized the macrophage infiltration profile of IPSLow and IPSHigh in the CT and IM (CD68‐yellow, CD163‐cyan, CD206‐red, INOS‐green, panCK‐grey, and DAPI‐blue; n = 31, scale bar = 100 µm). G) Comparison of the density of different macrophage subtypes between IPSLow and IPSHigh in the CT (upper panel) and IM (lower panel). The red dotted line represents the margin between the tumor and normal tissue (IPSLow: n = 15, IPSHigh: n = 16). *p < 0.05; **p< 0.01; ***p < 0.001; ****p < 0.0001, Mann–Whitney U‐test. H) Differences in the ratio of M1 to M2 macrophages in IPSLow versus IPSHigh. Greater than 1 means more M1‐like, and less than 1 means more M2‐like (IPSLow: n = 15, IPSHigh: n = 16). *p < 0.05; ****p < 0.0001, Mann–Whitney U‐test. I) Distribution tendency of different macrophage subsets in IPSLow and IPSHigh tumors. *p < 0.05; ** p < 0.01, Wilcoxon matched‐pairs signed rank test. In all box plots of this figure, the thick line shows the median value. The bottom and top of the boxes are the 25th and 75th percentile (interquartile range) and extend through the whiskers to 1.5 times the interquartile range.
Figure 4
Figure 4
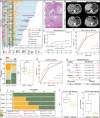
IPS accurately predicts the neoadjuvant ICI therapy response. A) Overview of treatment for patients with locally advanced GC receiving neoadjuvant ICI therapy (n = 52). B) Composition of TRG to neoadjuvant ICI therapy in IPSLow (n = 24) versus IPSHigh (n = 26; p = 0.040, Fisher's exact test). Moreover, the IPS was compared between TRG 1a/1b and TRG 3/4 patients (p < 0.001, Mann–Whitney U‐test). The thick line shows the median value. The bottom and top of the boxes are the 25th and 75th percentile (interquartile range) and extend through the whiskers to 1.5 times the interquartile range. C) Postoperative pathological tissue images of no. 40 (upper panel, IPSLow) and no. 47 (lower panel, IPSHigh). Patient no. 40 had a completely regressed tumor (TRG1a), while patient no. 47 still had a residual tumor (TRG 3). Scale bar = 50 µm. D) CT imaging changed before and after neoadjuvant ICI therapy in patient no. 40 (IPSLow) and patient no. 47 (IPSHigh). E) Kaplan–Meier survival analysis demonstrated recurrence in IPSLow versus IPSHigh patients (p = 0.048, log‐rank test). F,G) Comparing the accuracy of biomarkers (IPS, CPS, and Inflamed phenotype) in predicting the response to neoadjuvant ICI therapy by ROC curves. H) Univariate and multivariate logistic regression analysis to confirm the value of biomarkers (IPS, CPS, and Inflamed phenotype) for predicting neoadjuvant ICI therapy (outcome: TRG1a/1b). OR: Odd Ratio. I) Comparison of the TRG to neoadjuvant ICI therapy across Type A (IPSLow with CPS ≥ 5), Type B (IPSLow with CPS < 5), Type C (IPSHigh with CPS ≥ 5), and Type D (IPSHigh with CPS < 5). J) Comparison of IPS and LAG‐3 in TRG1a/1b (n = 9) and TRG2/3 (n = 10) patients with GC with CPS ≥ 5 and inflamed phenotype (n total = 19). ***p < 0.001, Mann–Whitney U‐test. The thick line shows the median value. The bottom and top of the boxes are the 25th and 75th percentile (interquartile range) and extend through the whiskers to 1.5 times the interquartile range.
Figure 5
Figure 5
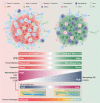
Schematic illustration of the characteristics associated with the immunophenotypic score (IPS) in this study.

References

    1. Petricevic B., Kabiljo J., Zirnbauer R., Walczak H., Laengle J., Bergmann M., Semin. Cancer Biol. 2022, 86, 834. - PubMed
    1. Eso Y., Seno H., Therap. Adv. Gastroenterol. 2020, 13, 175628482094877. - PMC - PubMed
    1. Lee K. W., Van Cutsem E., Bang Y. J., Fuchs C. S., Kudaba I., Garrido M., Chung H. C., Lee J., Castro H. R., Chao J., Wainberg Z. A., Cao Z. A., Aurora‐Garg D., Kobie J., Cristescu R., Bhagia P., Shah S., Tabernero J., Shitara K., Wyrwicz L., Clin. Cancer Res. 2022, 28, 3489. - PubMed
    1. Kang Y., Chen L., Ryu M., Oh D., Oh S., Chung H., Lee K., Omori T., Shitara K., Sakuramoto S., Chung I., Yamaguchi K., Kato K., Sym S., Kadowaki S., Tsuji K., Chen J., Bai L., Oh S., Choda Y., Yasui H., Takeuchi K., Hirashima Y., Hagihara S., Boku N., Lancet Oncol. 2022, 23, 234. - PubMed
    1. a) Shitara K., Ajani J. A., Moehler M., Garrido M., Gallardo C., Shen L., Yamaguchi K., Wyrwicz L., Skoczylas T., Bragagnoli A. C., Liu T., Tehfe M., Elimova E., Bruges R., Zander T., de Azevedo S., Kowalyszyn R., Pazo‐Cid R., Schenker M., Cleary J. M., Yanez P., Feeney K., Karamouzis M. V., Poulart V., Lei M., Xiao H., Kondo K., Li M., Janjigian Y. Y., Nature 2022, 603, 942; - PMC - PubMed
    2. b) Xu J., Jiang H., Pan Y., Gu K., Cang S., Han L., Shu Y., Li J., Zhao J., Pan H., Luo S., Qin Y., Guo Q., Bai Y., Ling Y., Guo Y., Li Z., Liu Y., Wang Y., Zhou H., Ann. Oncol. 2021, 32, S1331.

Publication types