Simulating Highly Activated Sticking of H2 on Al(110): Quantum versus Quasi-Classical Dynamics
- PMID: 36998253
- PMCID: PMC10041643
- DOI: 10.1021/acs.jpcc.3c00426
Simulating Highly Activated Sticking of H2 on Al(110): Quantum versus Quasi-Classical Dynamics
Abstract
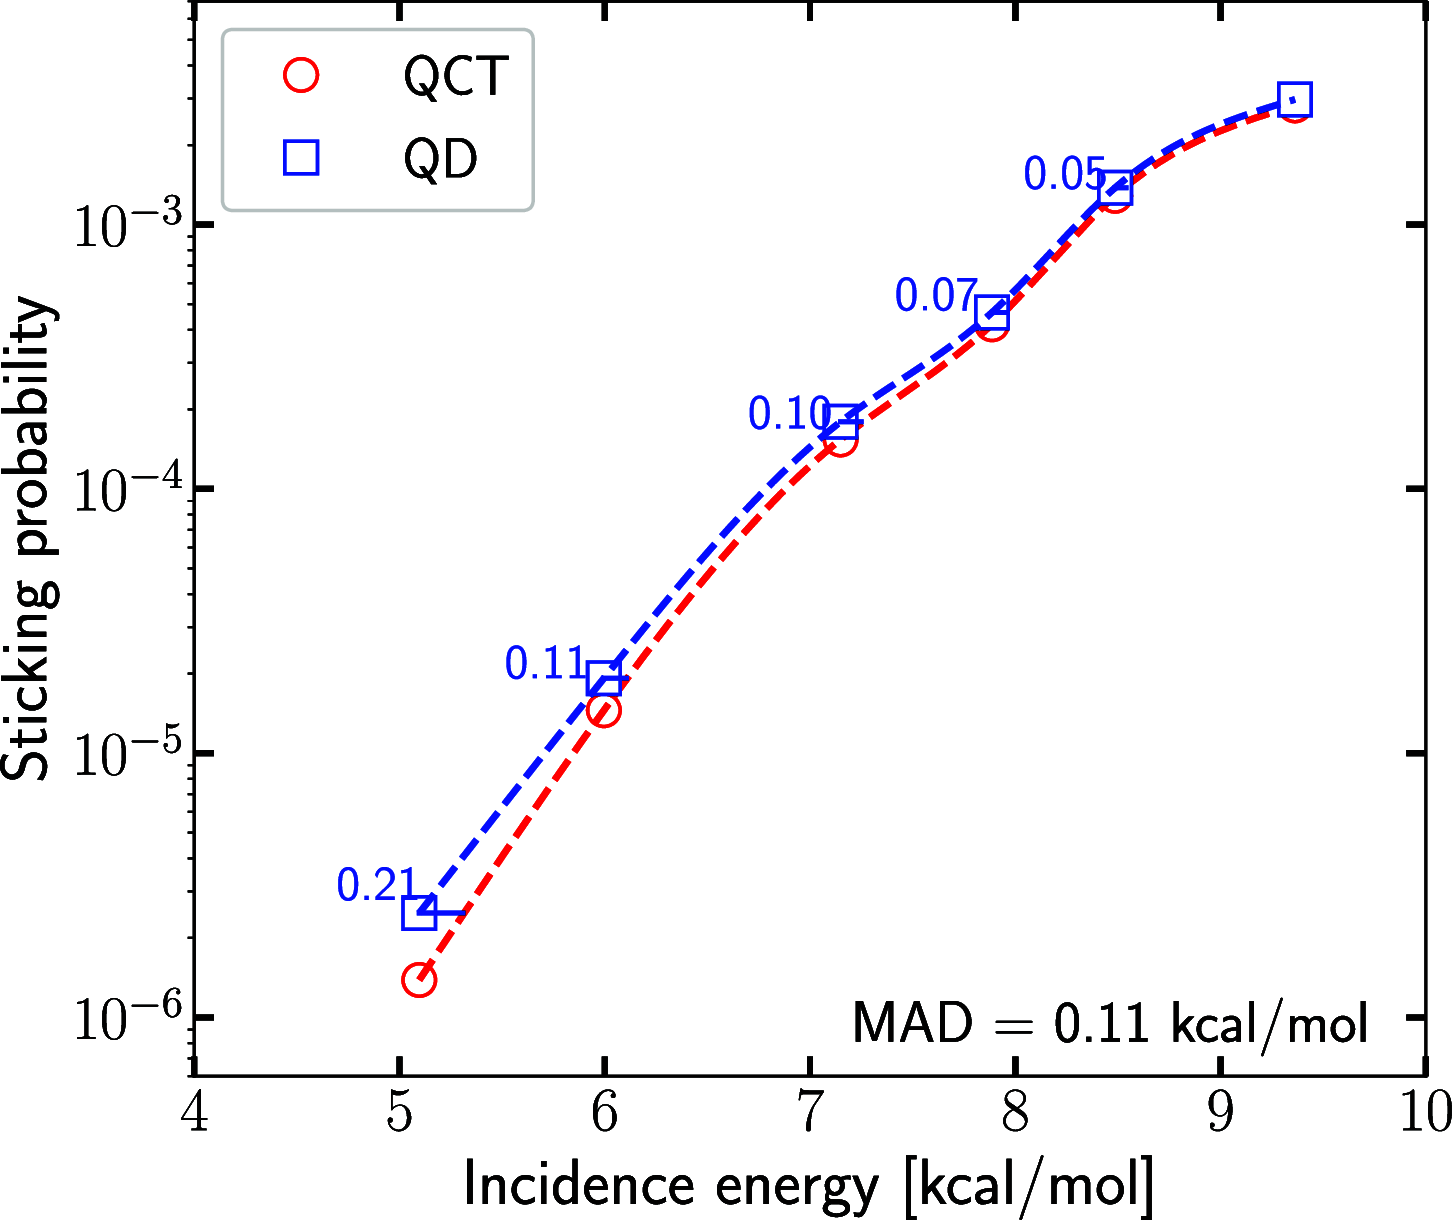
We evaluate the importance of quantum effects on the sticking of H2 on Al(110) for conditions that are close to those of molecular beam experiments that have been done on this system. Calculations with the quasi-classical trajectory (QCT) method and with quantum dynamics (QD) are performed using a model in which only motion in the six molecular degrees of freedom is allowed. The potential energy surface used has a minimum barrier height close to the value recently obtained with the quantum Monte Carlo method. Monte Carlo averaging over the initial rovibrational states allowed the QD calculations to be done with an order of magnitude smaller computational expense. The sticking probability curve computed with QD is shifted to lower energies relative to the QCT curve by 0.21 to 0.05 kcal/mol, with the highest shift obtained for the lowest incidence energy. Quantum effects are therefore expected to play a small role in calculations that would evaluate the accuracy of electronic structure methods for determining the minimum barrier height to dissociative chemisorption for H2 + Al(110) on the basis of the standard procedure for comparing results of theory with molecular beam experiments.
© 2023 The Authors. Published by American Chemical Society.
Conflict of interest statement
The authors declare no competing financial interest.
Figures


 (Ei) computed
with QD (black line) and QCT (blue squares) dynamics are compared
for three different initial rovibrational states, of which (A) one
with v = 0, (B) one with v = 1,
and (C) one with v = 2.


References
-
- Wolcott C. A.; Medford A. J.; Studt F.; Campbell C. T. Degree of rate control approach to computational catalyst screening. J. Catal. 2015, 330, 197–207. 10.1016/j.jcat.2015.07.015. - DOI
-
- Sabbe M. K.; Reyniers M. F.; Reuter K. First-principles kinetic modeling in heterogeneous catalysis: an industrial perspective on best-practice, gaps, and needs. Catal. Sci. Technol. 2012, 2, 2010–2024. 10.1039/c2cy20261a. - DOI
-
- Ertl G. Primary steps in catalytic synthesis of ammonia. J. Vac. Sci. Technol. A 1983, 1, 1247–1253. 10.1116/1.572299. - DOI
-
- Chorkendorff I.; Niemantsverdriet J. W.. Concepts of Modern Catalysis and Kinetics. Student Edition ed.; Wiley-VCH Verlag GMBH & Co.: Weinheim, 2003; 452.
LinkOut - more resources
Full Text Sources
