. 2023 Mar 27;5(4):e0881.
doi: 10.1097/CCE.0000000000000881. eCollection 2023 Apr.

Sustained Perturbation of Metabolism and Metabolic Subphenotypes Are Associated With Mortality and Protein Markers of the Host Response

Affiliations

Sustained Perturbation of Metabolism and Metabolic Subphenotypes Are Associated With Mortality and Protein Markers of the Host Response

Theodore S Jennaro et al. Crit Care Explor. .

Abstract

Perturbed host metabolism is increasingly recognized as a pillar of sepsis pathogenesis, yet the dynamic alterations in metabolism and its relationship to other components of the host response remain incompletely understood. We sought to identify the early host-metabolic response in patients with septic shock and to explore biophysiological phenotyping and differences in clinical outcomes among metabolic subgroups.

Design: We measured serum metabolites and proteins reflective of the host-immune and endothelial response in patients with septic shock.

Setting: We considered patients from the placebo arm of a completed phase II, randomized controlled trial conducted at 16 U.S. medical centers. Serum was collected at baseline (within 24 hr of the identification of septic shock), 24-hour, and 48-hour postenrollment. Linear mixed models were built to assess the early trajectory of protein analytes and metabolites stratified by 28-day mortality status. Unsupervised clustering of baseline metabolomics data was conducted to identify subgroups of patients.

Patients: Patients with vasopressor-dependent septic shock and moderate organ dysfunction that were enrolled in the placebo arm of a clinical trial.

Interventions: None.

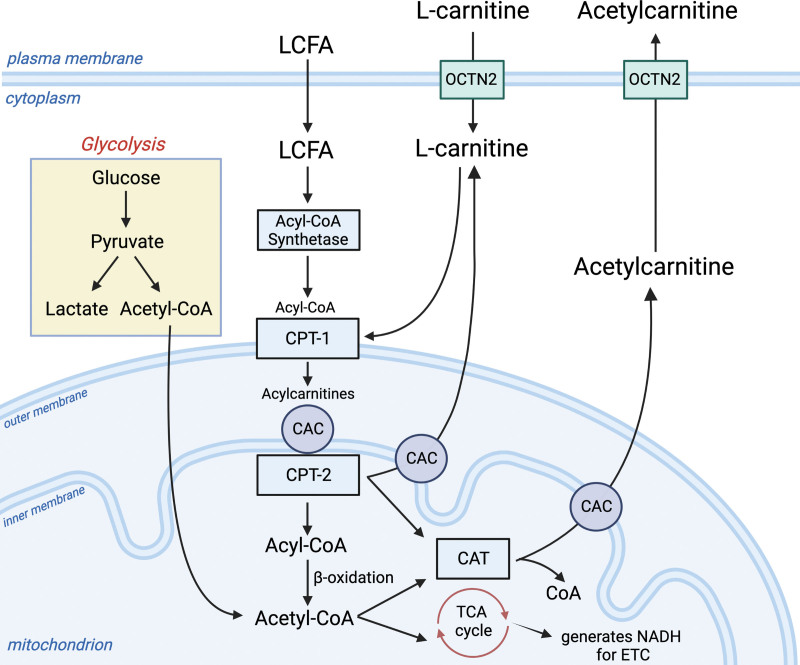
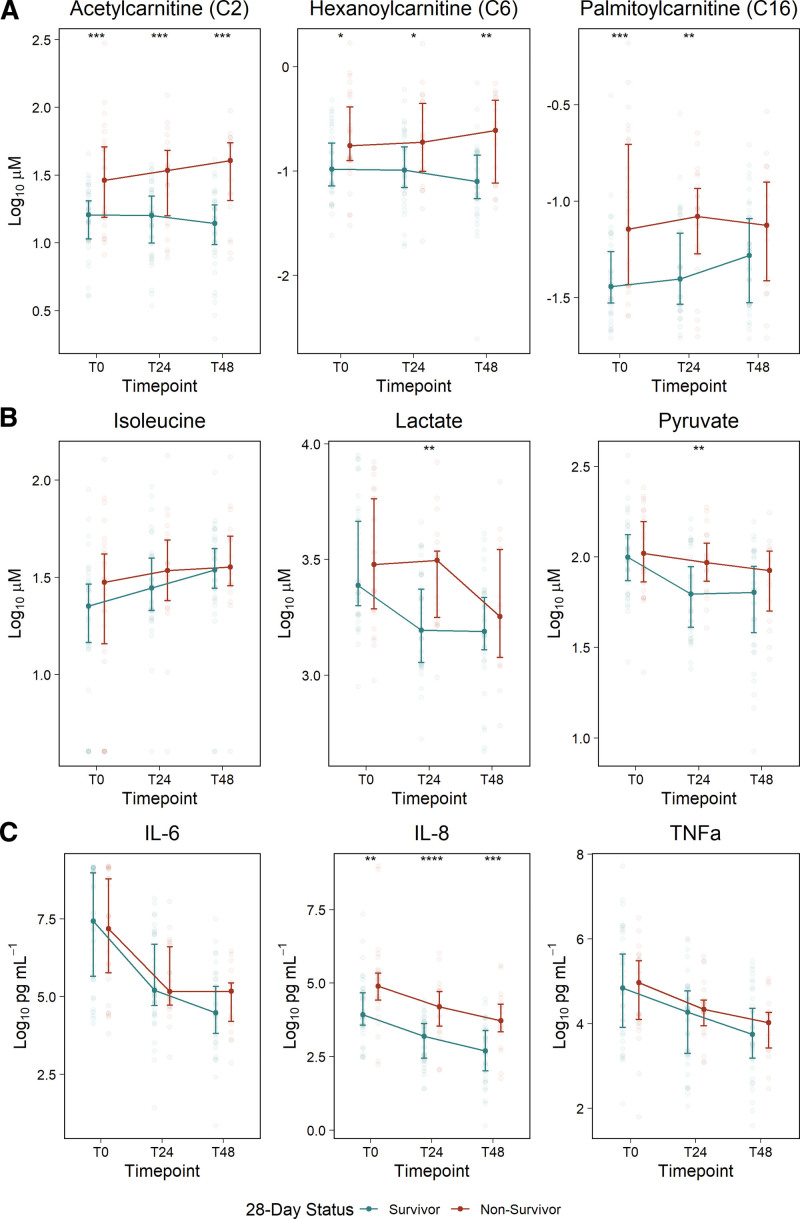
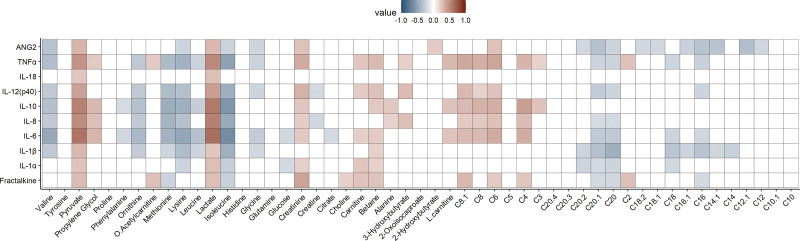
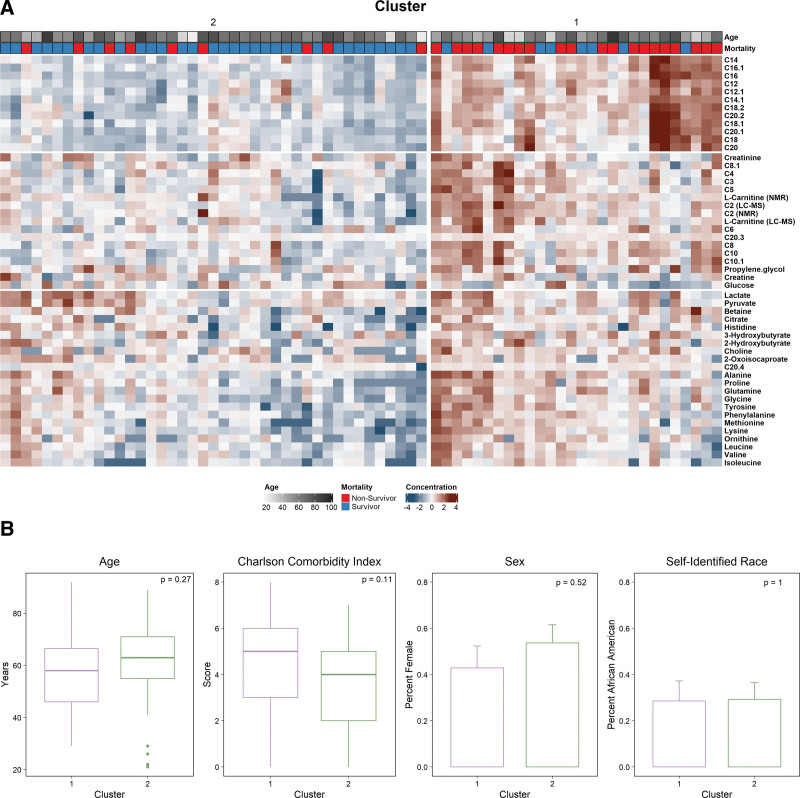
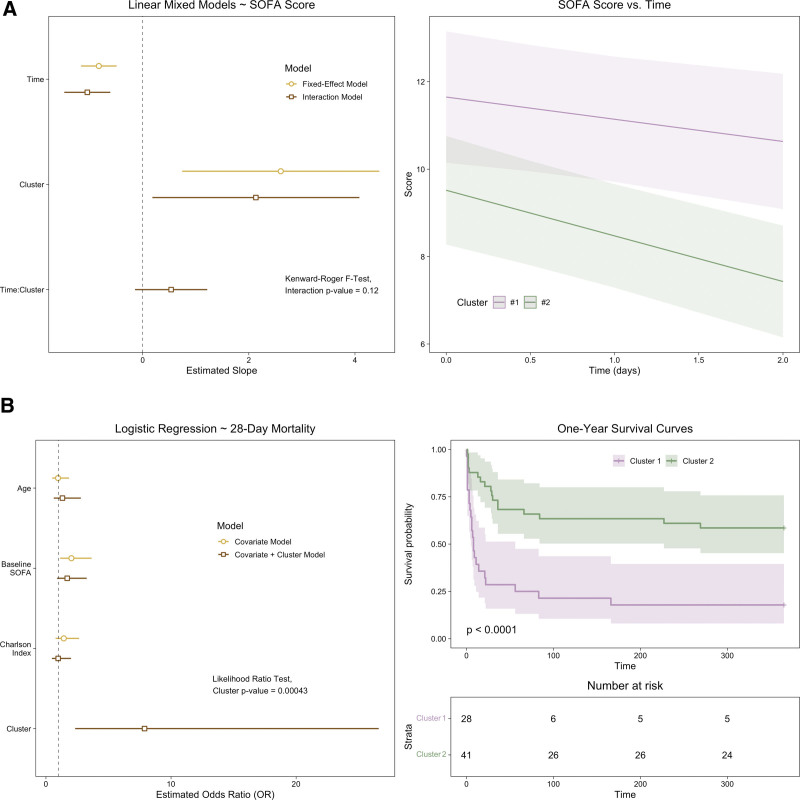
Measurements and main results: Fifty-one metabolites and 10 protein analytes were measured longitudinally in 72 patients with septic shock. In the 30 patients (41.7%) who died prior to 28 days, systemic concentrations of acylcarnitines and interleukin (IL)-8 were elevated at baseline and persisted at T24 and T48 throughout early resuscitation. Concentrations of pyruvate, IL-6, tumor necrosis factor-α, and angiopoietin-2 decreased at a slower rate in patients who died. Two groups emerged from clustering of baseline metabolites. Group 1 was characterized by higher levels of acylcarnitines, greater organ dysfunction at baseline and postresuscitation (p < 0.05), and greater mortality over 1 year (p < 0.001).

Conclusions: Among patients with septic shock, nonsurvivors exhibited a more profound and persistent dysregulation in protein analytes attributable to neutrophil activation and disruption of mitochondrial-related metabolism than survivors.

Keywords: biomarkers; chemokines; cytokines; metabolomics; precision medicine.


Conflict of interest statement

Dr. Jennaro is supported by the American Foundation of Pharmaceutical Education. The remaining authors have disclosed that they do not have any potential conflicts of interest. The content is solely the responsibility of the authors and does not necessarily represent the official views of National Institute of General Medical Sciences or the National Institutes of Health.

Figures

Figure 1.
Figure 1.
Glycolysis and mitochondrial-related metabolism. L-carnitine is required for the transport of long-chain fatty acids (LCFA) into the mitochondrion. This process enlists the carnitine shuttle, which begins with the entrance of L-carnitine into the cell from the blood through the organic cation transporter (OCTN2). LCFAs enter the cell and are converted to long-chain acyl-CoAs by acyl-CoA synthetase (EC 6.2.1.3). The L-carnitine shuttle apparatus uses L-carnitine via carnitine palmitoyl transferase 1 (CPT1; EC 2.3.1.21) to convert L-carnitine and LCFA-CoAs to acylcarnitines. The transporter, carnitine-acylcarnitine carrier (CAC; SLC25A20), moves the newly formed long-chain acylcarnitines into the mitochondrial matrix in exchange for free carnitine. Here, long-chain acyl groups are transferred back to CoA by CPT2 (EC 2.3.1.21), which regenerates Acyl-CoA for use in β-oxidation (sepsis-induced dysfunction of β-oxidation can lead to elevations in acylcarnitines). This process also generates L-carnitine. Here, L-carnitine can either be transported out of the mitochondrion by CAC or used as a substrate for carnitine acetyl-transferase (CAT; EC2.3.1.7), which converts it and Acetyl-CoA to acetylcarnitine. Acetylcarnitine moves through CAC and OCTN2 back into the bloodstream. This process may be enhanced during sepsis and times of metabolic stress, serving as a crucial sink for excess acetyl groups that may be toxic to the cell. The Acetyl-CoA produced by β-oxidation sources the tricarboxylic acid (TCA) cycle as does the Acetyl-CoA produced from the oxidative decarboxylation of pyruvate in the mitochondrial matrix. NADH = nicotinamide adenine dinucleotide (NAD) + hydrogen (H); CoA = coenzyme A; ETC = electron transport chain. This figure was created using Biorender.com.
Figure 2.
Figure 2.
Temporal changes in metabolites and inflammatory cytokines in 28-d septic shock survivors and non-survivors. The most perturbed analytes across time and 28-d mortality status measured using three analytical platforms: A, acylcarnitines measured by liquid chromatography-mass spectrometry; B, metabolites measured by nuclear magnetic resonance; and C, Proteins measured by immunoassays. Analyte concentrations at each time point are visualized with the median ± 25th and 75th percentiles, with differences between mortality groups assessed by the Mann-Whitney U test. Analytes presented here were chosen according to the rank-ordered overall p value from linear mixed modeling as described in the Materials and Methods section. IL = interleukin.
Figure 3.
Figure 3.
Repeated-measure correlations between protein and metabolite analytes. The Rmcorr R package was used to determine the repeated-measure correlation coefficient between proteins and metabolites measured across three time points. The ggcorrplot R package was used to visualize the results. Positive correlations are indicated in red, while negative correlations are shown in blue, and only significant (p < 0.05) correlation pairs are included. ANG2 = angiopoietin-2; TNFα = tumor necrosis factor-alpha; IL = interleukin.
Figure 4.
Figure 4.
Metabolite concentration and patient characteristics stratified by cluster assignment. A, Heat map comparison of metabolites stratified by cluster assignment. Concentrations of metabolites were log-transformed and z-scaled as described in the methods. Patients were clustered after principal component analysis of the baseline metabolomics data, with two groups best separating the data (cluster 1: n = 28 and cluster 2: n = 41). Patient age and 28-d mortality are shown as annotation above the heat map. B, Patient demographics, comorbidities, sex, and self-identified race stratified by metabolic cluster assignment. p values reported are from the Mann-Whitney U test or χ2, as appropriate.
Figure 5.
Figure 5.
Patient outcomes stratified by metabolic cluster assignment. A, Model coefficients (left) and predictions (right) from linear mixed models, with Sequential Organ Failure Assessment (SOFA) score as the outcome variable. The fixed-effect model included the Time when SOFA was measured and Cluster assignment. The interaction model also included the Time*Cluster interaction, and its inclusion was assessed with the Kenward-Roger F test. A, The SOFA score predictions for each cluster (cluster 1 in purple, n = 28, cluster 2 in green, n = 41) from the interaction model are shown with their 95% CI. The median and interquartile range are also plotted for each time point, with between-cluster differences assed by the Mann-Whitney U test. B, Model coefficients from logistic regression, with 28-day mortality (left) and survival curves out to 1 year (right) between clusters. The probability of 28-day mortality was modeled with a covariate model that included age, baseline SOFA score, and the Charlson Comorbidity Index. A second model added cluster assignment as a predictor variable, and the likelihood ratio test was used to determine the impact of its inclusion. Survival curves for each metabolic cluster and the number at risk were plotted and assessed with the log-rank test. Survival curves were censored at 1 yr.

References

    1. Singer M, Deutschman CS, Seymour CW, et al. : The third international consensus definitions for sepsis and septic shock (Sepsis-3). JAMA 2016; 315:801–810 - PMC - PubMed
    1. Vincent J-L, Jones G, David S, et al. : Frequency and mortality of septic shock in Europe and North America: A systematic review and meta-analysis. Crit Care 2019; 23:196. - PMC - PubMed
    1. Cavaillon J-M, Singer M, Skirecki T: Sepsis therapies: Learning from 30 years of failure of translational research to propose new leads. EMBO Mol Med 2020; 12:e10128. - PMC - PubMed
    1. Maslove DM, Tang B, Shankar-Hari M, et al. : Redefining critical illness. Nat Med 2022; 28:1141–1148 - PubMed
    1. Leligdowicz A, Matthay MA: Heterogeneity in sepsis: New biological evidence with clinical applications. Crit Care 2019; 23:80. - PMC - PubMed