Review
. 2023 Apr;57(2):51-60.
doi: 10.1007/s13139-021-00733-3. Epub 2022 Feb 28.

Preparing for the Artificial Intelligence Revolution in Nuclear Cardiology

Affiliations
Review

Preparing for the Artificial Intelligence Revolution in Nuclear Cardiology

Ernest V Garcia et al. Nucl Med Mol Imaging. 2023 Apr.

Abstract

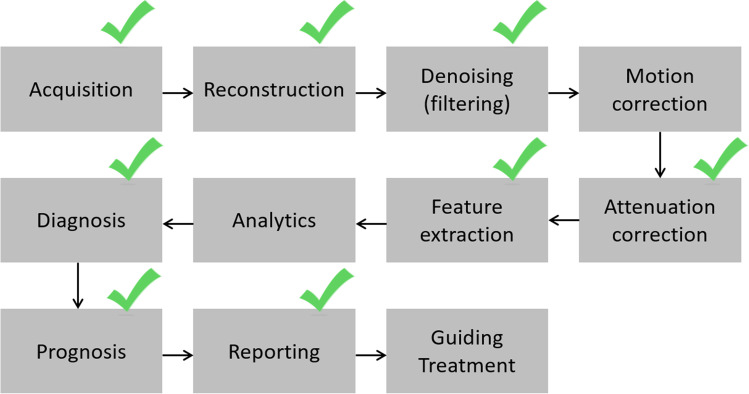
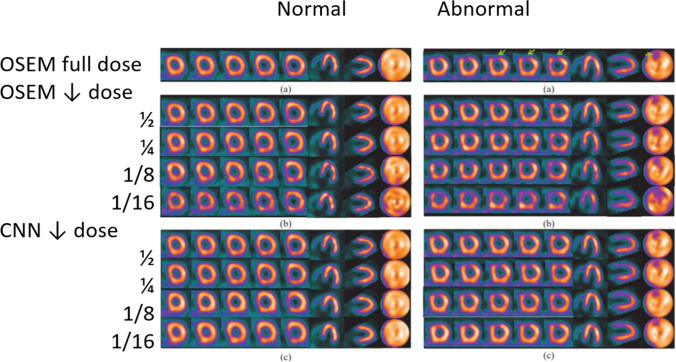
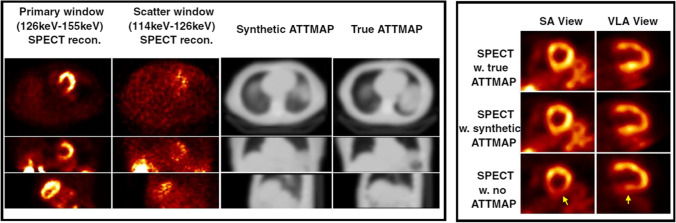
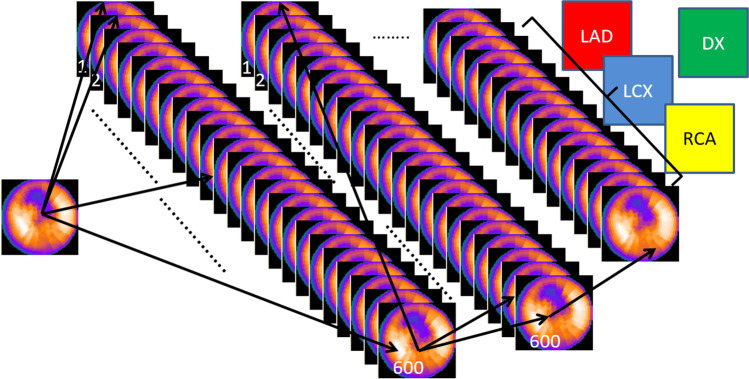
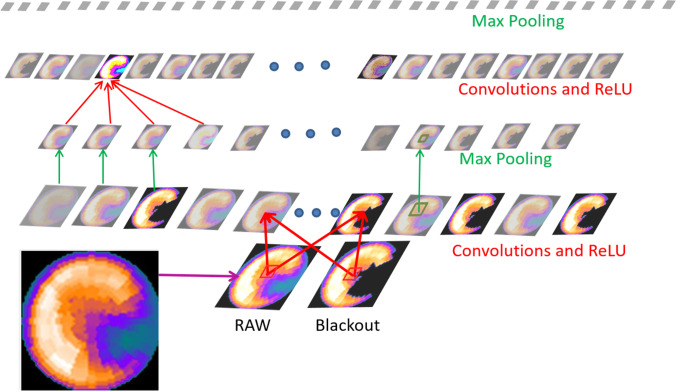
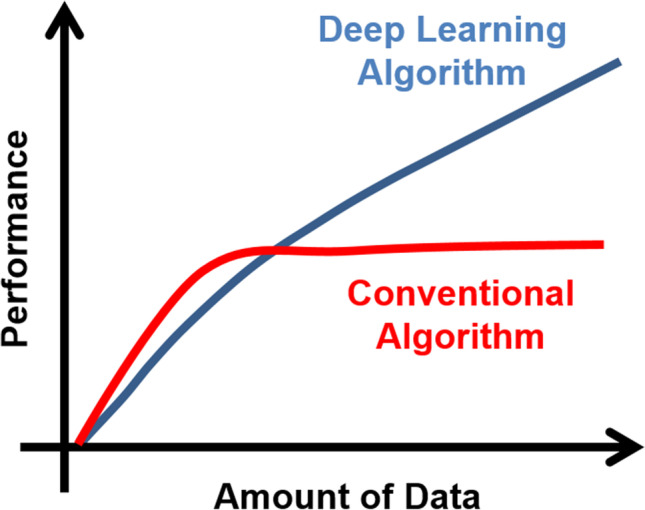
A major opportunity in nuclear cardiology is the many significant artificial intelligence (AI) applications that have recently been reported. These developments include using deep learning (DL) for reducing the needed injected dose and acquisition time in perfusion acquisitions also due to DL improvements in image reconstruction and filtering, SPECT attenuation correction using DL without need for transmission images, DL and machine learning (ML) use for feature extraction to define myocardial left ventricular (LV) borders for functional measurements and improved detection of the LV valve plane and AI, ML, and DL implementations for MPI diagnosis, prognosis, and structured reporting. Although some have, most of these applications have yet to make it to widespread commercial distribution due to the recency of their developments, most reported in 2020. We must be prepared both technically and socio-economically to fully benefit from these and a tsunami of other AI applications that are coming.

Keywords: Absolute myocardial blood flow; Artificial intelligence; Deep learning; Machine learning; Myocardial flow reserve; Nuclear cardiology.


Conflict of interest statement

Conflict of InterestDr. Ernest Garcia receives royalties from the sale of the Emory Cardiac Toolbox and has equity positions with Syntermed, Inc. The terms of these arrangements have been reviewed and approved by Emory University in accordance with its conflict of interest policies. Marina Piccinelli reports no conflict of interest.

Figures

Fig. 1
Fig. 1
Chain of individual applications required for a clinical myocardial perfusion tomographic study. Green checkmarks signify the specific applications that have been improved with machine learning and deep learning algorithms covered in this article
Fig. 2
Fig. 2
Results from DL-based denoising technique for low-dose SPECT MPI [13]. Images for a normal male subject (left panels) and a CAD male subject (right panels) with: a OSEM from full dose data, b OSEM from reduced dose data, and c DL processing. A normal perfusion distribution is shown in the left panels (normal (a)). A perfusion defect in the LAD territory is indicated with green arrow in the right panel (abnormal (a)). In b and c, the rows from top to bottom correspond to 1/2, 1/4, 1/8, and 1/16 dose, respectively. As compared to OSEM, the normal regions of the LV myocardial wall are more uniform after DL processing in both left and right panels. In the DL processing, the extent of the defect is better preserved than in OSEM processing even at much lowered dose levels. CAD, coronary artery disease, LAD, left anterior descending artery, DL, deep learning, OSEM, ordered-subsets expectation–maximization. Figure adapted from slide courtesy of MA King and AJ Ramon
Fig. 3
Fig. 3
Results from DL-based generation of attenuation correction maps from SPECT MPI images [16]. Left panel shows images of the primary, scatter window SPECT reconstructions, the synthetic attenuation maps, and CT-based attenuation (true) maps in the axial, coronal, and sagittal views. Right panel shows SPECT reconstructed images corrected using CT-based (true) attenuation maps, synthetic attenuation maps generated by the Generative Adversarial Network (GAN) and without attenuation correction in short axis (SA) and vertical long axis (VLA) views. Note in the right panel the agreement between the true corrected and corrected with synthetic DL-generated ATTMAP short axis (SA) views and vertical long axis (VLA) views. Note that the uncorrected bottom slices show inferior wall attenuation artifacts absent in the corrected ones. ATTMAP, attenuation map, w, with, w.no, without. Reprint with permission from [16], Shi et al., Eur J Nucl Med Mol Imag, 2020
Fig. 4
Fig. 4
Limitations of the artificial neural network (ANN) architecture. ANN approaches have found some success when using limited input variables and three-layer feed-forward architecture where the ANN is fed with perfusion scores from the 17 myocardial segments in order to reach a conclusion as to whether the left ventricular myocardium demonstrates ischemia. When more image detail is required such as shown in this illustration, and each of the 600 voxels in a polar map has to be connected to every other voxel, the first ANN layer alone would require 600 × 600 connections, huge databases and extensive computer time to train. Thus, the success of the deep learning approaches showed in Figs. 5 and 6. LAD, left anterior descending vascular territory, LCX, left circumflex vascular territory, RCA, right coronary vascular territory, DX, diagnostic conclusion
Fig. 5
Fig. 5
Example of inner workings of a convolutional neural network. The outputs of each layer of a typical convolutional network architecture applied to the images of a raw myocardial perfusion polar map and a blackout polar map after comparison to normal limits emulated from Betancur et al. [32]. Simple matrix operators are convolved with each image to extract desired features. Shown here are two operators: rectified linear unit (ReLU) which applies a threshold from the input to the next output layer, and Max Pooling, which applies a filter to a 2 × 2 image patch reducing image dimensions. Each rectangular image is a feature map corresponding to the output for one of the learned features, detected at each of the image positions. Information flows bottom up, and a score is computed for each image class in output. Illustration adapted from LeCun et al. [33]
Fig. 6
Fig. 6
Why deep learning. Contrast of deep learning (DL) vs. conventional algorithm performance as a function of the amount of data used for training. Note that when data is limited conventional algorithms exhibit better performance, but this advantage is quickly reversed as more training data is used. ML and DL algorithms are mostly driven by data rather than by the sophistication or cleverness of the scientific code and thus the benefit of a much faster implementation compared to conventional approaches

References

    1. Salerno M, Beller GA. Noninvasive assessment of myocardial perfusion. Circ Cardiovasc Imaging. 2009;2:412–424. doi: 10.1161/CIRCIMAGING.109.854893. - DOI - PubMed
    1. Einstein AJ, Pascual TNB, Mercuri M, Karthikeyan G, Vitola JV, Mahmarian JJ, et al. Current worldwide nuclear cardiology practices and radiation exposure: results from the 65 country IAEA Nuclear Cardiology Protocols Cross-Sectional Study (INCAPS) Eur Heart J. 2015;36:1689–1696. doi: 10.1093/eurheartj/ehv117. - DOI - PMC - PubMed
    1. Slomka P, Xu Y, Berman D, Germano G. Quantitative analysis of perfusion studies: strengths and pitfalls. J Nucl Cardiol. 2012;19:338–346. doi: 10.1007/s12350-011-9509-2. - DOI - PMC - PubMed
    1. Nuclear Medicine Market Outlook Report 2018. Accessed on 12/30/2020. Available from: https://imvinfo.com/product/nuclear-medicine-market-outlook-report-2018/
    1. Schindler T, Schelbert HR, Quercioli A, Dilsizian V. Cardiac PET for the detection and monitoring of coronary artery disease and microvascular health. JACC Cardiovasc Imag. 2010;3:623–640. doi: 10.1016/j.jcmg.2010.04.007. - DOI - PubMed

LinkOut - more resources