The effects of sampling and instrument orientation on LiDAR data from crop plots
- PMID: 36998694
- PMCID: PMC10043300
- DOI: 10.3389/fpls.2023.1087239
The effects of sampling and instrument orientation on LiDAR data from crop plots
Erratum in
-
Corrigendum: The effects of sampling and instrument orientation on LiDAR data from crop plots.Front Plant Sci. 2023 May 29;14:1217158. doi: 10.3389/fpls.2023.1217158. eCollection 2023. Front Plant Sci. 2023. PMID: 37313259 Free PMC article.
Abstract
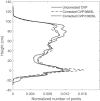
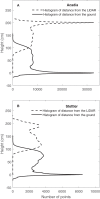
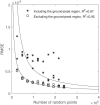
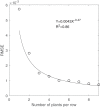
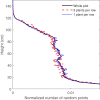
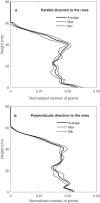
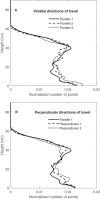
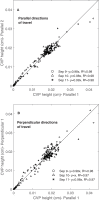
Wheat is one of the most widely consumed grains in the world and improving its yield, especially under severe climate conditions, is of great importance to world food security. Phenotyping methods can evaluate plants according to their different traits, such as yield and growth characteristics. Assessing the vertical stand structure of plants can provide valuable information about plant productivity and processes, mainly if this trait can be tracked throughout the plant's growth. Light Detection And Ranging (LiDAR) is a method capable of gathering three-dimensional data from wheat field trials and is potentially suitable for providing non-destructive, high-throughput estimations of the vertical stand structure of plants. The current study considers LiDAR and focuses on investigating the effects of sub-sampling plot data and data collection parameters on the canopy vertical profile (CVP). The CVP is a normalized, ground-referenced histogram of LiDAR point cloud data representing a plot or other spatial domain. The effects of sub-sampling of plot data, the angular field of view (FOV) of the LiDAR and LiDAR scan line orientation on the CVP were investigated. Analysis of spatial sub-sampling effects on CVP showed that at least 144000 random points (600 scan lines) or an area equivalent to three plants along the row were adequate to characterize the overall CVP of the aggregate plot. A comparison of CVPs obtained from LiDAR data for different FOV showed that CVPs varied with the angular range of the LiDAR data, with narrow ranges having a larger proportion of returns in the upper canopy and a lower proportion of returns in the lower part of the canopy. These findings will be necessary to establish minimum plot and sample sizes and compare data from studies where scan direction or field of view differ. These advancements will aid in making comparisons and inform best practices for using close-range LiDAR in phenotypic studies in crop breeding and physiology research.
Keywords: LiDAR; phenomics; phenotyping; spatial sampling; wheat.
Copyright © 2023 Khorsandi, Tanino and Noble.
Conflict of interest statement
The authors declare that the research was conducted in the absence of any commercial or financial relationships that could be construed as a potential conflict of interest.
Figures





References
-
- Bai G., Ge Y., Hussain W., Baenziger P. S., Graef G. (2016). A multi-sensor system for high throughput field phenotyping in soybean and wheat breeding. Comput. Electron. Agric. 128, 181–192. doi: 10.1016/j.compag.2016.08.021 - DOI
-
- Baret F., De Solan B., Lopez-Lozano R., Ma K., Weiss M. (2010). GAI estimates of row crops from downward looking digital photos taken perpendicular to rows at 57.5 zenith angle: Theoretical considerations based on 3D architecture models and application to wheat crops. Agric. For. Meteorol. 150 (11), 1393–1401. doi: 10.1016/j.agrformet.2010.04.011 - DOI
-
- Beland M., Widlowski J., Fournier R. A., Cote J., Verstraete M. M. (2011). Estimating leaf area distribution in savanna trees from terrestrial LiDAR measurements. Agric. For. Meteorol. 151 (9), 1252–1266. doi: 10.1016/j.agrformet.2011.05.004 - DOI
-
- Beland M., Baldocchi D. D., Widlowski J., Fournier R. A., Verstraete M. M. (2014). On seeing the wood from the leaves and the role of voxel size in determining leaf area distribution of forests with terrestrial LiDAR. Agric. For. Meteorol. 184, 82–97. doi: 10.1016/j.agrformet.2013.09.005 - DOI
-
- Bendig J. V. (2015). “Unmanned aerial vehicles (UAVs) for multi-temporal crop surface modelling,” in A new method for plant height and biomass estimation based on RGB-imaging (Cologne, Germany: Doctoral dissertation, University of Cologne; ).
LinkOut - more resources
Full Text Sources

