. 2023 Mar 14:14:1107900.
doi: 10.3389/fimmu.2023.1107900. eCollection 2023.

Epigenetic immune monitoring for COVID-19 disease course prognosis

Affiliations

Epigenetic immune monitoring for COVID-19 disease course prognosis

Björn Samans et al. Front Immunol. .

Erratum in

Abstract

Background: The course of COVID-19 is associated with severe dysbalance of the immune system, causing both leukocytosis and lymphopenia. Immune cell monitoring may be a powerful tool to prognosticate disease outcome. However, SARS-CoV-2 positive subjects are isolated upon initial diagnosis, thus barring standard immune monitoring using fresh blood. This dilemma may be solved by epigenetic immune cell counting.

Methods: In this study, we used epigenetic immune cell counting by qPCR as an alternative way of quantitative immune monitoring for venous blood, capillary blood dried on filter paper (dried blood spots, DBS) and nasopharyngeal swabs, potentially allowing a home-based monitoring approach.

Results: Epigenetic immune cell counting in venous blood showed equivalence with dried blood spots and with flow cytometrically determined cell counts of venous blood in healthy subjects. In venous blood, we detected relative lymphopenia, neutrophilia, and a decreased lymphocyte-to-neutrophil ratio for COVID-19 patients (n =103) when compared with healthy donors (n = 113). Along with reported sex-related differences in survival we observed dramatically lower regulatory T cell counts in male patients. In nasopharyngeal swabs, T and B cell counts were significantly lower in patients compared to healthy subjects, mirroring the lymphopenia in blood. Naïve B cell frequency was lower in severely ill patients than in patients with milder stages.

Conclusions: Overall, the analysis of immune cell counts is a strong predictor of clinical disease course and the use of epigenetic immune cell counting by qPCR may provide a tool that can be used even for home-isolated patients.

Keywords: COVID-19; SARS-CoV-2; disease prognosis; epigenetic qPCR; immune monitoring; lymphopenia.


Conflict of interest statement

Authors BS, AR, KS, JJ, LL and SO were employed by the company Precision for Medicine. The remaining authors declare that the research was conducted in the absence of any commercial or financial relationships that could be construed as a potential conflict of interest.

Figures
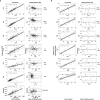
Figure 1
Figure 1
Method comparison studies for epigenetic cell quantification. (A) A full method comparison study of epigenetic qPCR- and flow cytometry-based cell quantification in venous whole blood samples of healthy donors (n = 113) was undertaken for different cell types. (B) Immune cell counts (epigenetic qPCR) in capillary blood (stored as dried blood spot (DBS)) of healthy donors (n = 25) were compared to matched venous blood samples (liquid). Each method comparison is displayed by a scatterplot (left side) and a tukey mean difference plot (right side). Scatter plot showing immune cell frequencies determined by epigenetic qPCR plotted against flow cytometrically determined relative or absolute cell numbers (dashed line: bisectrix, solid line: linear regression line (y~x) with 95% confidence interval). Spearman (rho) coefficients with corresponding p values are shown in correlation plots. Tukey mean difference plot shows difference normalized by the mean of both methods for each sample expressed as percentage (dashed lines indicate -/+ 1.96-times standard deviation of relative difference, solid line indicates systematic error (bias)). Treg, regulatory T cells; NK cells, CD56dim natural killer cells.
Figure 2
Figure 2
Lymphocyte populations of COVID-19 patients at initial hospital admission. Jittered scatters indicate actual cell count for a single sample at the first visit is defined as timepoint at initial admission. Boxes display the interquartile range and different coloured boxes indicate healthy (white box, n = 113) or COVID-19 patient cohorts from two clinical sites (grey boxes, Bochum, n = 75; Valencia, n = 22). Whiskers extend maximally 1.5 times the interquartile range from the upper/lower end of the box. Observations farther than that are considered outliers. All p values relate to the Wilcoxon rank sum test for median differences and are displayed above the respective boxplots. (A) Boxplots for lymphocyte subpopulations (CD19+ B, CD3+, CD4+, CD8+, regulatory T (Treg), memory, naïve B cells, neutrophils and CD56dim natural killer [NK] cells). (B) Boxplot of lymphocyte-to-neutrophil ratio (LNR). (C) Boxplots for Treg counts separated by sex (colors: female = red, male = blue).
Figure 3
Figure 3
Immune cell counts depending on disease status switch in COVID-19 patients in whole blood samples. The disease status was assessed in accordance with RKI classification of hospitalized COVID-19 patients. The “good prognosis” group consists of patients (n = 27) which showed an improvement until second available time point compared to first time point. Improvement was assumed when a change from severe to moderate and persistent moderate grade was found. Patients with a change from moderate or severe to critical, moderate to severe grade were classified as “poor prognosis” group (n = 9). Patients were represented in both groups, when showing status change from second to third time point. Epigenetic data for the first and second time point (when status changed from second to third time point) are illustrated in the plots (white box: good prognosis; grey box: poor prognosis). Jittered scatter indicates actual cell count for a single sample. (A) Boxplots for T and B lymphocyte subpopulations (CD19+ B, CD3+, CD4+, CD8+, regulatory T (Treg), memory, naïve B cells), neutrophils and CD56dim natural killer [NK] cells. (B) Boxplot for lymphocyte-to-neutrophil ratio (LNR). (C) Prognostic performance for the markers CD3+ T cells, LNR, naïve B cells and neutrophils for a good prognosis was assessed by “receiver operating characteristic” (ROC) analysis, encoding good prognosis as 0 and poor prognosis as 1. Calculated area under the curve (AUC) for the four markers are shown in the plot. (D) CD3+ T cell course of Valencia cohort from first and last time point. Dynamic changes of CD3+ T lymphocytes in COVID-19 patients admitted into hospital. Relative numbers of CD3+ T lymphocytes are analysed at first and last available time point after hospital admission. Only patients with more than two time points were included in this analysis. Solid horizontal line shows the CD3+ T cell threshold of ≥ 10.2% that marks the count that was defined as recovery limit. Each patient trajectory is illustrated by a line between two time points (deceased: n = 5, survived: n = 9). Dotted horizontal lines mark the normal “healthy” CD3+ T cell range (95% CI: 12.99–40.97%). One patient (labelled with “COV-UCI-1”) was not following the pattern. Boxes display the interquartile range. Whiskers extend maximally 1.5 times the interquartile range from the upper/lower end of the box. Observations farther than that are considered outliers. All p values relate to the Wilcoxon rank sum test for median differences and are displayed above the respective boxplots.
Figure 4
Figure 4
Correlation of T or B cell populations in blood and nasopharyngeal swabs. Relative counts (%) of CD3+, CD4+ and CD8+ cells respective overall, memory and naïve B cells are determined by epigenetic qPCR for whole blood (Blood) and nasopharyngeal swabs (Nasal swab) from COVID-19 patients or healthy volunteers. Scatter plots show the correlation of CD3+ T cell count and sum of CD4+ and CD8+ T cell count (A) (n = 213 [Blood] or n = 40 [Nasal swab]) or total B cell count and sum of naïve and memory B cell count (B) (n = 166 [Blood] or n = 34 [Nasal swab]). Datapoints for blood samples are indicated by circles (solid line) and for nasopharyngeal samples by triangles (dashed line). Corresponding regression lines (y~x) are shown as solid lines inclusive 95% confidence interval (grey area). Pearson (R) and spearman (rho) coefficients with corresponding p values are shown in plot.
Figure 5
Figure 5
Lymphocytes in swabs from healthy donors and COVID-19 patients. (A) Relative quantification of lymphocyte populations in nasopharyngeal swab samples from healthy donors (labelled as “Swab_HD”) and COVID-19 patients at first available time point (labelled as “Swab_COVID”) compared to blood cell count of healthy individuals (labelled as “Blood_HD”) were determined by epigenetic qPCR. Investigated cell types are CD19+ B cells, CD3+ T cells, memory and naïve B cells and CD56dim natural killer (NK) cells. (B) Relative quantification of lymphocyte populations in nasopharyngeal swab samples from COVID-19 patients (all time points) with mild or moderate symptoms (white box) compared patients with severe or critical illness (grey box). Outcome respective status at discharge of the patients is indicated by different point shapes (deceased patient: circle, survived patient: triangle). Data are presented as boxplot and compared by Wilcoxon rank sum test. Boxes display the interquartile range. Whiskers extend maximally 1.5 times the interquartile range from the upper/lower end of the box. Observations farther than that are considered outliers. All p values relate to the Wilcoxon rank sum test for median differences and are displayed above the respective boxplots.

References

    1. Coronavirus disease (COVID-19) . Available at: https://www.who.int/emergencies/diseases/novel-coronavirus-2019.
    1. Office of the Assistant Secretary for Preparedness H. Pandemic Influenza Plan - Update IV . (2017).
    1. Chen G, Wu D, Guo W, Cao Y, Huang D, Wang H, et al. . Clinical and immunological features of severe and moderate coronavirus disease 2019. J Clin Invest. (2020) 130(5):2620–9. doi: 10.1172/JCI137244 - DOI - PMC - PubMed
    1. Liu J, Li S, Liu J, Liang B, Wang X, Wang H, et al. . Longitudinal characteristics of lymphocyte responses and cytokine profiles in the peripheral blood of SARS-CoV-2 infected patients. EBioMedicine. (2020) 55:102763. doi: 10.1016/j.ebiom.2020.102763 - DOI - PMC - PubMed
    1. Mohan SS, McDermott BP, Cunha BA. The diagnostic and prognostic significance of relative lymphopenia in adult patients with influenza a. Am J Med (2005) 118(11):1307. doi: 10.1016/j.amjmed.2005.06.018 - DOI

Publication types