. 2023 Sep 1;78(3):943-958.
doi: 10.1097/HEP.0000000000000369. Epub 2023 Apr 1.

Epigenetic regulation of HBV-specific tumor-infiltrating T cells in HBV-related HCC

Affiliations

Epigenetic regulation of HBV-specific tumor-infiltrating T cells in HBV-related HCC

Maojun You et al. Hepatology. .

Abstract

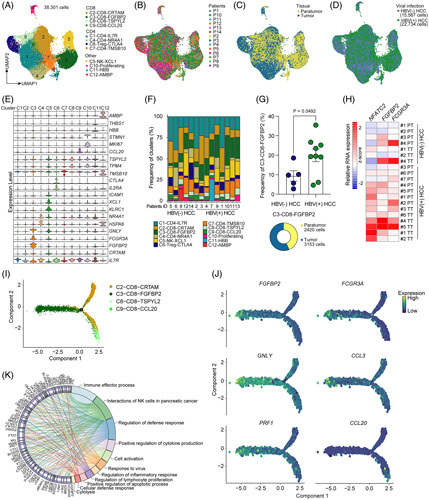
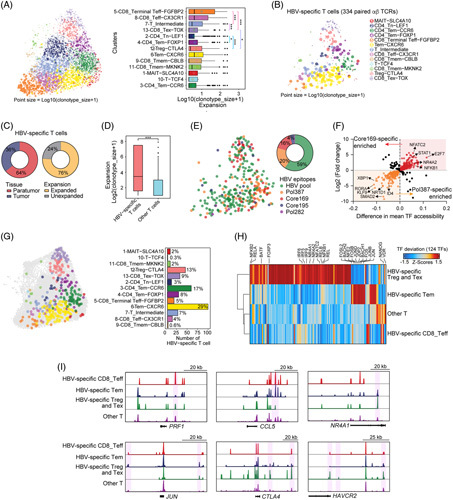
Background and aims: HBV shapes the T-cell immune responses in HBV-related HCC. T cells can be recruited to the nidus, but limited T cells participate specifically in response to the HBV-related tumor microenvironment and HBV antigens. How epigenomic programs regulate T-cell compartments in virus-specific immune processes is unclear.

Approach and results: We developed Ti-ATAC-seq. 2 to map the T-cell receptor repertoire, epigenomic, and transcriptomic landscape of αβ T cells at both the bulk-cell and single-cell levels in 54 patients with HCC. We deeply investigated HBV-specific T cells and HBV-related T-cell subsets that specifically responded to HBV antigens and the HBV + tumor microenvironment, respectively, characterizing their T-cell receptor clonality and specificity and performing epigenomic profiling. A shared program comprising NFKB1/2-, Proto-Oncogene, NF-KB Sub unit, NFATC2-, and NR4A1-associated unique T-cell receptor-downstream core epigenomic and transcriptomic regulome commonly regulated the differentiation of HBV-specific regulatory T-cell (Treg) cells and CD8 + exhausted T cells; this program was also selectively enriched in the HBV-related Treg-CTLA4 and CD8-exhausted T cell-thymocyte selection associated high mobility subsets and drove greater clonal expansion in HBV-related Treg-CTLA4 subset. Overall, 54% of the effector and memory HBV-specific T cells are governed by transcription factor motifs of activator protein 1, NFE2, and BACH1/2, which have been reported to be associated with prolonged patient relapse-free survival. Moreover, HBV-related tumor-infiltrating Tregs correlated with both increased viral titer and poor prognosis in patients.

Conclusions: This study provides insight into the cellular and molecular basis of the epigenomic programs that regulate the differentiation and generation of HBV-related T cells from viral infection and HBV + HCC unique immune exhaustion.


Conflict of interest statement

Liang Chen was supported by National Natural Science Foundation Outstanding Youth Science Fund Project. Maojun You was supported by Special Research Assistant Project of Chinese Academy of Sciences and fellowship of China Postdoctoral Science Foundation (2021M703419). Yanan Gao was supported by Beijing Municipal Science and Technology Commission, Administrative Commission of Zhongguancun Science Park (Z221100007922030). The remaining authors have no conflicts to report.

The authors have no conflicts to report.

Figures

None
Graphical abstract
FIGURE 1
FIGURE 1
Epigenomic landscape of T-cell ensembles in HCC. (A) Overview of the study design, including the patient sample processing for bulk-cell ATAC-seq, single-cell Ti-ATAC-seq. 2, and involved data sets used for validation. (B) t-SNE projection of bulk αβ T-cell ATAC-seq profiles from 7 groups, including (1) HD_PBMC (n = 5), (2) HBV (−) HCC_PBMC (n = 8), (3) HBV (−) HCC_PT (n = 7), (4) HBV (−) HCC_TT (n = 5), (5) HBV (+) HCC_PBMC (n = 13), (6) HBV (+) HCC_PT (n = 12), and (7) HBV (+) HCC_TT (n = 13). (C) Heatmap describing clusters for the top 6337 varying ATAC-seq peaks. Colors indicate the log2 FC of reads in each peak compared with the mean across all T-cell groups, including T cells derived from either the PBMCs of HDs or the PBMCs, peritumoral or TTs of patients with HBV + HCC and HBV HCC. Selected annotated genes from each cluster are shown on the right. (D) Heatmap showing enrichment of GO biological processes in each cluster as determined through GREAT analysis. (E) Genome tracks for representative loci in the indicated 7 indicated T-cell groups. Green shading indicates differential peaks within clusters. (F) qPCR analyses of CCR7 and PRDM1 mRNA expression in the T cells sorted from matched PBMCs, PTs, and TT of patients with HBV + HCC (n = 7) and patients with HBV HCC (n = 4). Data are shown as the mean ± SEM, assessed using a 2-tailed paired Student t test: *p < 0.05, **p < 0.01, ***p < 0.001, ****p < 0.0001. Abbreviations: ATAC-seq, assay for transposase-accessible chromatin with sequencing; FC, fold change; HD, healthy donor; PBMC, peripheral blood mononuclear cell; PT, paratumoral tissue; t-SNE, T-distributed stochastic neighbor embedding; Ti-ATAC-seq, TCR-index-ATAC sequencing; TT, tumor tissue.
FIGURE 2
FIGURE 2
Epigenomic landscape of ensemble T cells in patients with HBV+ HCC. (A–C) Volcano plots showing the TF enrichment using the ChromVAR bias-corrected deviation between the HBV(−) HCC_PB and HBV(+) HCC_PB (A), HBV(−) HCC_PT and HBV(+) HCC_PT (B), and HBV(−) HCC_TT and HBV( + ) HCC_TT (C). p values were calculated using unpaired 2-tailed t tests. (D) Heatmap of TF deviation z-scores in the 7 indicated T-cell groups as mentioned in Figure 1B. (E) ChromVAR TF bias-corrected deviations overlaid on t-SNE projection of the indicated T-cell groups. Scale bars indicate the range of z-scores. (F) Genome tracks for representative loci of TFs in the 7 indicated T-cell groups. Green shading indicates differential peaks within clusters. (G) qPCR analyses of NR4A1, NFKB1, REL, and NFATC2 mRNA expression in the T cells sorted from matched PBMCs, PT, and TT of patients with HBV+ HCC (n = 7) and patients with HBV HCC (n = 4). Data are shown as the mean ± SEM, assessed using a 2-tailed paired Student t test: *p < 0.05, **p < 0.01, ***p < 0.001, ****p < 0.0001. Abbreviations: PB or PBMC, peripheral blood mononuclear cell; PT, paratumoral tissue; TF, transcription factor; t-SNE, T-distributed stochastic neighbor embedding; TT, tumor tissue.
FIGURE 3
FIGURE 3
Characterization of gene expression associated with activated and effector FGFBP2+ CD8+ T cells enriched in HBV+ HCC. (A) The scRNA-seq (GEO: GSE156337) UMAP plot of 38,301 T and NK cells from 5 patients with HBV HCC and 9 patients with HBV+ HCC, showing the formation of 12 clusters including CD4+, CD8+, and other clusters. The dots indicate individual cells, and the cell-type identity is indicated by colors. (B–D) UMAP plot showing the sample origin (B), tissue origin (C), and HBV infection state (D) of the patients. (E) Violin plot showing the expression profiles of those marker genes identified for the 12 clusters. (F) Frequencies of clusters in each patient. (G) Left: differences in the frequency of the cluster C3-CD8-FGFBP2 in the samples of patients with HBV HCC and patients with HBV + HCC. A 2-sided unpaired Student t test was performed to determine the p values. Right: pie chart of the distribution of cluster C3-CD8-FGFBP2 in peritumoral and TTs. (H) Heatmap showing the relative mRNA expression of NFATC2, FGFBP2, and FCGR3A in the T cells sorted from PT and TT of patients with HBV + HCC (n = 7) and patients with HBV HCC (n = 4). (I) Trajectory manifold of CD8 + T cells using the Monocle 2 algorithm. Solid and dotted lines represent distinct cell trajectories defined by gene expression levels. (J) Cell trajectory projections of the indicated gene expression changes based on the manifold. (K) Detailed relationships between the top 64 most significantly upregulated genes (on the left side of the graph) of cluster C3-CD8-FGFBP2 and major pathways (-log10 p value > 5, on the right of side) annotated by Metascape analysis are shown in a Circos graph. Abbreviations: NK, natural killer; PT, paratumoral tissue; scRNA-seq, single-cell RNA sequencing; TT, tumor tissue; UMAP, uniform manifold approximation and projection.
FIGURE 4
FIGURE 4
The developmental programs of the HBV-related T-cell clusters. (A) Workflow of Ti-ATAC-seq. 2 to measure scATAC and scTCR from the same individual T cells. (B) UMAP plot showing 12 T-cell clusters of 16,541 scATAC-seq profiles from peritumoral and TTs of 11 HBV + HCC and 1 HBV HCC patients. The dots indicate individual cells and the cell-type identity is indicated by colors. Pie chart showing the frequency of each cluster (right). (C) The proportions of clusters in each patient. (D) UMAP plot (left) and pie chart (right) showing the tissue origin. (E) The gene scores of the indicated genes overlaid on UMAP embedding. (F) The TF deviation scores of indicated TFs overlaid on UMAP embedding. (G) Aggregated single-cell genome tracks for the indicated clusters at the FGFBP2, PRF1, CTLA4, and TOX loci with peak Co-access. The Co-access is indicated by the inferred peak-to-gene links for distal regulatory elements. Blue shading indicates differential peaks within clusters. (H–J) Volcano plots showing the TF enrichment using the chromVAR bias-corrected deviation between the cluster 13-CD8_Tex-TOX and other T cells (H), cluster 12-Treg-CTLA4 and other T cells (I), and cluster 5-CD8_terminal Teff-FGFBP2 and other T cells (J). The p value was calculated using a 2-sided pairwise Wilcoxon test and the false discovery rate was corrected using the Benjamini-Hochberg procedure. (K) Lineage trajectories of exhausted (trajectory 1) and effector (trajectory 3) CD8 + T-cell states and Treg (trajectory 2) cell states. Lines represent double-spline fitted trajectories across pseudotime. (L–N). Pseudotime heatmap showing the ordered cis-element accessibility (left) and TF motif accessibility (right) in trajectory 1 (L), trajectory 2 (M), and trajectory 3 (N). Abbreviations: ATAC-seq, assay for transposase-accessible chromatin with sequencing; Co-access, co-accessibility; FDR, false discovery rate; scATAC-seq, single-cell ATAC-seq; RT, reverse transcription; scTCR-seq, single-cell TCR sequencing; TCR, T-cell receptor; Teff, effector T cells; Tem, effector and memory T-cell; Tex, exhausted T-cell; TF, transcription factor; Ti-ATAC-seq, TCR-index-ATAC sequencing; Tmem, memory T-cell; Tn, naïve T-cell; Treg, regulatory T-cell; TT, tumor tissue; UMAP, uniform manifold approximation and projection.
FIGURE 5
FIGURE 5
Characterization of TCR clonality and HBV specificity of T cells in HBV+ HCC. (A) The number of cells, unique clonotypes, and frequencies of TCR clonotypes by size (size = 1, size >1, size >3, size > 7) in the TCR repertoire analyses of PT and TT of patients with HBV+ HCC (n = 22) and HBV HCC (n = 3). (B) Sankey plot showing the VJ usage of 16,442 αβ TCRs in HCC patients. (C) Heatmap showing 43 public TCR clones that shared among 25 patients with HCC. The colors indicate the counts of the TCR clonotypes. (D) Luciferase reporter assay of 13 TCR clones. (E) Left: number of CD69+ CD137+ HBV-specific T cells among 1×10⁵ T cells; the labeled percentages indicate the mean fractions of HBV-specific T cells among cells stimulated with HBV peptides or HBV virus. Right: the frequency of HBV-specific CD4+ and CD8+ T cells in HBV-specific T cells. (F) Table showing 3 representative GLIPH-predicted HBV-specific TCR groups with “SQDRGY%”, “ERGI”, and “SE%GNTE” patterns, respectively. (G) Luciferase reporter assays of three TCR clones with “SQDRGY%”, “ERGI”, and “SE%GNTE” patterns, respectively. n.s, p > 0.05, *p < 0.05, **p < 0.01, ***p < 0.001, Student t test. Abbreviations: GLIPH, grouping of lymphocyte interactions by paratope hotspots; PT, paratumoral tissue; TCR, T-cell receptor; TRAJ, TCR alpha joining gene; TRAV, TCR alpha variable gene; TRBJ, TCR beta joining gene; TRBV, TCR beta variable gene; TT, tumor tissue; VJ, TCR V and J gene.
FIGURE 6
FIGURE 6
Epigenomic signatures of HBV-specific T cells revealed by integrated chromatin accessibility and TCR specificity. (A) Left: the sizes of T-cell clonotypes overlaid on the UMAP projection. The spatial distribution of cells is defined in Figure 4B. Right: boxplot showing the sizes of the TCR clonotypes from the clusters. (B) The clonotype size of 334 HBV-specific T cells overlaid on the UMAP projection. The HBV antigen specificity of TCRs was predicted by the GLIPH algorithm. (C) Pie plot showing the tissue distribution (left) and clonal expansion (right) of HBV-specific T cells. (D) Boxplots showing the differences in T-cell expansion as measured by log2 (clonotype size + 1) between HBV-specific T cells and other T cells. (E) The UMAP plot (left) and pie plot (right) showing the GLIPH-predicted HBV epitopes of HBV-specific T cells. (F) The TF enrichments of HBV epitope core 169-specific T cells and pol 387-specific T cells as indicated by differences in mean TF accessibility and log2 FC of the chromVAR bias-corrected deviation. (G) Left: the UMAP plot showing the cell states of HBV-specific T cells, which are shown in colors. Right: the cell numbers in cell states of HBV-specific T cells with the proportions are labeled. (H) Heatmap showing the chromVAR bias-corrected deviations in the 124 most variable TFs across HBV-specific Treg and Tex cells, HBV-specific Tem cells, HBV-specific CD8_Teff cells and other T cells (difference in mean TF accessibility ≥0.05). (I) Aggregated single-cell genome tracks for the T cells at the indicated gene loci. The boxplots denote the median with the quartile range (25%–75%), and the length of whiskers represents 1.5 × the IQR. ***p < 0.001, Student t test. Abbreviations: FC, fold change; GLIPH, grouping of lymphocyte interactions by paratope hotspots; IQR, interquartile range; TCR, T-cell receptor; Teff, effector T cells; Tem, effector and memory T cells; Tex, exhausted T-cell; TF, transcription factor; Treg, regulatory T-cell; UMAP, uniform manifold approximation and projection.
FIGURE 7
FIGURE 7
The transcriptomic regulatory programs of HBV-specific Treg cells and CD8 + T cells. (A) The scRNA-seq (GEO: GSE98638) UMAP projection of the Treg cells (n = 841) and CD8+ T cells (n = 1189) from patients with HBV+ HCC. (B) The scRNA-seq UMAP projection of HBV-specific Treg cells (n = 24) and CD8+ T cells (n = 48) shown in a different color from patients with HBV+ HCC. (C) Pathway enrichment of marker genes enriched in HBV-specific CD8+ T cells (top) and HBV-specific Treg cells (bottom) using Metascape analysis. (D) Violin plot showing the expression profile of those genes from aggregated HBV-specific CD8+ and other CD8+ T cells. The expression is measured as the log2 (TPM + 1). (E) Heatmap showing the outgoing communication patterns of secreting cells (left) and incoming communication patterns of target cells (right), as well as signaling pathways. (F) The expression patterns of signaling genes involved in the inferred IL2 (left) and FASLG (right) signaling networks. (G) Disease-free survival curve, comparing patients in the TCGA HCC cohort with high and low expression of FASLG, analyzed by GEPIA2. (H) Shown is the probability of relapse for patients grouped by serum HBV DNA titer (high HBV DNA titer, n = 8; low HBV DNA titer, n = 11). (I) Correlation of Treg/CD8 + T-cell ratios and tumor size. The p value was calculated using an unpaired 2-tailed t test. (J) Schematic of regulatory programs controlling the antitumor or antiviral responses in HBV-related T-cell subsets (left) and HBV-specific T cells (right). Abbreviations: CCL, chemokine (C-C motif) ligand; CXCL, chemokine (C-X-C motif) ligand; FASLG, Fas ligand; MHC, major histocompatibility complex; PD-L1, programmed cell death-ligand 1; scRNA-seq, single-cell RNA sequencing; TCGA, The Cancer Genome Atlas; TME, tumor microenvironment; TPM, transcript per million; Treg, regulatory T-cell; UMAP, uniform manifold approximation and projection.

Comment in

References

    1. Yang JD, Hainaut P, Gores GJ, Amadou A, Plymoth A, Roberts LR. A global view of hepatocellular carcinoma: trends, risk, prevention and management. Nat Rev Gastroenterol Hepatol. 2019;16:589–604. - PMC - PubMed
    1. Haber PK, Puigvehi M, Castet F, Lourdusamy V, Montal R, Tabrizian P, et al. . Evidence-based management of hepatocellular carcinoma: systematic review and meta-analysis of randomized controlled trials (2002-2020). Gastroenterology. 2021;161:879–98. - PubMed
    1. Sia D, Jiao Y, Martinez-Quetglas I, Kuchuk O, Villacorta-Martin C, Castro de Moura M, et al. . Identification of an immune-specific class of hepatocellular carcinoma, based on molecular features. Gastroenterology. 2017;153:812–26. - PubMed
    1. Montironi C, Castet F, Haber PK, Pinyol R, Torres-Martin M, Torrens L, et al. . Inflamed and non-inflamed classes of HCC: a revised immunogenomic classification. Gut. 2022;72:129–40. - PMC - PubMed
    1. Zheng C, Zheng L, Yoo JK, Guo H, Zhang Y, Guo X, et al. . Landscape of infiltrating T cells in liver cancer revealed by single-cell sequencing. Cell. 2017;169:1342–56. e1316. - PubMed

Publication types

MeSH terms