. 2023 Jul;43(4):815-826.
doi: 10.1111/opo.13133. Epub 2023 Mar 31.

Modelling eye lengths and refractions in the periphery

Affiliations

Modelling eye lengths and refractions in the periphery

Ramkumar Ramamirtham et al. Ophthalmic Physiol Opt. 2023 Jul.

Abstract

Purpose: To create a simplified model of the eye by which we can specify a key optical characteristic of the crystalline lens, namely its power.

Methods: Cycloplegic refraction and axial length were obtained in 60 eyes of 30 healthy subjects at eccentricities spanning 40° nasal to 40° temporal and were fitted with a three-dimensional parabolic model. Keratometric values and geometric distances to the cornea, lens and retina from 45 eyes supplied a numerical ray tracing model. Posterior lens curvature (PLC) was found by optimising the refractive data using a fixed lens equivalent refractive index ( n eq ). Then, n eq was found using a fixed PLC.

Results: Eccentric refractive errors were relatively hyperopic in eyes with central refractions ≤-1.44 D but relatively myopic in emmetropes and hyperopes. Posterior lens power, which cannot be measured directly, was derived from the optimised model lens. There was a weak, negative association between derived PLC and central spherical equivalent refraction. Regardless of refractive error, the posterior retinal curvature remained fixed.

Conclusions: By combining both on- and off-axis refractions and eye length measurements, this simplified model enabled the specification of posterior lens power and captured off-axis lenticular characteristics. The broad distribution in off-axis lens power represents a notable contrast to the relative stability of retinal curvature.

Keywords: hyperopia; myopia; optics.


Figures

Figure 1.
Figure 1.
Numerical ray tracing model. A. Lenstar automated alignment locates the relative centre of the cornea (approximately normal incidence) and local keratometric values are used to construct an aspheric, toroidal cornea. Interfaces along each ray path are converted into geometric distances (GDs) using nominal refractive indices (equation 3) and provide lenticular and retinal coordinates (the latter with respect to the virtual nodal pivot). Algebraic fitting determines anterior lens curvature and displacement. A 5° correction for the right eye / left eye non-axisymmetry included. B. Grand Seiko autorefractor beam entry is aligned with respect to the pupil centre (locating axial aperture). The retina is constructed “piecewise” by fitting tilt angles of small retinal patches with one common curvature that best represents the whole posterior pole. Imposing measured paraxial refractions (sagittal and tangential powers) leaves only model PLC and lens equivalent refractive index (neq) to be optimised for biometric/refractive agreement. C. Following optimisation, the resulting spot patterns (a measure of goodness of fit) show substantial capture of spherical/astigmatic error over the posterior pole. For the selected numerical aperture, ~0.063 (2 mm pupil), Airy disks (black circles) provide a relative basis for off-axis comparison. These spot patterns do not represent the expected peripheral refractive errors as they would be experienced with habitual correction in place.
Figure 2.
Figure 2.
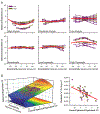
On- and off-axis refractive errors. Data from all 60 eyes (Table 1) are shown. A. Values of spherical equivalent (SE) for high myopia (≤−6.00 D), moderate myopia (−4.01 D to −5.99 D), low myopia (−0.50 D to −4.00 D), emmetropia (−0.49 D to 0.50 D), low hyperopia (0.50 D to ≤ 1.49 D) and high hyperopia (≥1.50 D) and fits of equation 1 (red curves) through the respective data. Binning is based upon central SE. Within each panel, symbols of the same shape are from the same individual. B. At the left, the same values of SE displayed in panel A are replotted as a continuous function of central SE and are fit to equation 2 (surface). The coefficient of the quadratic term (“a”) is m1=≤0.000143 and the constant is b1=≤0.000205; the coefficient of the vertical shift (“k”) is m2=0.973 and the constant is b2=≤0.172. At the right, “a” of the parabolic fit predicted at each SE from the fit of equation 2 is plotted (red line) in the presence of the individual values of a from the fits of SE in each eye to equation 1.
Figure 3.
Figure 3.
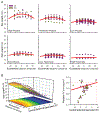
Eye lengths. A. Lengths in high myopia, moderate myopia, low myopia, emmetropia, low hyperopia and high hyperopia (binning as in Figure 1A) and fits of equation 1 (red curves) through the respective data. Within each panel, symbols of the same shape are from the same individual. B. At the left, the same lengths displayed in panel A are replotted as a continuous function of central spherical equivalent refractive error (SE) and are fitted to equation 2 (surface). The coefficient of the quadratic term (“a”) is m1=2.42·10−05 and the constant is b1=−0.000217; the coefficient of the vertical shift (“k”) is m2=−0.4738 and the constant is b2 = 23.9. At the right, the quadratic term (“a”) of the parabolic fit predicted at each SE from the fit of equation 2 is plotted (red line) in the presence of the individual values of a from the fits of length in each eye to equation 1.
Figure 4.
Figure 4.
Eye lengths at each eccentricity in every eye plotted as a function of spherical equivalent refractive error (SE) at the same position. An orthogonal regression is fitted through the data (red line).
Figure 5.
Figure 5.
Parameters of the numerical ray tracing model. Data from subjects who completed the identical, final protocol are shown (45 eyes of 23 subjects, Tables 1 and 2). A. The radius of posterior lens curvature plotted as a function of the radius of anterior lens curvature. B. Radius of the posterior lens plotted as a function of central spherical equivalent refractive error (SE). The red line indicates a significant linear regression. C. The lens equivalent refractive index plotted as a function of central SE. D. Lens form, defined as the ratio of the radii of anterior and poster lens curvatures, plotted as a function of central SE. E. The radius of the posterior retina plotted as a function of central SE.
Figure 6.
Figure 6.
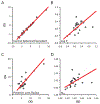
Intraocular agreement in select parameters. Values in left eyes (OS) are plotted as function of the same values in right eyes (OD) and fitted by orthogonal regression (red lines). Grey stippled lines indicate the diagonal. A. Central spherical equivalent (D). B. The logarithm of ratio of the radii of anterior and posterior lens curvatures (FL). C. The radius of posterior lens curvature (mm). D. The equivalent refractive index (neq) of the lens.

References

    1. Smith EL 3rd, Hung LF, Huang J. Relative peripheral hyperopic defocus alters central refractive development in infant monkeys. Vision research 2009;49:2386–2392. - PMC - PubMed
    1. Smith EL 3rd, Kee CS, Ramamirtham R, Qiao-Grider Y, Hung LF. Peripheral vision can influence eye growth and refractive development in infant monkeys. Invest Ophthalmol Vis Sci 2005;46:3965–3972. - PMC - PubMed
    1. Walline JJ, Lindsley KB, Vedula SS, et al. Interventions to slow progression of myopia in children. The Cochrane database of systematic reviews 2020;1:Cd004916. - PMC - PubMed
    1. Mutti DO, Hayes JR, Mitchell GL, et al. Refractive error, axial length, and relative peripheral refractive error before and after the onset of myopia. Investigative Ophthalmology & Visual Science 2007;48:2510–2519. - PMC - PubMed
    1. Mutti DO, Sinnott LT, Mitchell GL, et al. Relative peripheral refractive error and the risk of onset and progression of myopia in children. Investigative Ophthalmology & Visual Science 2011;52:199–205. - PMC - PubMed

Publication types