

What is the optimal country for minimum COVID-19 morbidity and mortality rates?
- PMID: 37000395
- PMCID: PMC10063940
- DOI: 10.1007/s11356-023-26632-y
What is the optimal country for minimum COVID-19 morbidity and mortality rates?
Abstract
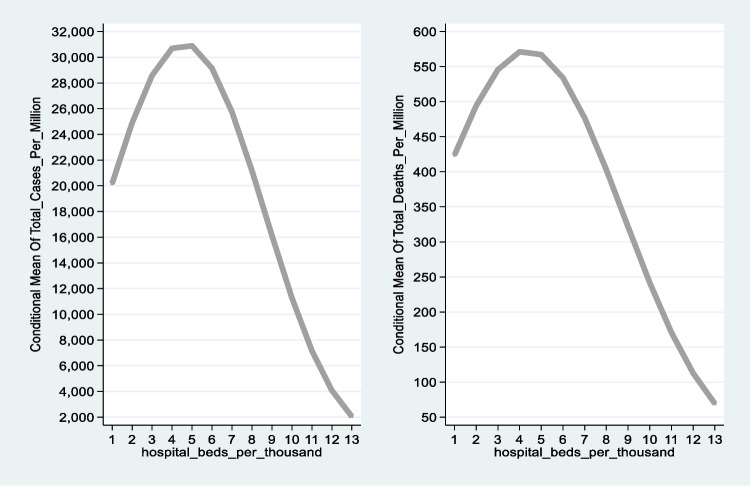
The SARS-CoV-2 is a deceptive virus. Despite the remarkable progress in genetic sequencing and subsequent vaccine development, the world continues to grapple with the ominous threats of rapidly appearing SARS-CoV-2 variants. The objective of this manuscript is to rank world countries based on the anticipated scope of COVID-19 morbidity and mortality, measured in terms of prevalence per 1 million persons, from the lowest to the highest. The ranking of 162 countries is based on predictions of empirical models, which include three explanatory variables: hospital beds per thousand persons, population density, and the median age of the country's population. Referring to the COVID-19 scope of morbidity, the lowest likelihood of infection is obtained in Niger and Mali, where the dominant characteristic is the young median age (15.1-16.4 years). Referring to the COVID-19 scope of mortality, the lowest likelihood is obtained in Singapore. For Singapore, the dominant feature is the high population density. The optimal solution is intensive vaccination campaigns in the initial phase of the pandemic, particularly among countries with low GDP per capita. Yet, vaccinations may work only where the personal immune system is healthy and thus respond by creating antibodies to the SARS-CoV2 virus. Referring to populations that lack the natural protection of the healthy immune system and thus cannot be vaccinated (e.g., old people, cancer patients undergoing chemotherapy treatments), a complementary solution might be coordination between countries and the establishment of field hospitals, testing laboratories, isolation of areas, humanitarian aid-in the same manner of treatment in other disasters like earthquakes.
Keywords: COVID-19; Morbidity; Mortality; Per capita hospital beds; Population density.
© 2023. The Author(s), under exclusive licence to Springer-Verlag GmbH Germany, part of Springer Nature.
Conflict of interest statement
The authors declare no competing interests.
Figures


References
-
- Alperovich G. The size distribution of cities: on the empirical validity of the rank-size rule. J Urban Econ. 1984;16:232–239. doi: 10.1016/0094-1190(84)90044-5. - DOI
-
- Arbel Y, Arbel Y, Kerner A, Kerner M, Can the Regime type (democracy versus autocracy) explain the COVID 19 recovery rates? Chinese Political Science Review, Accepted on January 31, 2022
-
- Arbel Y, Arbel Y, Kerner A, Kerner M (2023) To obey or not to obey? Can game theory explain human behavior in the context of coronavirus disease? Rev Dev Econ:1–14. 10.1111/rode.12979
-
- Benati I, Coccia M (2022) Global analysis of timely COVID-19 vaccinations: Improving governance to reinforce response policies for pandemic crises. Int J Health Gov. 10.2139/ssrn.4124257
MeSH terms
Substances
Supplementary concepts
LinkOut - more resources
Full Text Sources
Medical
Miscellaneous
