Review
. 2023 Jul 1;325(1):H1-H29.
doi: 10.1152/ajpheart.00705.2022. Epub 2023 Mar 31.

Arterial pulse wave modeling and analysis for vascular-age studies: a review from VascAgeNet

Affiliations
Review

Arterial pulse wave modeling and analysis for vascular-age studies: a review from VascAgeNet

Jordi Alastruey et al. Am J Physiol Heart Circ Physiol. .

Abstract

Arterial pulse waves (PWs) such as blood pressure and photoplethysmogram (PPG) signals contain a wealth of information on the cardiovascular (CV) system that can be exploited to assess vascular age and identify individuals at elevated CV risk. We review the possibilities, limitations, complementarity, and differences of reduced-order, biophysical models of arterial PW propagation, as well as theoretical and empirical methods for analyzing PW signals and extracting clinically relevant information for vascular age assessment. We provide detailed mathematical derivations of these models and theoretical methods, showing how they are related to each other. Finally, we outline directions for future research to realize the potential of modeling and analysis of PW signals for accurate assessment of vascular age in both the clinic and in daily life.

Keywords: aging; arteriosclerosis; atherosclerosis; hemodynamics; pulse wave.


Conflict of interest statement

No conflicts of interest, financial or otherwise, are declared by the authors.

Figures

Figure 1.
Figure 1.
The main arterial blood flow modeling approaches illustrated for the upper aorta. A: three-dimensional (3-D) models simulate blood pressure (p), blood flow velocity (V), and wall displacement (not shown) as a function of time (t) and three spatial dimensions (e.g., x, y, and z in Cartesian coordinates). B: one-dimensional (1-D) models describe blood pressure (P), blood flow velocity (U), and luminal area (A) with time and axial direction of the vessel (z). C: zero-dimensional (0-D) models can calculate a space-independent blood pressure (pw) for the whole 3-D or 1-D arterial tree as a function of the aortic inflow (qIN), total compliance (CT) and resistance (RT), and outflow pressure (Pout) at each terminal segment of 3-D and 1-D models (see Eq. 80 in Technical Supplement).
Figure 2.
Figure 2.
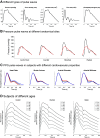
One-dimensional (1-D) blood flow modeling used to simulate arterial pulse waves (PWs). A: simulation of different types of PWs at the carotid artery. B: simulation of pressure PWs at different anatomical sites together with the analytical zero-dimensional (0-D) pressure (red) given by Eq. 80 (Technical Supplement). C: simulation of photoplethysmogram (PPG) PWs at the wrist for subjects with different cardiovascular properties (black, baseline; red, increase; blue, decrease). D: simulation of pressure PWs for subjects of different ages. Source: data were obtained from the Pulse Wave Database (28, 86).
Figure 3.
Figure 3.
Zero-dimensional Windkessel models of the systemic circulation: fire engine analogy (A), hydraulic (left) and electrical circuit (right) analogies (B); blood pressure (P; C), and blood flow (Q; D) with time, and pressure-volume (P-V; E) loops simulated using the four-element model (131, 144) with independent increases (red) or decreases (blue) by ±50% in characteristic impedance (Zc), inductance (L), compliance (C), and peripheral resistance (Rp), from the baseline model (gray). Changes in Zc alter pressure wave shape, with decreased Zc causing late systolic peaking. Variations in L have limited impact, with a slight flattening of systolic P observed when L is low. Changes in C affect pulse pressure and systolic peak timing, whereas decreased Rp lowers overall P and causes earlier ejection. Higher pressures result in lower flows, and changes in P vs. Q appear as “mirrored” alterations. The alterations in P, such as changes in pulse pressure and early or late systolic peaks, can also be seen in P-V loops.
Figure 4.
Figure 4.
Preprocessing an arterial pulse wave (PW) signal. A: brachial applanation tonometry blood pressure (BP) signal was processed to identify high-quality PW data for analysis (blue, from 1 to 9 s). PW onsets are detected (indicated by red dots). B: individual PWs are filtered to eliminate high-frequency content. C: PWs are calibrated using independent mean and diastolic blood pressure measurements (MBP and DBP, respectively). D: brachial (peripheral) PWs are transformed to aortic (central) PWs. E: PWs are ensemble averaged to produce a final PW for analysis. Sources: (data) Brachial data from the Asklepios data set, with artificial noise added (334); (processing) PulseAnalyse (28, 192).
Figure 5.
Figure 5.
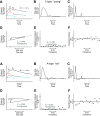
Theoretical-based methods of pulse wave (PW) analysis. The following methods are applied to ensemble averaged pressure and flow waveforms measured in the ascending aorta of young (top) and old (bottom) subjects (149). A: pressure wave separation into forward (Pf, red)- and backward (Pb, blue)-traveling components using the flow rate in B. RC is the time constant of the total pressure wave (black). P1 and P2 are the inflection points described in Section 3.3.1. C: wave intensity analysis. D: pressure-flow loop with the calculated characteristic impedance (Zc, see Eq. 134) from the straight portion. E: impedance modulus. F: impedance phase. E shows Zc calculated from the 4th to 10th harmonics (filled boxes).
Figure 6.
Figure 6.
Changes in in vivo pulse waves (PWs) with age: changes in carotid pressure PWs (A) and changes in finger photoplethysmogram (PPG) PWs (B), labeled with classes as it is common for this type of PW (269). Sources: blood pressure data from the Asklepios data set (334); photoplethysmogram data from the VORTAL data set (182). Figure adapted from “Classes of photoplethysmogram (PPG) pulse wave shape,” Wikimedia Commons, under CC-BY 4.0.
Figure 7.
Figure 7.
Extracting vascular age indices: vascular age indices can be obtained from a single photoplethysmogram (PPG) pulse wave (PW) in two steps. A: identifying fiducial points on the PW [systolic (sys) and diastolic (dia) peaks, dicrotic notch (dic), early and late systolic peaks (p1 and p2)], its first derivative [slope of the rising front (ms)], and its second derivative (a, c, e peaks and b and d troughs). B: calculating features from the amplitudes and timings of these points, such as the time from pulse onset to sys (CT), the time from sys to dia (ΔT), the reflection index (RI), the maximum upslope (ms), and the slope between b and d troughs (slopes b–d). Sources for A and B: Peter Charlton, Photoplethysmogram (PPG) pulse wave fiducial points (CC tBY 4.0; A) and Photoplethysmogram (PPG) pulse wave indices (CC BY 4.0; B) https://commons.wikimedia.org/wiki/File:Photoplethysmogram_(PPG)_pulse_wave_indices.svg.
Figure 8.
Figure 8.
Definition of fiducial points and indices on flow velocity pulse waves (PWs). A: flow augmentation index (AIx) can be obtained, e.g., in the carotid artery, using fiducial points of early (sys1) and late (sys2) systolic peak velocities, and end-diastolic (end) velocity. B: on bidirectional PWs, e.g., in the femoral artery, reverse-to-forward flow ratio (RFR), reverse-to-forward flow index (RFI), and diastolic-to-systolic forward flow ratio (DFR) can be obtained using fiducial points of systolic (sys) and diastolic (dia) forward peak velocities, and reverse (rev) peak velocity. Sources: flow data taken from Refs. and .

References

    1. Olsen MH, Angell SY, Asma S, Boutouyrie P, Burger D, Chirinos JA, Damasceno A, Delles C, Gimenez-Roqueplo A-P, Hering D, López-Jaramillo P, Martinez F, Perkovic V, Rietzschel ER, Schillaci G, Schutte AE, Scuteri A, Sharman JE, Wachtell K, Wang JG. A call to action and a lifecourse strategy to address the global burden of raised blood pressure on current and future generations: the Lancet Commission on hypertension. Lancet 388: 2665–2712, 2016. doi:10.1016/S0140-6736(16)31134-5. - DOI - PubMed
    1. Climie RE, Bruno RM, Hametner B, Mayer CC, Terentes-Printzios D. Vascular age is not only atherosclerosis, it is also arteriosclerosis. J Am Coll Cardiol 76: 229–230, 2020. doi:10.1016/j.jacc.2020.03.081. - DOI - PubMed
    1. Climie RE, Alastruey J, Mayer CC, Schwarz A, Laucyte-Cibulskiene A, Voicehovska J, Bianchini E, Bruno R-M, Charlton PH, Grillo A, Guala A, Hallab M, Hametner B, Jankowski P, Königstein K, Lebedeva A, Mozos I, Pucci G, Puzantian H, Terentes-Printzios D, Yetik-Anacak G, Park C, Nilsson PM, Weber T. Vascular ageing—moving from bench towards bedside. Eur J Prev Cardiol. 2023 May 08 [Epub ahead of print]. doi:10.1093/eurjpc/zwad028. - DOI - PMC - PubMed
    1. Nilsson PM. Early vascular aging (EVA): consequences and prevention. Vasc Health Risk Manag 4: 547–552, 2008. doi:10.2147/vhrm.s1094. - DOI - PMC - PubMed
    1. Broomé M, Maksuti E, Bjällmark A, Frenckner B, Janerot-Sjöberg B. Closed-loop real-time simulation model of hemodynamics and oxygen transport in the cardiovascular system. Biomed Eng Online 12: 69, 2013. doi:10.1186/1475-925X-12-69. - DOI - PMC - PubMed

Publication types

LinkOut - more resources