. 2023 Mar 31;18(3):e0283761.
doi: 10.1371/journal.pone.0283761. eCollection 2023.

Altered interpersonal distance regulation in autism spectrum disorder

Affiliations

Altered interpersonal distance regulation in autism spectrum disorder

Kinga Farkas et al. PLoS One. .

Abstract

Interpersonal distance regulation is an essential element of social communication. Its impairment in autism spectrum disorder (ASD) is widely acknowledged among practitioners, but only a handful of studies reported empirical research in real-life settings, focusing mainly on children. Interpersonal distance in adults with ASD and related autonomic functions received less attention. Here, we measured interpersonal distance along with heart rate variability (HRV) in adults with ASD, and tested the modulatory effects of eye-contact and attribution. Twenty-two adults diagnosed with ASD and 21 matched neurotypical controls participated in our study from October 2019 to February 2020. Our experimental design combined the modified version of the stop distance paradigm with HRV measurement controlling for eye contact between the experimenter and the participant to measure interpersonal distance. Still, we did not detect significant modulatory effect of eye contact and attribution. Our results showed a greater preferred distance in ASD. Moreover, we found lower baseline HRV and reduced HRV reactivity in ASD; however, these autonomic measurements could not predict preferred interpersonal distance. Our study highlights the importance of interpersonal space regulation in ASD: it might be considered that people with ASD need individually variable, presumably greater interpersonal distance. In addition, regardless of the distance they may have reduced autonomic regulatory capacity in social situations. Our results could help shape future experiments with sophisticated designs to grasp the complexity and underlying factors of distance regulation in typical and atypical populations.


Conflict of interest statement

The authors have declared that no competing interests exist.

Figures
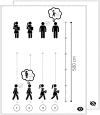
Fig 1
Fig 1. Experimental setting.
The modified version of the stop distance paradigm. First, (1) participants were approaching actively and were asked to stop where it still felt comfortable for them. Next (2) participants were approaching actively and were asked to stop where they thought it was still comfortable for the experimenter. Then (3) participants stood passively and were asked to stop the experimenter where it was still comfortable for them; finally (4) participants stood passively and were asked to stop the experimenter where they thought it was still comfortable for the experimenter. Participants repeated this procedure twice with and without eye contact; the order of the latter two conditions was randomised across participants.
Fig 2
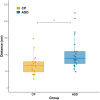
Fig 2. Interpersonal distance in cm.
Dots represent the mean of distance data of eight conditions for each individual. The top and the bottom of the box show the upper (Q3) and lower (Q1) quartiles, the line dividing the box represents the median, and notches show a 95% confidence interval around the median. Asterisks indicate significant group differences. Orange: control participants, blue: participants with ASD.
Fig 3
Fig 3. Heart rate and heart rate variability.
Panel A: Baseline and reactive (interpersonal conditions) heart rate in beat per minute (bpm). Panel B: Baseline and reactive (interpersonal conditions) heart rate variability (RMSSD). Error bars: standard error of the mean. Asterix indicates significant group difference. Orange line: neurotypical participants, blue line: participants with ASD.
Fig 4
Fig 4. Interpersonal distance and HRV differences in different conditions.
Panel a-b Interpersonal distance in cm. Panel a: With or without eye contact, Panel b: Attribution to self or the other. Panel c-d Heart rate variability in explicit conditions at a reported distance. Panel c: With or without eye contact, Panel d: Attribution to self or the other. Error bars: standard error of the mean. Asterisks indicate significant group differences. Orange line: control participants, blue line: participants with ASD.
Fig 5
Fig 5. Correlations between interpersonal distance and heart rate variability at the baseline and during the intentional interpersonal distance conditions.
Dist = distance, HRV = heart rate variability, preHRV = 10s RMSSD, Eye = eye contact, No eye = no eye contact, Active = active moving, Passive = standing, Self = attribution to self, Other = attribution to the other conditions. Upper triangle: control participants, lower triangle: participants with ASD. Warm colours refer to positive, cold colours refer to negative Spearman rank correlation rho values, grey asterisk marks the significant p values after (fdr) correcting for multiple comparisons.
Fig 6
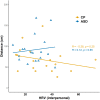
Fig 6. Correlation between mean distance (in cms) and HRV (60 s) during interpersonal distance task in the two groups.
Orange line: neurotypical participants, blue line: participants with ASD.
Fig 7
Fig 7. Correlations between interpersonal distance, heart rate variability at the baseline and during the interpersonal distance conditions, and psychometric data.
HRV = heart rate variability, AQ = Autism-spectrum Quotient, AAS = Adult Attachment Scale, MZQ = Mentalization Questionnaire, STAI-T = State-Trait Anxiety Inventory, Trait, ADI = Autism Diagnostic Interview-Revised, ADOS = Autism Diagnostic Observation Schedule. Upper triangle: neurotypical participants, lower triangle: participants with ASD. Warm colours refer to positive, cold colours refer to negative Spearman rank correlation rho values, grey asterisk marks the significant p values after (fdr) correcting for multiple comparisons.

References

    1. American Psychiatric Association. Diagnostic and Statistical Manual of Mental Disorders. Fifth Edition. American Psychiatric Association; 2013
    1. Ecker C. The neuroanatomy of autism spectrum disorder: An overview of structural neuroimaging findings and their translatability to the clinical setting. Autism Int J Res Pract. 2017. Jan;21(1):18–28. doi: 10.1177/1362361315627136 - DOI - PubMed
    1. Herringshaw AJ, Ammons CJ, DeRamus TP, Kana RK. Hemispheric differences in language processing in autism spectrum disorders: A meta-analysis of neuroimaging studies. Autism Res Off J Int Soc Autism Res. 2016. Oct;9(10):1046–57. doi: 10.1002/aur.1599 - DOI - PubMed
    1. Hadjikhani N, Åsberg Johnels J, Zürcher NR, Lassalle A, Guillon Q, Hippolyte L, et al.. Look me in the eyes: constraining gaze in the eye-region provokes abnormally high subcortical activation in autism. Sci Rep. 2017. Jun 9;7(1):3163. doi: 10.1038/s41598-017-03378-5 - DOI - PMC - PubMed
    1. Langen M, Bos D, Noordermeer SDS, Nederveen H, van Engeland H, Durston S. Changes in the development of striatum are involved in repetitive behavior in autism. Biol Psychiatry. 2014. Sep 1;76(5):405–11. doi: 10.1016/j.biopsych.2013.08.013 - DOI - PubMed

Publication types