. 2023 Mar 31;8(81):eade3525.
doi: 10.1126/sciimmunol.ade3525. Epub 2023 Mar 31.

NK-like CD8+ γδ T cells are expanded in persistent Mycobacterium tuberculosis infection

Affiliations

NK-like CD8+ γδ T cells are expanded in persistent Mycobacterium tuberculosis infection

Roshni Roy Chowdhury et al. Sci Immunol. .

Abstract

The response of gamma delta (γδ) T cells in the acute versus chronic phases of the same infection is unclear. How γδ T cells function in acute Mycobacterium tuberculosis (Mtb) infection is well characterized, but their response during persistent Mtb infection is not well understood, even though most infections with Mtb manifest as a chronic, clinically asymptomatic state. Here, we analyze peripheral blood γδ T cells from a South African adolescent cohort and show that a unique CD8+ γδ T cell subset with features of "memory inflation" expands in chronic Mtb infection. These cells are hyporesponsive to T cell receptor (TCR)-mediated signaling but, like NK cells, can mount robust CD16-mediated cytotoxic responses. These CD8+ γδ T cells comprise a highly focused TCR repertoire, with clonotypes that are Mycobacterium specific but not phosphoantigen reactive. Using multiparametric single-cell pseudo-time trajectory analysis, we identified the differentiation paths that these CD8+ γδ T cells follow to develop into effectors in this infection state. Last, we found that circulating CD8+ γδ T cells also expand in other chronic inflammatory conditions, including cardiovascular disease and cancer, suggesting that persistent antigenic exposure may drive similar γδ T cell effector programs and differentiation fates.


Conflict of interest statement

Competing interests: The authors have no competing interests.

Figures

Figure 1.
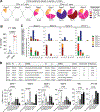
Figure 1.. A CD8+ γδ T cell population with features of memory inflation is associated with controlled Mtb infection.
(A) Percentage of circulating CD8+ γδ T cells in 17 uninfected donors and 19 donors with controlled Mtb infection from a South African adolescent cohort. P-value was derived using the Mann-Whitney test. Error bars represent mean and 95% confidence intervals. (B) Percentages of CD11c+, CD70+, CD16+, GZMB+, PRF1+, IFNγ+, and polyfunctional (GZMB+PRF1+IFNγ+) cells within CD8− and CD8+ γδ T cell subsets. P-values were derived using Wilcoxon matched-pairs signed rank test. Error bars represent mean and 95% confidence intervals. (C) Percentages of naïve, central memory (CM), effector memory (EM), and effector memory cells that re-express CD45RA (EMRA) within CD8− and CD8+ γδ T cell subsets. P-values were derived using multiple Wilcoxon’s test followed by Holm-Sidak correction. (D) Percentages of CD8+ γδ T cells in a longitudinal cohort (N=7) of South African adolescents. (E) Volcano plot showing differential gene expression between bulk sorted CD8− and CD8+ γδ T cells derived from peripheral blood samples of 5 donors with controlled Mtb infection. (F) Heatmaps showing the expression patterns of selected genes significantly differentially expressed (adjusted P <0.05) between CD8− and CD8+ γδ T cells. (G) KEGG Pathway analysis of transcripts differentially upregulated in CD8+ γδ T cells (red bars) and CD8− γδ T cells (blue bars) analyzed by the ShinyGO gene-set enrichment tool, which calculates enrichment based on hypergeometric distribution followed by FDR correction. The pathways listed have enrichment FDR<0.05.
Figure 2.
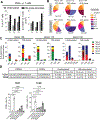
Figure 2.. Peripheral blood CD8+ γδ T cells are effectors with a diminished ability for TCR-mediated activation, but a robust capacity for CD16-mediated cytotoxic response.
(A) Histograms showing the expression of CD69 on CD8− and CD8+ γδ T cells under unstimulated and stimulated conditions (Mtb-lysate, Mtb-lysate with Cyclosporin A, anti-CD3) (left) and the percentage change in CD69+ cells post stimulation in CD8− and CD8+ γδ T cells from 8 donors with controlled Mtb infection, performed in four independent experiments (right). Circles represent Mtb-lysate stimulation, while squares represent anti-CD3 stimulation. P-value was derived using Wilcoxon matched-pairs signed rank test. (B) Mean mass intensities of selected phospho-signaling effectors in CD8− and CD8+ γδ T cell subsets [N=20 samples/subset (10 uninfected and 10 donors with controlled Mtb infection)] at baseline (unstimulated condition) and post PMA-ionomycin stimulation. P-values were derived using Wilcoxon matched-pairs signed rank test. Lower and upper hinges of boxes represent 25th to 75th percentiles, the central line represents the median, the plus sign represents the mean, and the whiskers extend to the highest and lowest values. (C) ADCC response of CD8− and CD8+ γδ T cells, measured by the % increase in CD107a degranulation. Total γδ T cells from donors with controlled Mtb infection (N=5) were sorted and incubated in the presence of antibody coated or uncoated P815 target cells (data are from two independent experiments). P-value was derived using Wilcoxon matched-pairs signed rank test. (D) ADCC response of CD8+ γδ T cells and NK cells measured by incubating total PBMCs from donors with controlled Mtb infection in the presence of antibody coated or uncoated P815 target cells (N=6 donors). P-values were derived using Wilcoxon matched-pairs signed rank test. (E) Histograms showing MitoTracker Green staining of CD8− and CD8+ γδ T cells (left). The mean fluorescence intensity (middle) and the percentage of MitoTracker Greenhi cells (right) within the CD8− and CD8+ γδ T cell subsets (right) are shown (N=17 uninfected donors and 19 donors with controlled Mtb infection). Data are from three independent experiments. P-values were derived using Wilcoxon matched-pairs signed rank test.
Figure 3.
Figure 3.. CD8+ γδ T cells express clonally focused TCRs and respond to Mtb-lysate.
(A) Pie charts depicting the clonal expansion of circulating CD8− and CD8+ γδ T cells in 4 donors with controlled Mtb infection. The number of cells with both γ and δ chains identified is shown below each pie chart. For each TCR sequence expressed by two or more cells (clonally expanded), the absolute number of cells expressing that clone is shown by a distinct colored section. (B) Percent clonality of CD8− and CD8+ γδ T cells determined from paired single cell γ and δ chain sequencing. Clonality is defined as the total number of sequences that appear more than once relative to the total number sequenced per sample. P-value was determined using a paired t test. Error bars represent mean and 95% confidence intervals. (C) Stacked bar plots showing the Vγ/δ chain pairings of CD8− (top) and CD8+ (bottom) γδ T cells isolated from the 4 donors with controlled Mtb infection. (D) CDR3δ/γ sequences from four CD8+ γδ TCRs (GD8-1, GD8-2, GD8-3, GD8-5) and two control Vγ9Vδ2 expressing TCRs (TB5, AT1G9). Jurkat α-β-cells expressing these TCRs were tested for reactivity to cell lines, Mtb-lysate, and HMBPP, measured by the increase in CD69 expression 14 hours post stimulation. P-values were determined using one-way ANOVA followed by Dunnett’s multiple comparisons test. Error bars represent mean and standard deviations.
Figure 4.
Figure 4.. Mtb-specific T cells can be generated in lymphoid organs and CD8+ γδ T cells primed by non-Mtb antigens can respond to Mtb-whole cell lysate.
(A) Percentage and number of CD8+ γδ T cells in unstimulated and Mtb-lysate (10μg/ml)-stimulated tonsil organoid cultures (day 7) from three children (T1-T3) with no known exposure to TB. (B) Clonal composition of CD8+ γδ T cells in unstimulated and Mtb-lysate-stimulated tonsil organoid cultures from three donors. The total number of paired γδ TCRs is shown below each pie chart. For each TCR expressed by two or more cells (clonally expanded), the absolute number of cells expressing that TCR sequence is shown by a distinct colored section. (C) Stacked bar plots showing the Vγ/δ chain pairings used by the clonally expanded tonsillar CD8+ γδ T cells in the unstimulated and Mtb-lysate stimulated cultures. (D) CDR3δ/γ sequences from two CD8+ γδ TCRs that showed clonal expansion (appeared two or more times) in both unstimulated and Mtb-stimulated organoid cultures. Jurkat α-β-cells expressing these TCRs were tested for response to Mtb lysate (10, 30, 50 and 100μg/ml) and HMBPP (5μM). P-values were determined using one-way ANOVA followed by Dunnett’s multiple comparisons test. Error bars represent mean and standard deviations.
Figure 5.
Figure 5.. CD8+ γδ T cells in controlled Mtb infection traverse distinct differentiation trajectories characterized by gradual TCR clonal focusing.
(A) Trajectory initiated UMAP plot of γδ T cells (N=24,888 from 6 donors with controlled Mtb infection) constructed using the Cytoskel package. The cells are colored based on FlowSOM clustering (left). The starting point “X”, the various branch points and branch termini of the Cytoskel map are annotated (shown in the middle). The branches that comprise two major trajectories (trajectory 1 = black and trajectory 2 = gray) are shown (right). (B) Expression of selected cell surface markers along the trajectories as determined by antibody staining. The expression intensity of each marker is indicated, independently for each marker, by the colored gradient for which the range corresponds to the arcsinh transformed expression [arcsinh (x/5), where x=counts]. (C) Pie charts showing the clonal expansion of γδ T cells along pseudotime axes. Cells along each Cytoskel branch were grouped into 4 pseudotime bins of approximately equal number of TCR sequences. For each TCR clone expressed by two or more cells (clonally expanded), the absolute number of cells expressing that clone is shown by a distinct colored section.
Figure 6.
Figure 6.. Increased frequency of circulating CD8+ γδ T cells associates with chronic inflammatory conditions of diverse etiologies.
(A, B) Percentages of total γδ T cells and CD8+ γδ T cells in different cohorts of chronic (A) and acute (B) inflammatory conditions compared to healthy controls. P-values were determined using the Mann-Whitney test. Lower and upper hinges of boxes represent 25th to 75th percentiles, the central line represents the median, and the whiskers extend to the highest and lowest values.

References

    1. Chen ZW, Letvin NL, Vγ2Vδ2+ T cells and anti-microbial immune responses. Microbes and Infection 5, 491–498 (2003). - PMC - PubMed
    1. Junqueira C, Polidoro RB, Castro G, Absalon S, Liang Z, Sen Santara S, Crespo A, Pereira DB, Gazzinelli RT, Dvorin JD, Lieberman J, gammadelta T cells suppress Plasmodium falciparum blood-stage infection by direct killing and phagocytosis. Nat Immunol 22, 347–357 (2021). - PMC - PubMed
    1. Caccamo N, La Mendola C, Orlando V, Meraviglia S, Todaro M, Stassi G, Sireci G, Fournie JJ, Dieli F, Differentiation, phenotype, and function of interleukin-17-producing human Vgamma9Vdelta2 T cells. Blood 118, 129–138 (2011). - PubMed
    1. Peng MY, Wang ZH, Yao CY, Jiang LN, Jin QL, Wang J, Li BQ, Interleukin 17-producing gamma delta T cells increased in patients with active pulmonary tuberculosis. Cell Mol Immunol 5, 203–208 (2008). - PMC - PubMed
    1. Papotto PH, Ribot JC, Silva-Santos B, IL-17(+) gammadelta T cells as kick-starters of inflammation. Nat Immunol 18, 604–611 (2017). - PubMed

Publication types

Substances