. 2023 Mar 31;9(13):eadf4055.
doi: 10.1126/sciadv.adf4055. Epub 2023 Mar 31.

Proteolytic processing of galectin-3 by meprin metalloproteases is crucial for host-microbiome homeostasis

Affiliations

Proteolytic processing of galectin-3 by meprin metalloproteases is crucial for host-microbiome homeostasis

Cynthia Bülck et al. Sci Adv. .

Abstract

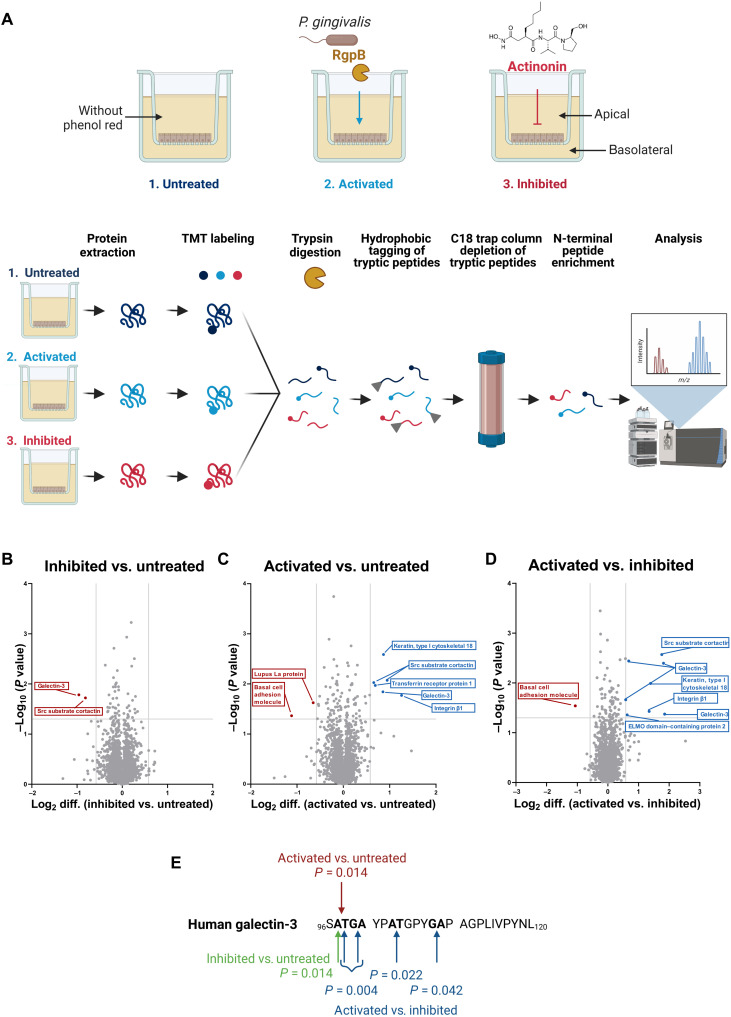
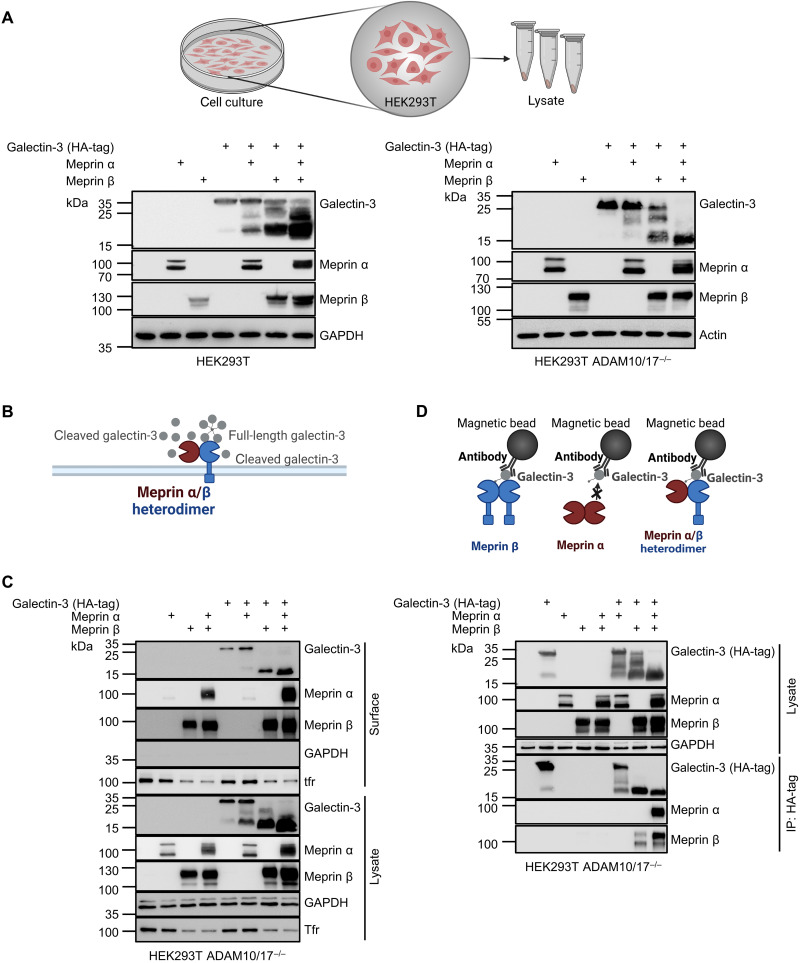
The metalloproteases meprin α and meprin β are highly expressed in the healthy gut but significantly decreased in inflammatory bowel disease, implicating a protective role in mucosal homeostasis. In the colon, meprin α and meprin β form covalently linked heterodimers tethering meprin α to the plasma membrane, therefore presenting dual proteolytic activity in a unique enzyme complex. To unravel its function, we applied N-terminomics and identified galectin-3 as the major intestinal substrate for meprin α/β heterodimers. Galectin-3-deficient and meprin α/β double knockout mice show similar alterations in their microbiome in comparison to wild-type mice. We further demonstrate that meprin α/β heterodimers differentially process galectin-3 upon bacterial infection, in germ-free, conventionally housed (specific pathogen-free), or wildling mice, which in turn regulates the bacterial agglutination properties of galectin-3. Thus, the constitutive cleavage of galectin-3 by meprin α/β heterodimers may play a key role in colon host-microbiome homeostasis.


Figures

Fig. 1.
Fig. 1.. HYTANE analysis revealed galectin-3 as a major intestinal substrate for meprin α/β heterodimers.
(A) For MS-based HYTANE analysis for the enrichment of N-terminal peptides tissue lysates of the proximal and distal colon from wild-type, meprin α knockout (mep1a−/−), meprin β knockout (mep1b−/−), and meprin α and meprin β double knockout (mep1a/b−/−) mice were used (n = 3). (B) Volcano plots showing all identified proteolytic events detected following HYTANE analysis of wild-type mice in comparison to mep1a−/−, mep1b−/−, or mep1a/b−/− mice. Gray lines represent threshold values (±0.58 for log2 difference and P = 0.05). Proteolytic fragments of galectin-3 could be identified in all approaches, indicating cleavage events between Ser112 and Gly113 or Gly114 and Tyr115. (C) Heatmaps of the top 25 highest (blue) and less (red) abundant proteolytic peptides from three biological replicates (BRs) (blue, wild-type > knockout; red, wild-type < knockout; sorted by log2 difference). In all approaches, cleavage of galectin-3 is more abundant in wild-type mice in comparison to the protease knockout mice (highlighted with a blue box).
Fig. 2.
Fig. 2.. Proteolytic processing and tissue distribution of galectin-3 in mouse colon.
(A) Galectin-3 cleavage in colonic tissue from three biological replicates of wild-type, mep1a−/−, mep1b−/−, or mep1a/b−/− mice analyzed by Western blot using a specific galectin-3, meprin α, and meprin β antibody. Glyceraldehyde-3-phosphate dehydrogenase (GAPDH) served as loading control. Galectin-3 was only proteolytically processed in wild-type mice when meprin α/β heterodimers are present in the colon. Asterisk marks an unspecific band. (B) Scheme of the generation of the mep1b−/−;VilCre;Rosa26mep1b-HA mice having an overall meprin β knockout with reexpressed meprin β–HA in enterocytes of the small and large intestines and Western blot analysis of colonic tissue of mep1b−/− and mep1b−/−;VilCre;Rosa26mep1b-HA mice to visualize galectin-3 cleavage via a specific galectin-3 antibody. Meprin β was either detected using a specific meprin β antibody or an HA-tag antibody against meprin β C terminus. GAPDH served as a loading control. Asterisk marks an unspecific band. (C) Stimulated emission depletion (STED) microscopy of intestinal Swiss roles from the whole colon of mep1b−/−;VilCre;Rosa26mep1b-HA mice, mep1a/b−/− mice, or lgals3−/− mice. Tissues were stained against galectin-3 (red), meprin β (green), or villin-1 (red or green). For reexpressed HA-tagged meprin β, the HA-antibody was used. Nuclear staining was visualized using 4′,6-diamidino-2-phenylindole (DAPI) (blue). Scale bars, 5 μm.
Fig. 3.
Fig. 3.. Endogenous galectin-3 cleavage by meprin metalloproteases in differentiated intestinal human cells.
(A) Differentiation process of human colorectal adenocarcinoma Caco-2 cells seeded on a transwell for 21 days. (B) Scheme of an enterocyte (left) and cross-sectional view of the z-stacks from the cell monolayer of Caco-2 cells differentiated for 21 days (right) showing the localization of F-actin (green) and villin (red; bottom) on the apical side, ZO-1 (red; middle) between adjacent cells, and the nucleus (stained with DAPI; blue) on the basolateral side and E-cadherin (red; top) on the lateral membrane. (C to E) Relative mRNA expression of MEP1A (C), MEP1B (D), and LGALS3 (E) in undifferentiated (day 0; red) and in differentiated (day 21; blue) Caco-2 cells (n = 9). Means ± SD. (***P < 0.001; unpaired t test). (F) Endogenous proteolytic processing of galectin-3 in cells of undifferentiated (day 0) and differentiated (day 21) Caco-2 was analyzed via Western blot analysis using a specific galectin-3 antibody. GAPDH served as a loading control. (G) Treatment of differentiated Caco-2 cells (day 21) with 3 μM actinonin showed an abolished galectin-3 cleavage analyzed by immunoblotting using a galectin-3–specific antibody. (H) Genotyping of the human meprin α and meprin β genes (MEP1A and MEP1B) in differentiated Caco-2 [wild-type (WT), MEP1A−/−, and MEP1B−/−] via polymerase chain reaction (PCR) using specific primers for validating CRISPR-Cas9 knockout of either meprin α or meprin β. (I) Western blot analysis investigating the cleavage of galectin-3 in cell lysates from differentiated (day 21) wild-type, MEP1A−/−, and MEP1B−/− Caco-2 cells generated with CRISPR-Cas9 genome editing.
Fig. 4.
Fig. 4.. HYTANE analysis of differentiated intestinal human cells.
(A) For Caco-2 cell treatment with activity modulating compounds, the medium was changed to serum-free Dulbecco’s modified Eagles’s medium (DMEM) without phenol red in both compartments on day 17. For the meprin inhibition, 3 μM actinonin was added daily to the apical and basolateral compartment until day 21 (red; right). For the meprin activation, 5 nM RgpB, a purified protease from P. gingivalis, was added to both compartments on day 20 (blue; middle). As a control, untreated cells were analyzed (left). Cells were harvested on day 21 for HYTANE analysis. (B to D) Volcano plots showing all identified proteolytic events in differentiated Caco-2 cells detected by HYTANE analysis (untreated, activated, and inhibited). Gray lines represent threshold values (±0.58 for log2 difference and P = 0.05). (E) Human galectin-3 sequence (amino acids 96 to 120) showing all identified cleavage sites using HYTANE analysis.
Fig. 5.
Fig. 5.. Analyzing biochemical properties of proteolytic cleavage and interaction of galectin-3 with meprin metalloproteases using transiently transfected cells.
(A) Detection of galectin-3 cleavage fragments by Western blot analysis upon coexpression of galectin-3 (C-terminally HA-tagged) with meprin α and/or meprin β in wild-type HEK293T cells and HEK293T-deficient for ADAM10 and ADAM17 (ADAM10/17−/−). (B and C) Cell surface biotinylation assay of HEK293T ADAM10/17−/− cells transfected with galectin-3, meprin α, and/or meprin β (C). Cell surface proteins were labeled with primary amine biotinylation, pulled down with magnetic streptavidin beads, and analyzed via Western blot analysis. Transferrin receptor (Tfr) and GAPDH served as a control. Cartoon of the proteolytic processing of galectin-3 by meprin α/β heterodimers at the membrane (B). (D) HEK293T ADAM10/17−/− cells were transfected with galectin-3 and meprin α and/or meprin β. After cell lysis, co-IP was performed using an HA-tag antibody against galectin-3 C terminus. Lysate controls and immunoprecipitates were analyzed by Western blot.
Fig. 6.
Fig. 6.. Cleavage of galectin-3 alters its oligomeric structure and bacterial agglutination properties.
(A) Recombinant human (top) and murine (bottom) galectin-3 was incubated with recombinant active meprin α and/or meprin β and analyzed by SDS-PAGE and Coomassie brilliant blue staining. (B) Galectin-3 cleavage analyzed in transfected HEK293T ADAM10/17-/- cells in the presence or absence of the meprin β sheddase ADAM17 detected by immunoblotting. (C) The cleavage site in human and murine galectin-3 was identified using LC-MS analysis of the gel bands in (A) as depicted in the structural model of galectin-3 (AlphaFold: AF-P16110-F1). Gray, CRD; blue, N-terminal tail. (D) Analysis of human recombinant galectin-3 with and without cleavage by meprins via native PAGE. (E) Scheme of the bacterial agglutination assay. (F) E. faecalis was incubated with recombinant galectin-3 alone or preincubated with active recombinant meprin α and/or meprin β, and bacterial agglutination was examined. As a negative control buffer, 20 mM Hepes, pH 7.2, or active recombinant meprins were applied without galectin-3. Middle panel original image. Right panel shows the area of nonagglutinated bacteria, which was calculated using ImageJ Fiji. All values were normalized to the control (Hepes), while the control corresponds to 0 and maximum agglutination to 1. (G) Relative bacterial agglutination of E. faecalis (n = 4), P. aeruginosa (n = 4), E. coli (n = 4), and K. pneumoniae (n = 4) incubated with galectin-3 or galectin-3 preincubated with meprin α and/or meprin β. Data are presented as means ± SD, and statistical analysis was assessed by two-way analysis of variance (ANOVA), followed by a Tukey posttest (*P < 0.05; **P < 0.01; ***P < 0.001).
Fig. 7.
Fig. 7.. Loss of galectin-3 revealed alterations in microbiome composition but not in the mucus properties.
(A) Immunoblot analysis of colonic lysates from wild-type, mep1a/b−/−, and lgals3−/− mice. Asterisk marks an unspecific band. (B) Volcano plot showing N termini identified by HYTANE analysis of wild-type versus lgals3−/− mice. Gray lines represent threshold values (±0.58 for log2 difference and P = 0.05). (C) Scheme of a horizontal perfusion chamber for mucus growth rate analysis. (D) Mucus thickness was measured at 0, 15, and 30 min after mounting, and growth rate was calculated as the delta mucus thickness divided by time from wild-type and lgals3−/− mice (n = 3). (E) The mucus thickness was quantified in wild-type and lgals3−/− mice by calculating the average tissue to beads distance in the penetrability assay (n = 10). (D and E) Data are represented as means ± SD, and statistical analysis was assessed by an unpaired t test [ns (not significant)]. (F) Cross sections through the inner mucus layer of ex vivo wild-type and lgals3−/− distal colon tissue as well as y/x-axis images in the inner mucus layer (red line) and on the mucus surface (blue line): DNA (green), U. Europaeus agglutinin I (UEA-1)–stained intercrypt mucus (red), wheat germ agglutinin (WGA)–stained (gray). Scale bar, 100 μm. (G) Shallow shotgun sequencing of the microbiome of wild-type, lgals3−/−, and mep1a/b−/− from stool samples (n = 6). (H) Normalized 16S abundance analyzed by qRT-PCR from stool samples of lgals3−/− and mep1a/b−/− mice in comparison to wild-type mice. Data are represented as means ± SD, and statistical analysis was assessed by two-way ANOVA, followed by a Tukey posttest (*P < 0.05).
Fig. 8.
Fig. 8.. The bacterial load and composition regulate galectin-3 cleavage by meprin metalloproteases in vivo.
(A) Western blot analysis of colon tissue from conventionally housed (wild-type), germ-free, or wildling mice demonstrated an altered cleavage of galectin-3 in response to different microbiomes. (B to D) Densitometric analysis of cleaved galectin-3 (B), meprin α (C), and meprin β (D) calculated by ImageJ from three biological replicates of wild-type and germ-free mice and four biological replicates of wildling mice as shown in (A). Data are represented as means ± SD, and statistical analysis was assessed by one-way ANOVA, followed by a Tukey posttest (**P < 0.01; ***P < 0.001). (E) Analysis of proteolytic processing of galectin-3 and meprin expression in the colon of C. rodentium–infected mice (control, n = 4; C. rodentium, n = 6) 7 days after infection via immunoblotting. (F to H) Densitometric analysis of cleaved galectin-3 (F), meprin α (G), and meprin β (H) calculated by ImageJ from four or six biological replicates as shown in (E). Data are represented as means ± SD, and statistical analysis was assessed by an unpaired t test (ns, P > 0.05; *P < 0.05; **P < 0.01). (B to D and F to H) The intensity of cleaved galectin-3, meprin α, and meprin β was determined relative to the normalized expression of GAPDH.

References

    1. M. E. Johansson, H. Sjövall, G. C. Hansson, The gastrointestinal mucus system in health and disease. Nat. Rev. Gastroenterol. Hepatol. 10, 352–361 (2013). - PMC - PubMed
    1. A. J. Macpherson, E. Slack, M. B. Geuking, K. D. McCoy, The mucosal firewalls against commensal intestinal microbes. Semin. Immunopathol. 31, 145–149 (2009). - PubMed
    1. M. E. Johansson, J. K. Gustafsson, J. Holmén-Larsson, K. S. Jabbar, L. Xia, H. Xu, F. K. Ghishan, F. A. Carvalho, A. T. Gewirtz, H. Sjövall, G. C. Hansson, Bacteria penetrate the normally impenetrable inner colon mucus layer in both murine colitis models and patients with ulcerative colitis. Gut 63, 281–291 (2014). - PMC - PubMed
    1. A. L. Haber, M. Biton, N. Rogel, R. H. Herbst, K. Shekhar, C. Smillie, G. Burgin, T. M. Delorey, M. R. Howitt, Y. Katz, A single-cell survey of the small intestinal epithelium. Nature 551, 333–339 (2017). - PMC - PubMed
    1. S. Banerjee, G. Jin, S. G. Bradley, G. L. Matters, R. D. Gailey, J. M. Crisman, J. S. Bond, Balance of meprin A and B in mice affects the progression of experimental inflammatory bowel disease. Am. J. Physiol. Gastrointest. Liver Physiol. 300, G273–G282 (2011). - PMC - PubMed