. 2023 Apr:90:104535.
doi: 10.1016/j.ebiom.2023.104535. Epub 2023 Mar 29.

Hypothalamic neuroglial plasticity is regulated by anti-Müllerian hormone and disrupted in polycystic ovary syndrome

Affiliations

Hypothalamic neuroglial plasticity is regulated by anti-Müllerian hormone and disrupted in polycystic ovary syndrome

Anne-Laure Barbotin et al. EBioMedicine. 2023 Apr.

Abstract

Background: Polycystic ovary syndrome (PCOS) is the most common reproductive-endocrine disorder affecting between 5 and 18% of women worldwide. An elevated frequency of pulsatile luteinizing hormone (LH) secretion and higher serum levels of anti-Müllerian hormone (AMH) are frequently observed in women with PCOS. The origin of these abnormalities is, however, not well understood.

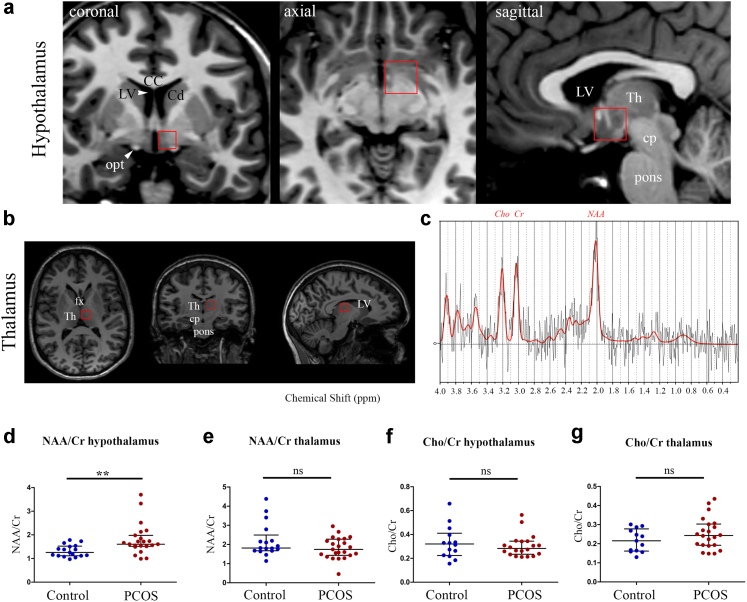
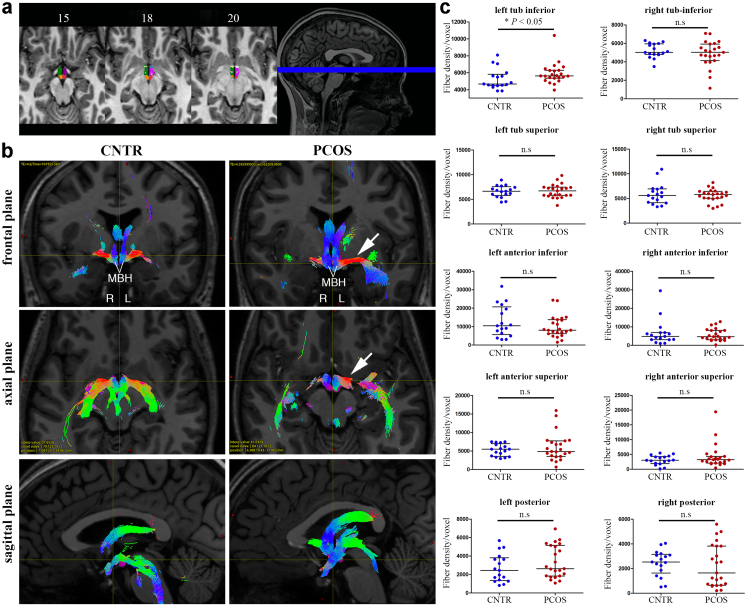
Methods: We studied brain structure and function in women with and without PCOS using proton magnetic resonance spectroscopy (MRS) and diffusion tensor imaging combined with fiber tractography. Then, using a mouse model of PCOS, we investigated by electron microscopy whether AMH played a role on the regulation of hypothalamic structural plasticity.

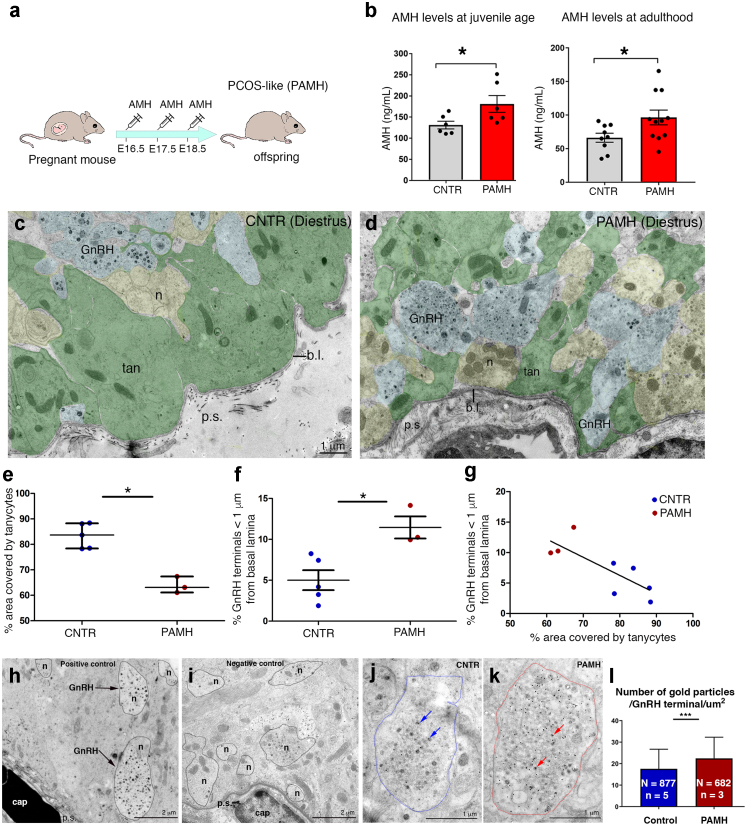
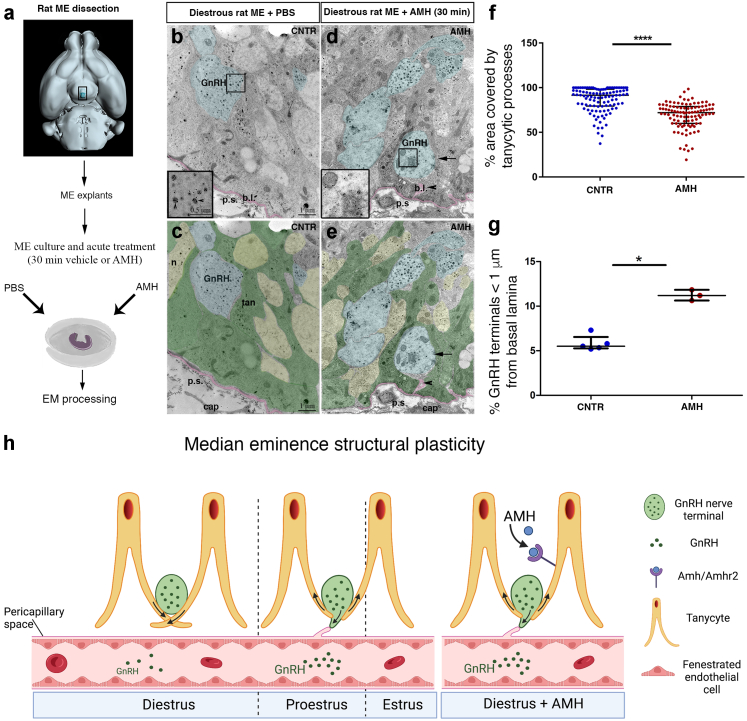
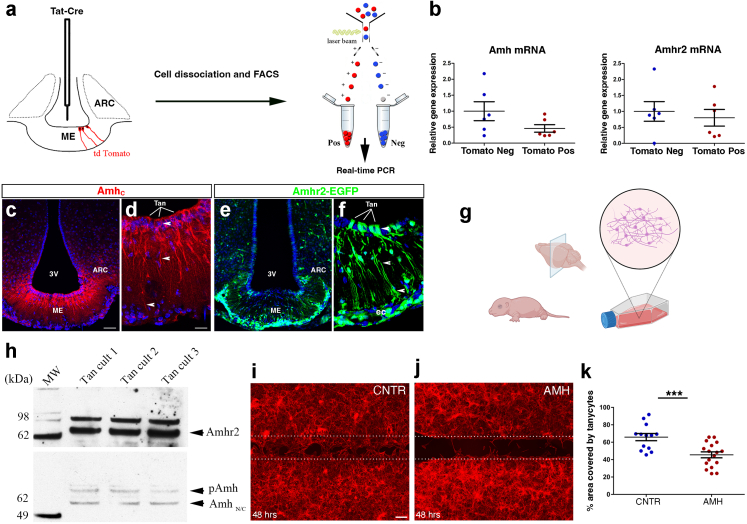
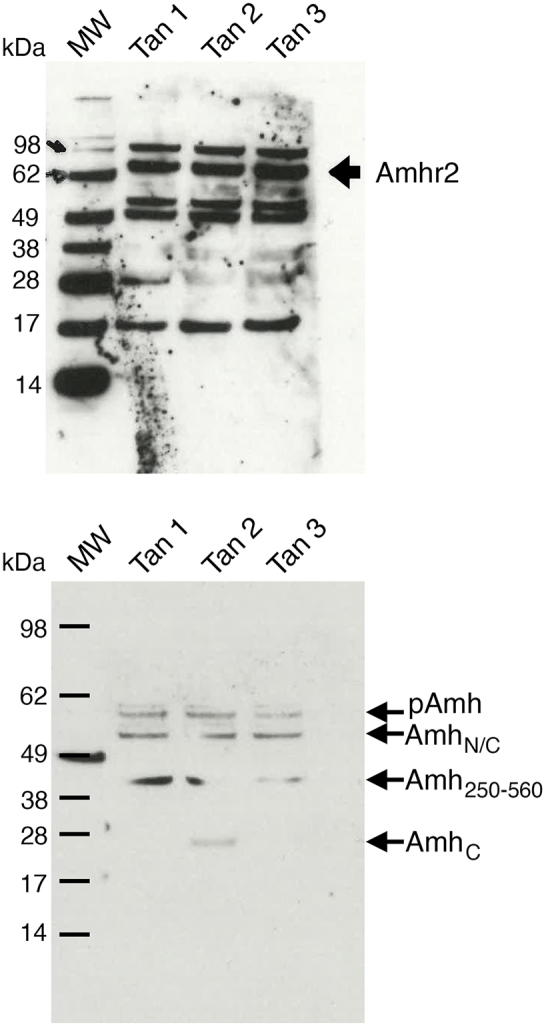
Findings: Increased AMH serum levels are associated with increased hypothalamic activity/axonal-glial signalling in PCOS patients. Furthermore, we demonstrate that AMH promotes profound micro-structural changes in the murine hypothalamic median eminence (ME), creating a permissive environment for GnRH secretion. These include the retraction of the processes of specialized AMH-sensitive ependymo-glial cells called tanycytes, allowing more GnRH neuron terminals to approach ME blood capillaries both during the run-up to ovulation and in a mouse model of PCOS.

Interpretation: We uncovered a central function for AMH in the regulation of fertility by remodeling GnRH terminals and their tanycytic sheaths, and provided insights into the pivotal role of the brain in the establishment and maintenance of neuroendocrine dysfunction in PCOS.

Funding: INSERM (U1172), European Research Council (ERC) under the European Union's Horizon 2020 research and innovation program (grant agreement n° 725149), CHU de Lille, France (Bonus H).

Keywords: AMH; GnRH; Hypothalamus; MR spectroscopy; PCOS; Tanycytes.


Conflict of interest statement

Declaration of interests A.-L.B. received a honorarium from Merck-Serono for a booklet writing on the use of AMH in Assisted Reproductive Technology; G.K. was a recipient of a Research Grant from Société Française de Neuroradiologie that covered part of his salary. All the other authors have declared that no conflict of interest exists.

Figures

Fig. 1
Fig. 1
Increased neuronal activity and axon-glial signalling in the hypothalamus of women with PCOS. Magnetic Resonance Spectroscopy (MRS) analysis of the hypothalamus (a) and thalamus (b) using the volumes of interest shown in a and b, respectively. (c) Representative typical spectrum of proton MR spectroscopy spectrum of hypothalamus along with molecular assignment of resonances (NAA: N-acetyl-aspartate at 2.02 ppm; Cr: creatine at 3.01 ppm; Cho: choline at 3.22 ppm). (d and e) Ratio of the concentrations of NAA to total Cr (creatine + phospho-creatine) in the hypothalamus (d) and thalamus (e) of healthy participants (n = 17) and PCOS volunteers (n = 23). (f and g) Ratio of the concentrations of Cho to total Cr in the hypothalamus (f) and thalamus (g) of healthy women (n = 17) and PCOS women (n = 23). ∗∗P < 0.01, n.s: not significant, Wilcoxon–Mann–Whitney test. The horizontal line in each plot corresponds to the median value. The vertical line represents the 25th–75th percentile range. Abbreviations: CC, corpus callosum; Cd, caudate nucleus; cp, cerebral peduncle; fx, fornix; LV, lateral ventricle; opt, optic tract, Th, thalamus.
Fig. 2
Fig. 2
Lateralized asymmetry of the hypothalamic left tubular inferior region in women with PCOS. (a) Radiological view of subunits hypothalamus segmentation with dark green: right tuberal inferior, dark purple: left tuberal inferior, orange: right posterior, pink: left posterior, dark blue: left anterior-inferior, green: right anterior-inferior, light green: right anterior-superior, white: left anterior-superior, light purple: left tubular superior. (b) Illustrative examples of fiber tracking through hypothalamus subunits in patients and controls, represented in the 3 major planes. Colors code for fiber directions (blue: inferior-superior, red: left-right, green: anterior-posterior). While fiber density appears symmetrical in the control case, a left-right asymmetry is observed in the PCOS patient with increased connectivity of the left side of the hypothalamus (white arrow). (c) Unpaired two-tailed Student's t test comparisons between PCOS (n = 23) and controls (n = 17) for fiber density in each hypothalamic subunit; ∗P < 0.05, n.s: not significant. The horizontal line in each plot corresponds to the median value. The vertical line represents the 25th–75th percentile range.
Fig. 3
Fig. 3
AMH levels and ultrastructural organization of the ME in control and PCOS-animals. (a) Experimental design employed to generate PAMH offspring. (b) Blood samples were derived from control and PAMH female mice at postnatal day 25 (P25; n = 6 controls, n = 6 PAMH) and in adult diestrous animals (2 months; n = 9 controls, n = 11 PAMH) and AMH concentration was measured by ELISA. Mean AMH levels are significantly higher in PAMH females as compared to control mice (unpaired two-tailed Student's t test, ∗P < 0.05). Experiments were replicated three times with comparable results. (c and d) Representative electron micrographs of GnRH-immunoreactive axon terminals (immunogold) from hypothalamic ME dissected from diestrous control (CNTR) or PAMH mice (P90–P120). GnRH axonal endings are highlighted in blue, other neuroendocrine nerve terminals contained in the external layer of the ME are pseudo-coloured in yellow, tanycytic end-feet are pseudo-coloured in green and the pericapillary space (p.s.) in pink. (e) Quantitative analysis of the percentage of area occupied by tanycytes in the external zone of the ME at 2 μm from the pericapillary space, in ME explants from CNTR diestrus mice and PAMH mice (∗P < 0.05; Wilcoxon–Mann–Whitney test; n = 5 controls, N = 58 number of analysed EM photomicrographs in controls; n = 3 PAMH mice, N = 35 number of analysed EM photomicrographs in PAMH mice). (f) Quantitative analysis of the percentage of GnRH nerve terminals located at less than 1 μm from the pericapillary space in the external zone of the ME, in explants from control and PAMH diestrous mice (∗P < 0.05; Wilcoxon–Mann–Whitney test; n = 5 controls, N = 100 number of GnRH-immunoreactive axon terminals measured per explant in controls; n = 3 PAMH mice, N = 100 number of GnRH-immunoreactive axon terminals measured per explant in PAMH mice). The horizontal line in each plot corresponds to the median value. The vertical line represents the 25th–75th percentile range. (g) Correlation of % of GnRH terminals located at less than 1 μm from the pericapillary space versus the % of area occupied by tanycytes in the external zone of the ME at 2 μm from the pericapillary space (r = −0.8, P = 0.015, Spearman's correlation). (h) Electron microscopic image of GnRH-positive terminals (arrows) in the median eminence located in proximity of the portal capillary basal lamina. (i) Electron microscopic image at the same magnification as h showing the lack of gold particles in an ultra-thin section of the median eminence after omission of the primary antibody. (j and k) Representative electron micrographs of GnRH-immunoreactive axon terminals from hypothalamic ME of diestrous control (CNTR) and PAMH mice (P90–P120). Dotted lines depict the surface of a GnRH terminal in a CNTR mouse (blue dotted lines, j) and in a PAMH mouse (red dotted lines, k). Arrows point to individual 18 nm gold particles showing immunogold labelling in large dense-core vesicles. (l) Quantitative analysis of the number of gold particles contained in the GnRH terminals (n = 5 controls, N = 877 number of GnRH terminals analysed in control mice; n = 3 PAMH, N = 682 number of GnRH terminals analysed in PAMH mice). Wilcoxon–Mann–Whitney test, ∗∗∗P < 0.0001. The horizontal line in each plot corresponds to the median value. The vertical line represents the 25th–75th percentile range. Abbreviations: b.l., basal lamina; cap, capillary; ME, median eminence; n, neurons; p.s., pericapillary space; tan, tanycytes; EM, electron microscopy.
Fig. 4
Fig. 4
AMH induces morphological plasticity in the ME of the adult female brain. (a) Schematic representation summarizing the different steps of the EM experiments. (be) Representative electron micrographs of GnRH-immunoreactive axon terminals (immunogold) from hypothalamic explants containing the ME of female rat in diestrus, incubated in the absence (b and c) or the presence (d and e) of AMHC (1 μg/ml) for 30 min. GnRH axonal endings are pseudo-coloured in blue and the pericapillary space (p.s.) in pink. Insets in b and d are high-magnification views of boxes drawn in b and d. Arrowheads in insets point to GnRH-immunoreactive vesicles. (c and e) Photomicrographs were filled with pseudocolors to highlight respectively the GnRH terminals (blue), other neuroendocrine nerve terminals contained in the external layer of the ME (yellow), the pericapillary space (p.s.) in pink and the tanycytic end-feet (green). (f) Quantitative analysis of the percentage of area occupied by tanycytes in the external zone of the ME at 2 μm from the pericapillary space, in explants from rats in diestrus treated or not with AMHC (∗∗∗∗P < 0.0001; Wilcoxon–Mann–Whitney test; n = 5 controls, N = 110 number of analysed EM photomicrographs in controls; n = 3 AMH-treat group, N = 150 number of analysed EM photomicrographs in the AMH-treat group). (g) Quantitative analysis of the percentage of GnRH nerve terminals located at less than 1 μm from the pericapillary space in the external zone of the ME, in explants from rats in diestrus treated or not with AMHC (∗P < 0.05; Wilcoxon–Mann–Whitney test; n = 5 controls, N = 110 number of GnRH-immunoreactive axon terminals measured per explant in controls; n = 3 AMH-treat group, N = 150 number of GnRH-immunoreactive axon terminals measured per explant in the AMH-treat group). The horizontal line in each plot corresponds to the median value. The vertical line represents the 25th–75th percentile range. (h) Schematic representation of the micro-structural changes occurring periodically in the ME during the different phases of the estrous cycle and in diestrous ME explants treated in acute with AMH. Abbreviations: b.l., basal lamina; cap, capillary; EM, electron microscopy; ME, median eminence; n, neurons; p.s., pericapillary space; tan, tanycytes.
Fig. 5
Fig. 5
Expression of AMH and AMHR2 in ME tanycytes. (a) Tanycyte isolation by FACS and real-time PCR analysis in Tomato-positive (pos; tanycytes) and -negative cells (neg) in tdTomatoloxP/+ mice infused i.c.v. with Tat-cre. Tat-cre injection into the third ventricle results in Cre-Lox recombination (red) exclusively in tanycytes. (b) Real-time PCR analysis of indicated genes in tanycytes isolated from Tat-cre;tdTomatoloxP/+ mice, normalized to values in Tomato-negative cells (n = 6 Tomato Pos and n = 6 Tomato Neg; ∗P < 0.05, ∗∗P < 0.005, Wilcoxon–Mann–Whitney test). The horizontal line in each plot corresponds to the median value. The vertical line represents the 25th–75th percentile range. (c and d) Representative immunofluorescence experiment for AMHC in coronal sections of the mouse ME depicting AMH expression in ME tanycytes and along their processes (n = 3 brains for each experiment, 3- to 4-month-old female mice. Experiments were repeated three times). (e and f) AMHR2 expression was analysed in coronal sections of ME of AMHR2-Cre;Z/EloxP/-,βgeo/+ (AMHR2-EGFP) knock-in reporter line (n = 3 brains for each experiment, 3- to 4-month-old female mice. Experiments were done in triplicates). EGFP is expressed by tanycytes (Tan), endothelial cells (ec) and by cells of the arcuate nucleus (ARN). Scale bars, (c and e) 50 μm; (d and f) 20 μm. (g) Schematic representing the generation of primary tanycytic cultures. (h) Western blotting for AMH and AMHR2 in rat tanycytic primary cultures. (i and j) Representative photomicrographs of a scratch-wound-healing assay performed on primary tanycytes treated or not for 48 h with recombinant AMH (100 ng/ml; n = 5 independent experiments). Dotted lines indicate the borders of the scratch. After 48 h of exposure to AMH, tanycytes invade a greater area of the scratch in control cultures (PBS-treated; i) than in AMH-treated cultures (j). Tanycytes were stained using F-actin (red). Scale bars, (i and j) 100 μm. (k) Quantitative analysis of the % area covered by tanycytes in control and AMH-treated conditions (n = 13 Control and n = 17 AMH-treated; ∗∗∗P < 0.0005, Wilcoxon–Mann–Whitney test). The horizontal line in each plot corresponds to the mean value. The vertical line represents the S.E.M.
Supplemental Western blots

Comment in

References

    1. Christian C.A., Moenter S.M. The neurobiology of preovulatory and estradiol-induced gonadotropin-releasing hormone surges. Endocr Rev. 2010;31(4):544–577. - PMC - PubMed
    1. Belchetz P.E., Plant T.M., Nakai Y., Keogh E.J., Knobil E. Hypophysial responses to continuous and intermittent delivery of hypopthalamic gonadotropin-releasing hormone. Science. 1978;202(4368):631–633. - PubMed
    1. Prevot V., Bellefontaine N., Baroncini M., et al. Gonadotrophin-releasing hormone nerve terminals, tanycytes and neurohaemal junction remodelling in the adult median eminence: functional consequences for reproduction and dynamic role of vascular endothelial cells. J Neuroendocrinol. 2010;22(7):639–649. - PMC - PubMed
    1. Parkash J., Messina A., Langlet F., et al. Semaphorin7A regulates neuroglial plasticity in the adult hypothalamic median eminence. Nat Commun. 2015;6:6385. - PMC - PubMed
    1. Giacobini P., Parkash J., Campagne C., et al. Brain endothelial cells control fertility through ovarian-steroid-dependent release of semaphorin 3A. PLoS Biol. 2014;12(3) - PMC - PubMed

Substances