. 2023 Mar 30;186(7):1493-1511.e40.
doi: 10.1016/j.cell.2023.02.018.

The EN-TEx resource of multi-tissue personal epigenomes & variant-impact models

Joel Rozowsky  1 Jiahao Gao  2 Beatrice Borsari  3 Yucheng T Yang  4 Timur Galeev  2 Gamze Gürsoy  2 Charles B Epstein  5 Kun Xiong  2 Jinrui Xu  2 Tianxiao Li  2 Jason Liu  2 Keyang Yu  6 Ana Berthel  2 Zhanlin Chen  7 Fabio Navarro  2 Maxwell S Sun  2 James Wright  8 Justin Chang  2 Christopher J F Cameron  2 Noam Shoresh  5 Elizabeth Gaskell  5 Jorg Drenkow  9 Jessika Adrian  10 Sergey Aganezov  11 François Aguet  5 Gabriela Balderrama-Gutierrez  12 Samridhi Banskota  5 Guillermo Barreto Corona  5 Sora Chee  13 Surya B Chhetri  14 Gabriel Conte Cortez Martins  2 Cassidy Danyko  9 Carrie A Davis  9 Daniel Farid  2 Nina P Farrell  5 Idan Gabdank  10 Yoel Gofin  6 David U Gorkin  13 Mengting Gu  2 Vivian Hecht  5 Benjamin C Hitz  10 Robbyn Issner  5 Yunzhe Jiang  2 Melanie Kirsche  11 Xiangmeng Kong  2 Bonita R Lam  10 Shantao Li  2 Bian Li  2 Xiqi Li  6 Khine Zin Lin  10 Ruibang Luo  15 Mark Mackiewicz  14 Ran Meng  2 Jill E Moore  16 Jonathan Mudge  17 Nicholas Nelson  5 Chad Nusbaum  5 Ioann Popov  2 Henry E Pratt  16 Yunjiang Qiu  13 Srividya Ramakrishnan  11 Joe Raymond  5 Leonidas Salichos  18 Alexandra Scavelli  9 Jacob M Schreiber  19 Fritz J Sedlazeck  20 Lei Hoon See  9 Rachel M Sherman  11 Xu Shi  2 Minyi Shi  10 Cricket Alicia Sloan  10 J Seth Strattan  10 Zhen Tan  2 Forrest Y Tanaka  10 Anna Vlasova  21 Jun Wang  2 Jonathan Werner  9 Brian Williams  22 Min Xu  2 Chengfei Yan  2 Lu Yu  8 Christopher Zaleski  9 Jing Zhang  23 Kristin Ardlie  5 J Michael Cherry  10 Eric M Mendenhall  14 William S Noble  19 Zhiping Weng  16 Morgan E Levine  24 Alexander Dobin  9 Barbara Wold  22 Ali Mortazavi  12 Bing Ren  13 Jesse Gillis  25 Richard M Myers  14 Michael P Snyder  10 Jyoti Choudhary  8 Aleksandar Milosavljevic  6 Michael C Schatz  26 Bradley E Bernstein  27 Roderic Guigó  28 Thomas R Gingeras  29 Mark Gerstein  30
Affiliations

The EN-TEx resource of multi-tissue personal epigenomes & variant-impact models

Joel Rozowsky et al. Cell. .

Abstract

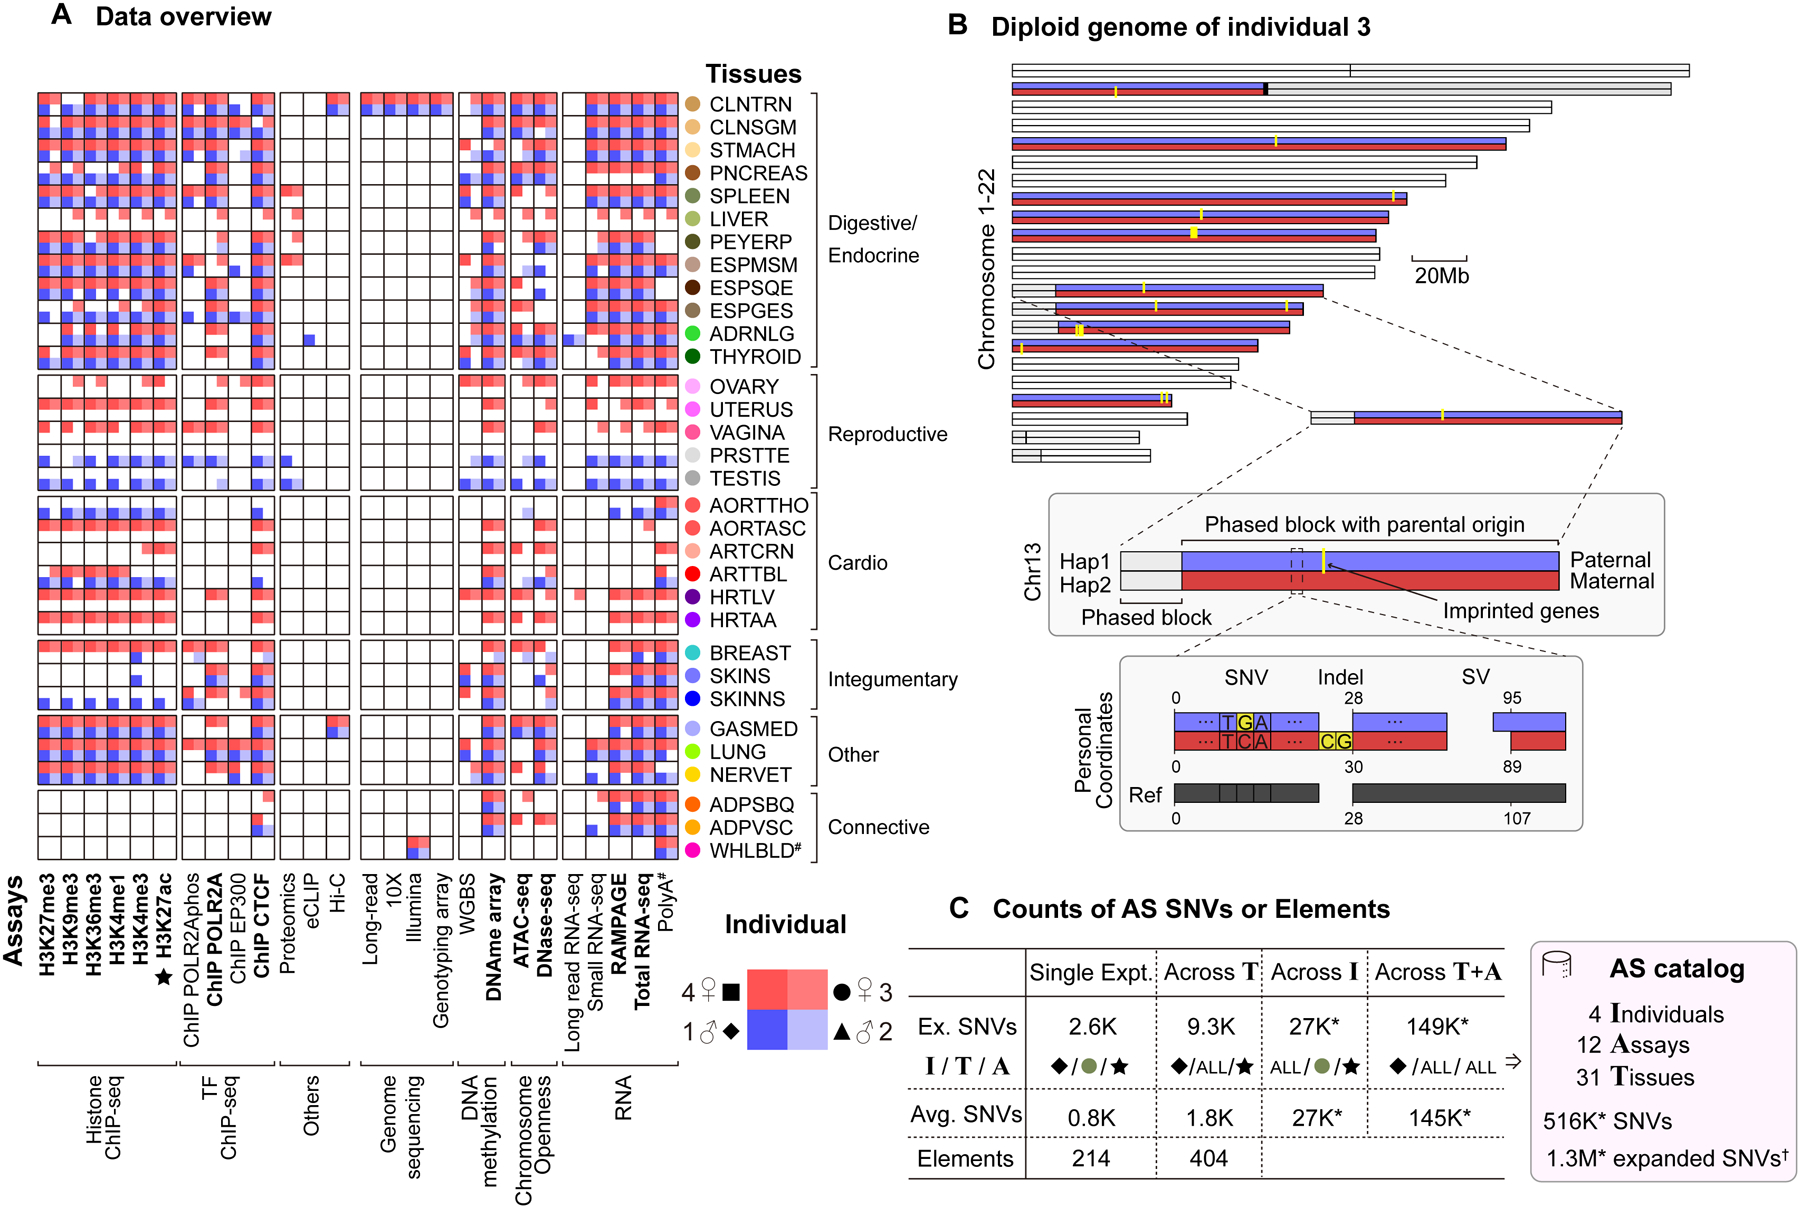
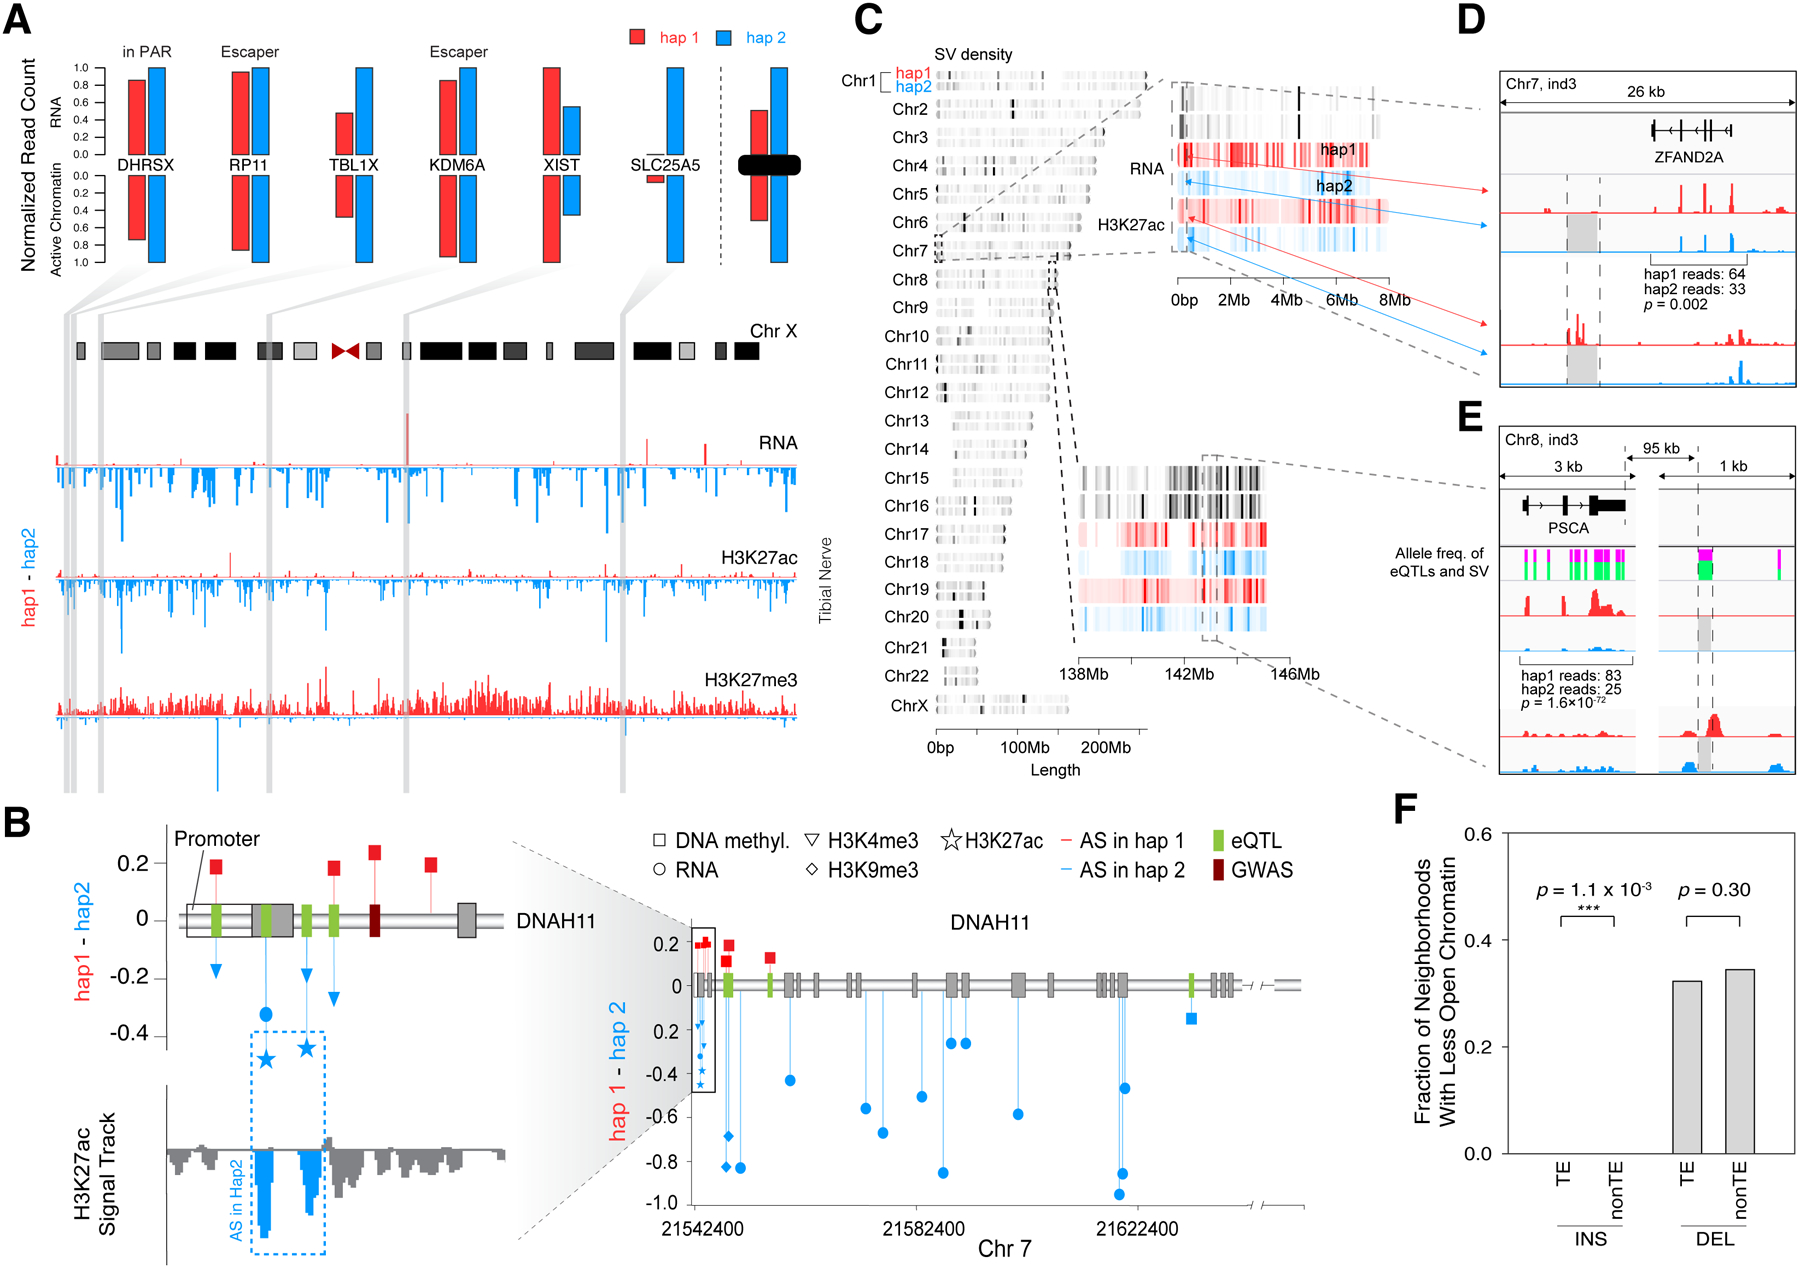
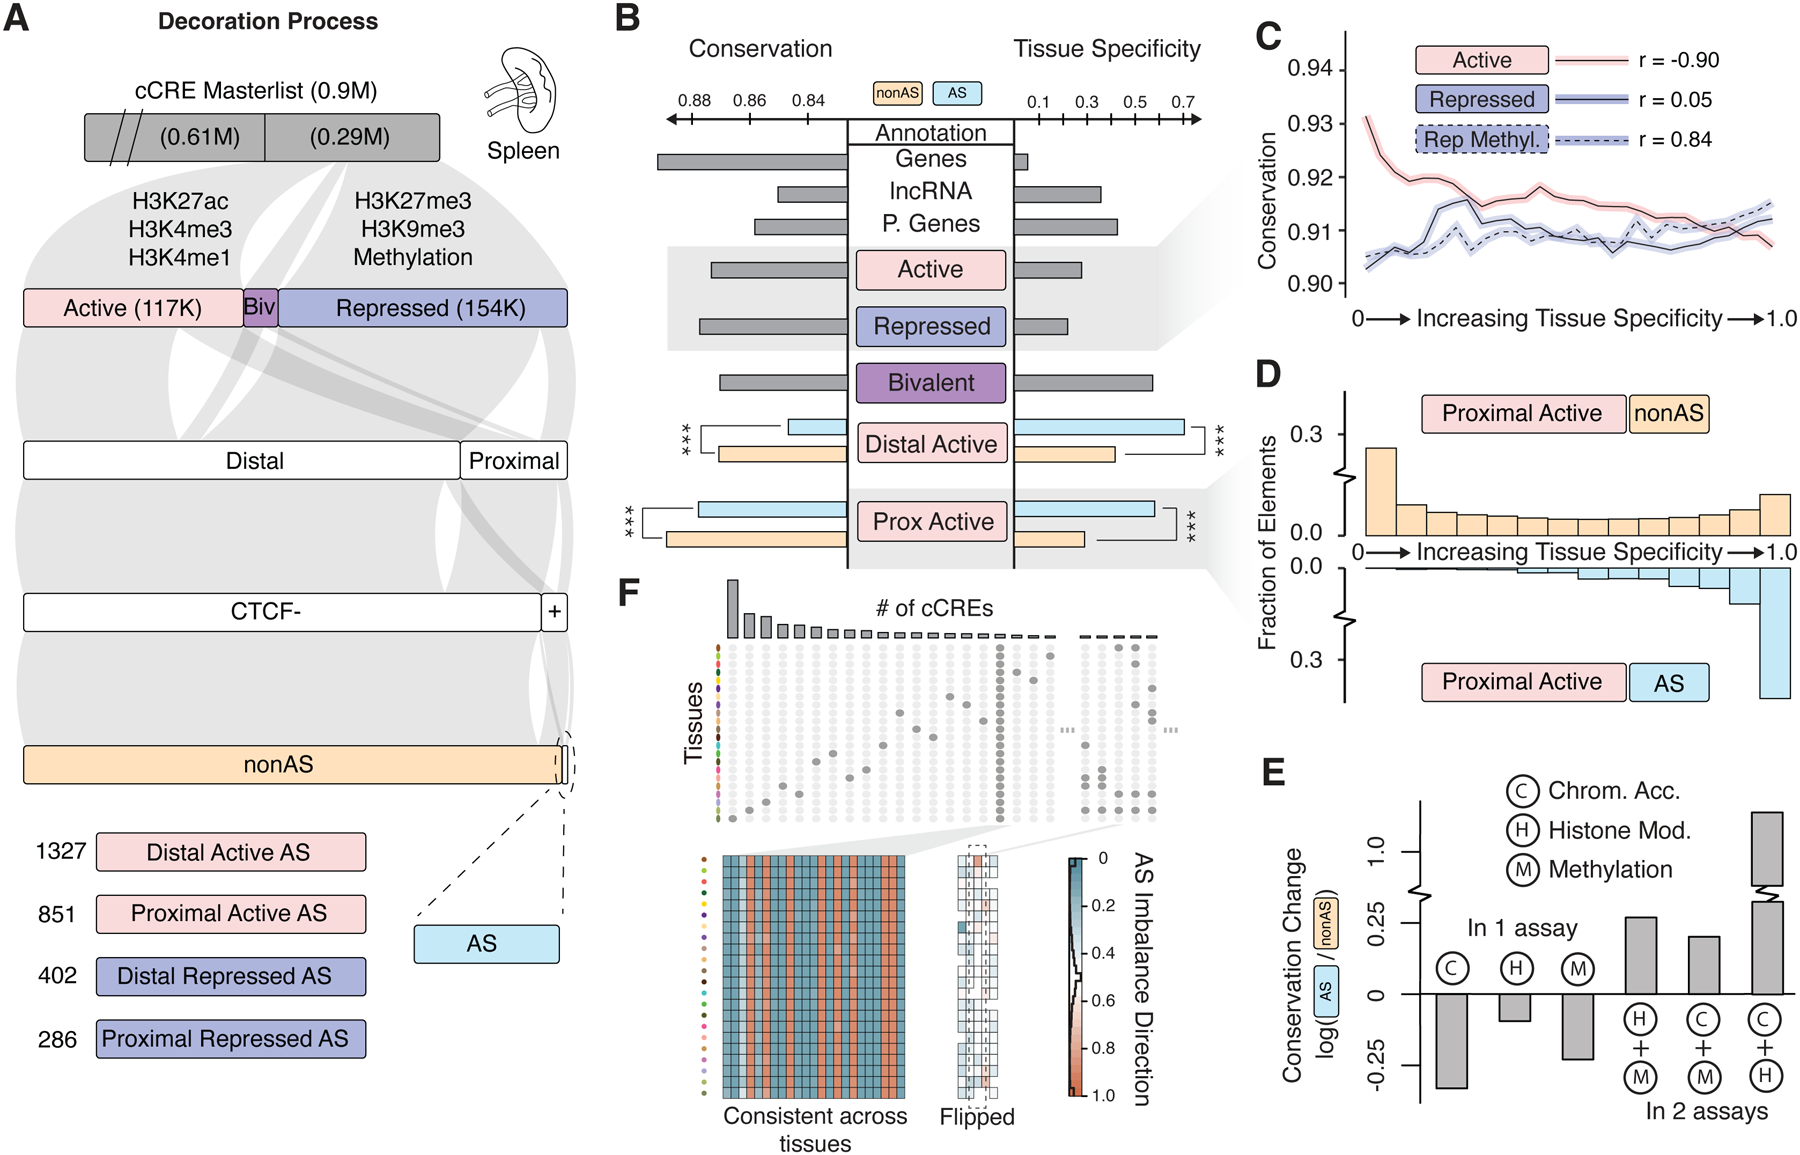
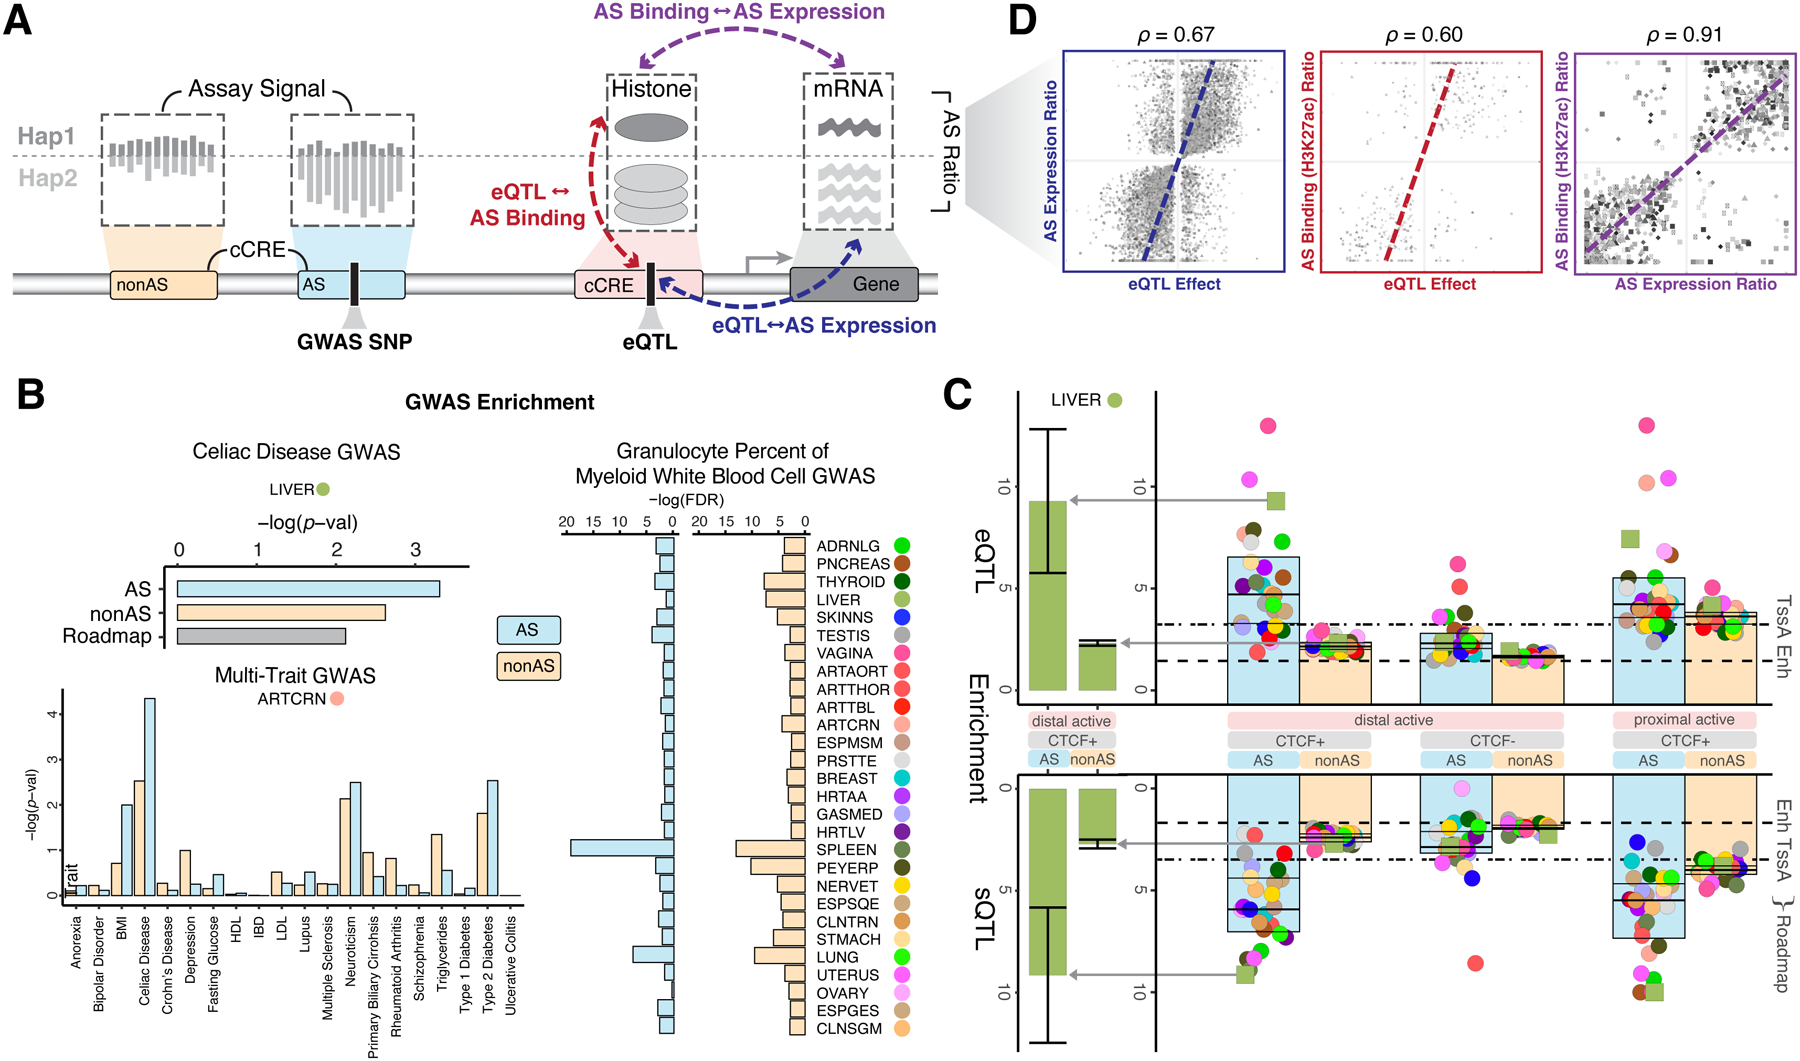
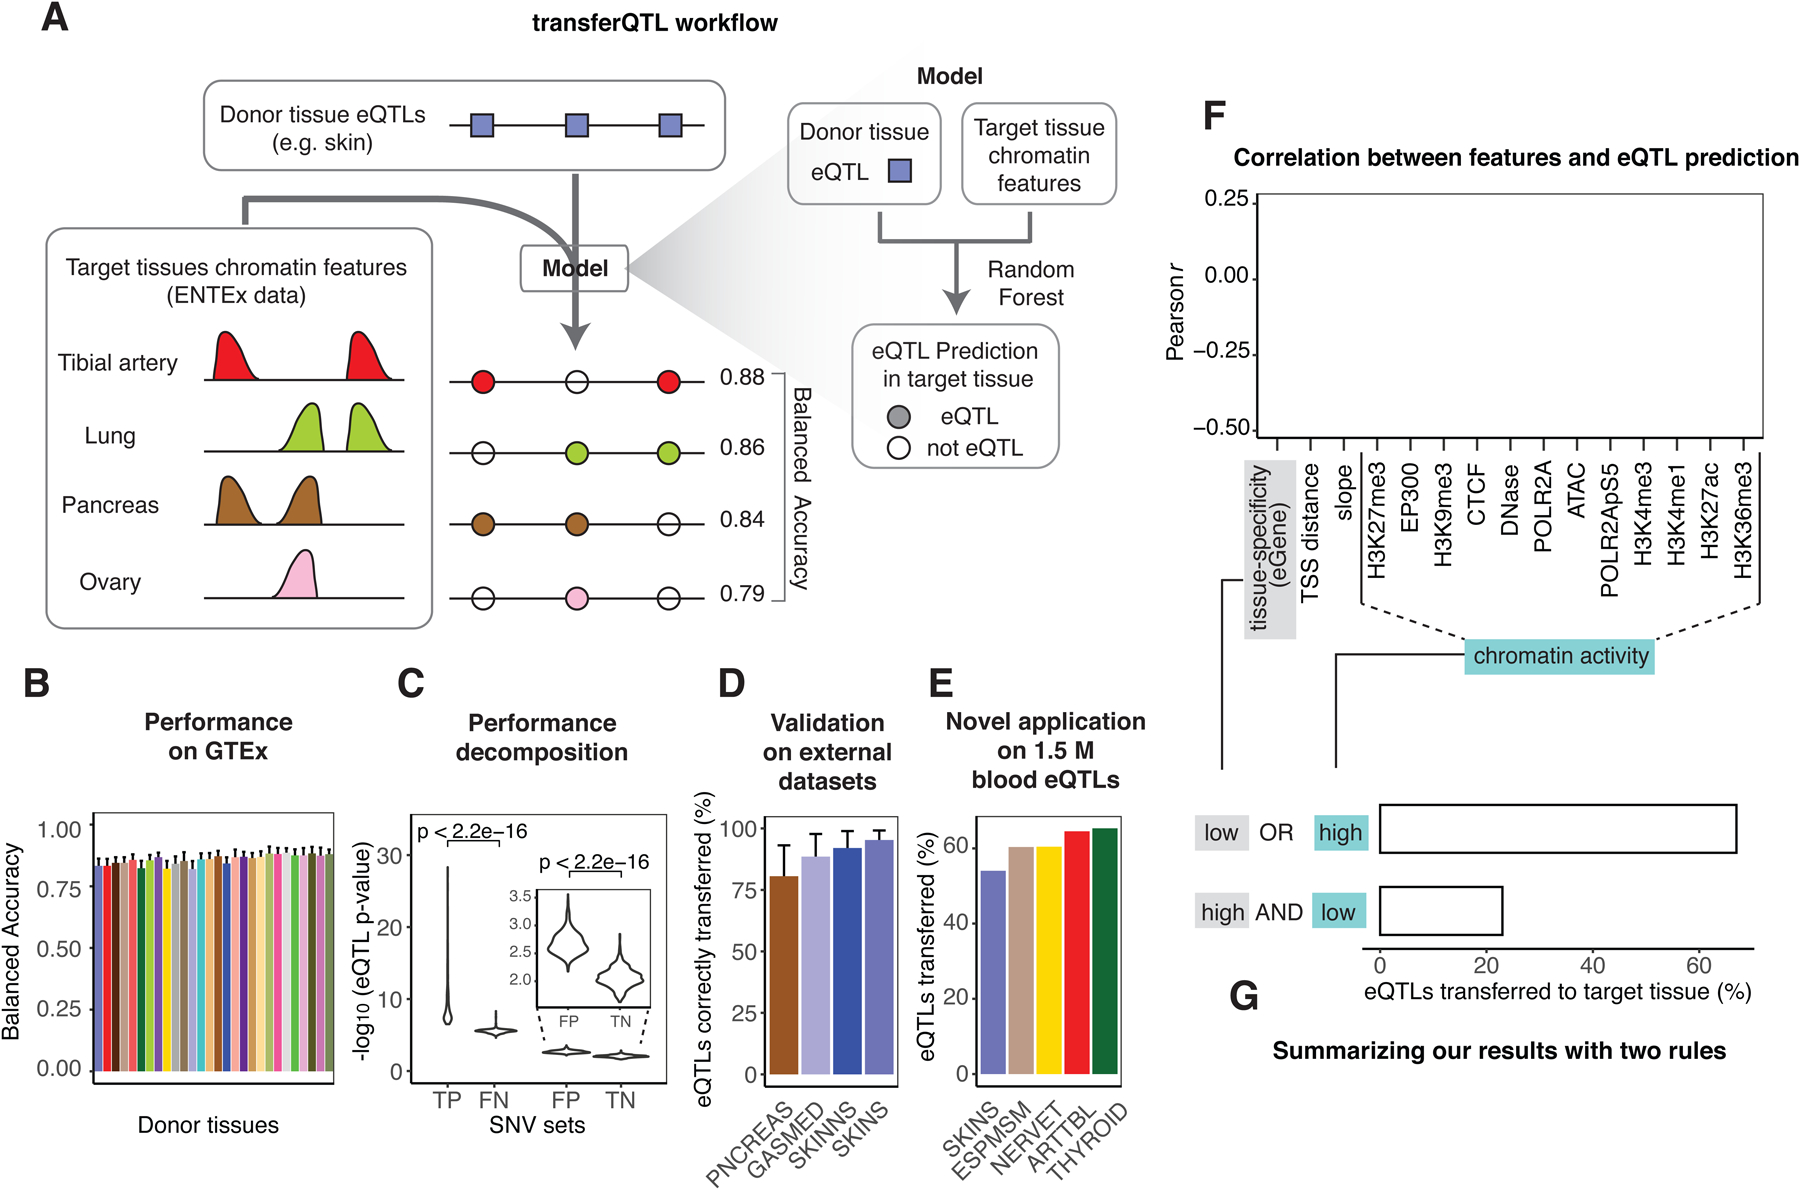
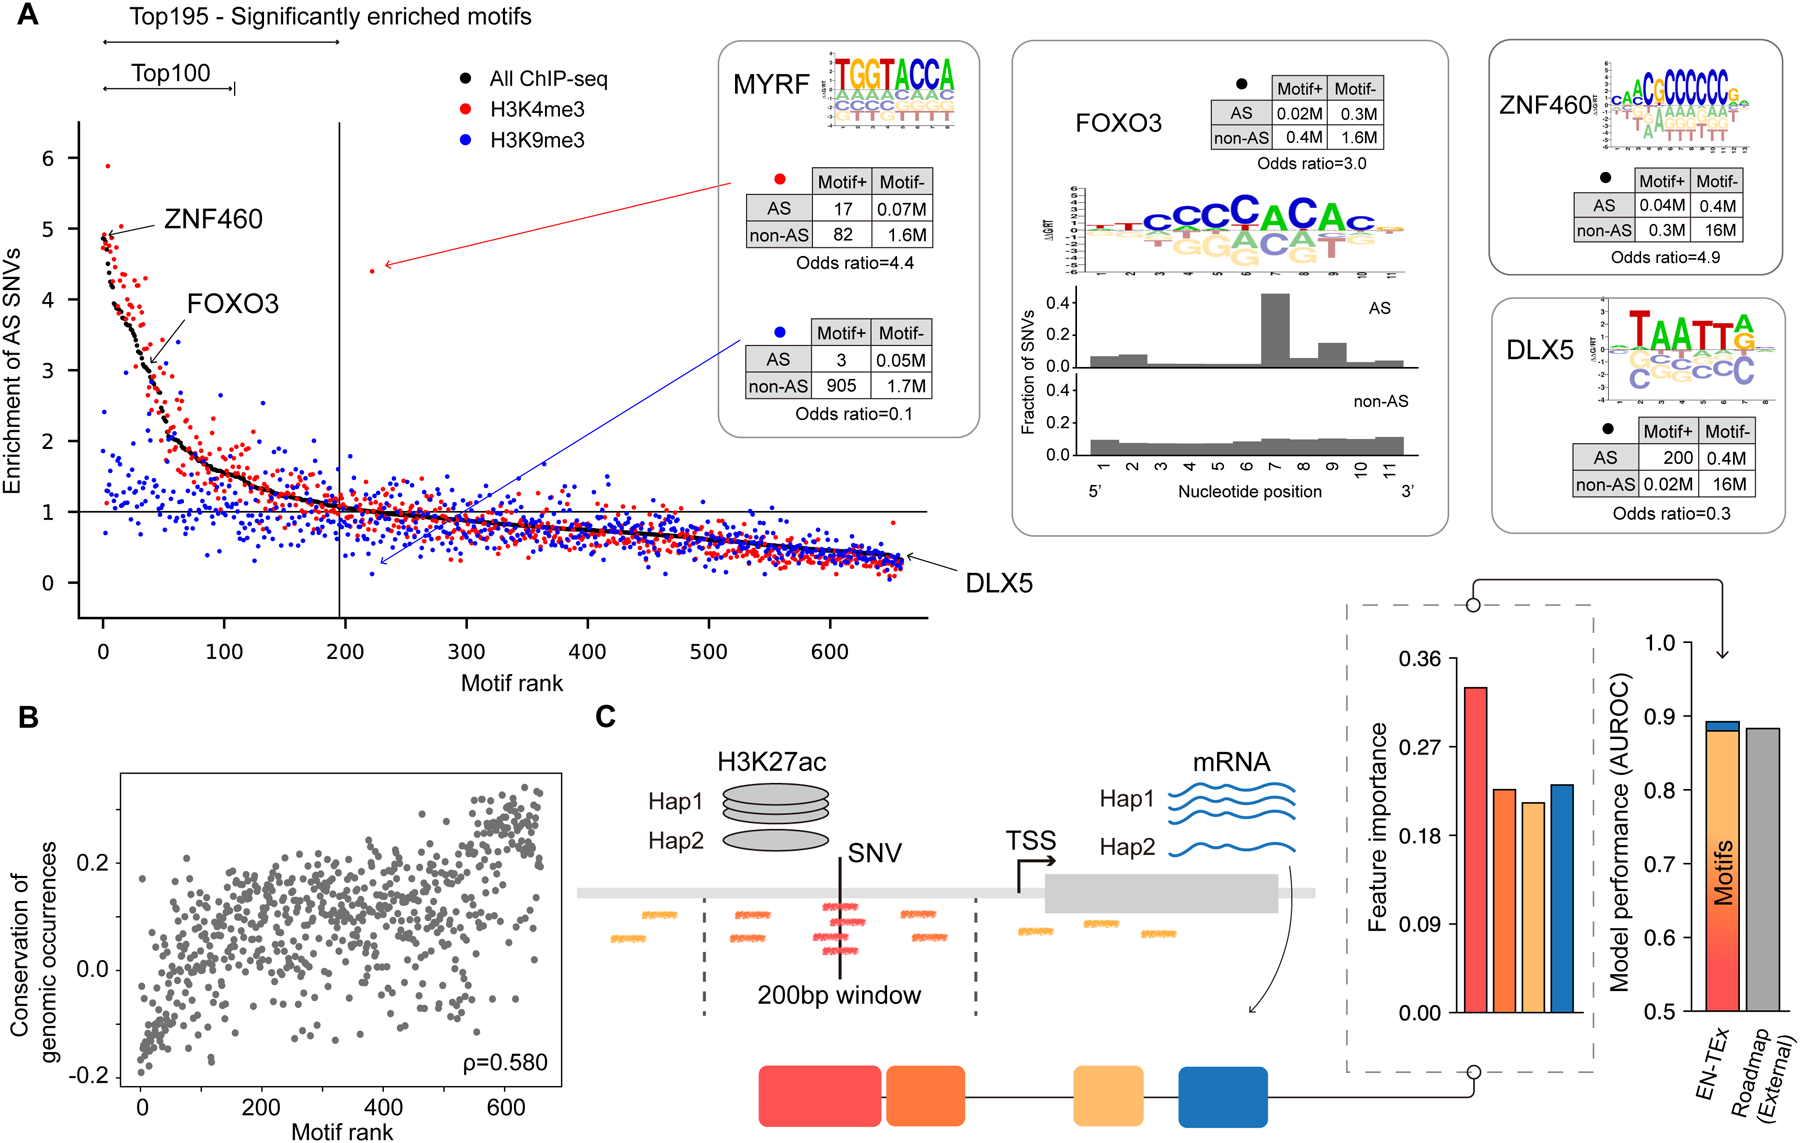
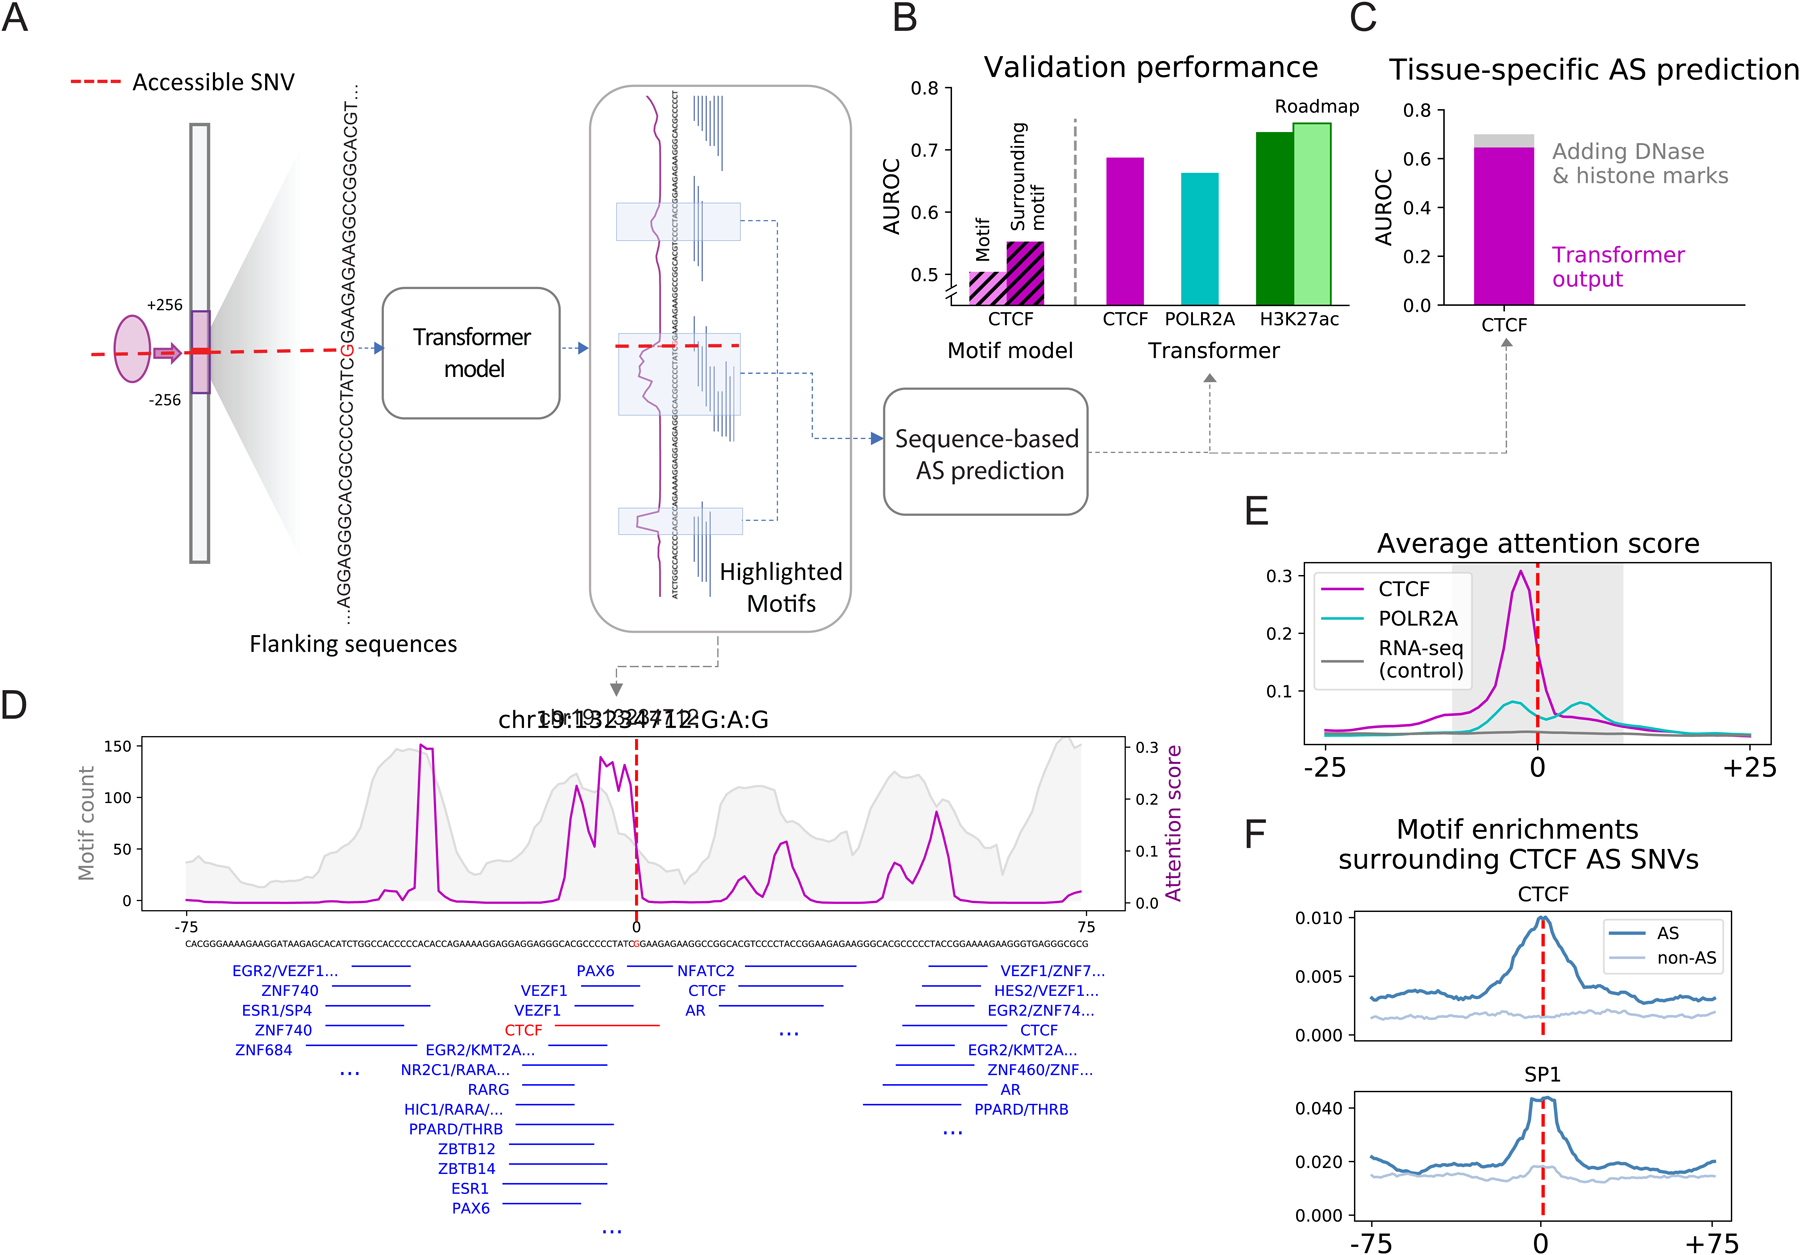
Understanding how genetic variants impact molecular phenotypes is a key goal of functional genomics, currently hindered by reliance on a single haploid reference genome. Here, we present the EN-TEx resource of 1,635 open-access datasets from four donors (∼30 tissues × ∼15 assays). The datasets are mapped to matched, diploid genomes with long-read phasing and structural variants, instantiating a catalog of >1 million allele-specific loci. These loci exhibit coordinated activity along haplotypes and are less conserved than corresponding, non-allele-specific ones. Surprisingly, a deep-learning transformer model can predict the allele-specific activity based only on local nucleotide-sequence context, highlighting the importance of transcription-factor-binding motifs particularly sensitive to variants. Furthermore, combining EN-TEx with existing genome annotations reveals strong associations between allele-specific and GWAS loci. It also enables models for transferring known eQTLs to difficult-to-profile tissues (e.g., from skin to heart). Overall, EN-TEx provides rich data and generalizable models for more accurate personal functional genomics.

Keywords: ENCODE; GTEx; allele-specific activity; eQTLs; functional epigenomes; functional genomics; genome annotations; personal genome; predictive models; structural variants; tissue specificity; transformer model.


Conflict of interest statement

Declaration of interests Z.W. co-founded and serves as a scientific advisor for Rgenta Inc. B.E.B. declares outside interests in Fulcrum Therapeutics, HiFiBio, Arsenal Biosciences, Cell Signaling Technologies, Chroma Medicine, and Design Pharmaceuticals. M.G. is on the advisory board for HypaHub, Inc. and Elysium Health.

Figures

Figure 1.
Figure 1.. Uniform Multi-tissue Data Collection, Diploid Mapping and Construction of the AS Catalog
(A) Data matrix. The 13 core assays are indicated in bold; tissue colors from GTEx. (Details in Figure S1A.) (B) The personal diploid genome of individual 3. The chromosomes are phased with known imprinting events (yellow), allowing the maternal (red) or paternal (blue) origin of many of the phased blocks to be identified. A schematic diagram of a region in chr13 shows the differences between the personal diploid genome and the reference genome, in particular their different coordinate systems and sequences. (Details in Data S2G and STAR Methods “Personal Genome” Section.) (C) The AS catalog. Key statistics are shown at each level of pooling and averaging. By aggregating across tissues, individuals or assays, we were able to identify a large number of AS SNVs and AS genomic elements, resulting in an AS catalog. “*” indicates the aggregation was done by pooling of reads, instead of the default union method, which significantly increased detection power. Representative numbers in the “Ex. SNVs” row are initially based on a specific H3K27ac experiment in the spleen of individual 1. The I/T/A row shows whether this choice is continued in subsequent columns or whether averaging or pooling is done over “ALL” the individuals, tissues, or assays, respectively. “†” indicates AS SNVs from DNase and WGBS in addition to the 12 RNA/ChIP/ATAC assays. (Details in Figure S3A–D and STAR Methods “AS Catalog” Section.)
Figure 2.
Figure 2.. Examples of Coordinated AS Activity, Involving SNVs and SVs
(A) Detecting coordinated AS activity across a chromosome. Signal tracks (bottom) show that for chrX in the tibial nerve of individual 3, hap1 generally has lower expression levels, lower H3K27ac levels, and higher H3K27me3 levels than hap2. The top bar-graphs show the expression and active promoter chromatin of 6 selected genes. (Details in Data S14.) (B) AS events at a disease-associated locus: the DNAH11 gene. The lollipop diagrams show the degree of AS imbalance for various assays at heterozygous SNPs in individual 1. Those that are GTEx eQTLs and GWAS loci are highlighted. (Details in STAR Methods “AS Examples” Section.) (C) The chromosomal distribution of SVs on the diploid genome. Colors indicate the density of SVs. Genomic regions of chr7 and chr8 (in individual 3) are enlarged to show the positions of detected SVs and the levels of H3K27ac and RNA expression obtained from transverse colon. (D) The effect of a 2.6 kb deletion. The deletion in hap2 removed several H3K27ac peaks and reduced ZFAND2A expression in thyroid. (Details in Data S17C–D.) (E) The effect of a 98-bp deletion. The deletion in hap2 in individual 3 removed a H3K27ac peak in colon downstream of PSCA, potentially contributing to reduced expression. The heights of the green bars indicate the allele frequencies of the deletion and the surrounding GTEx eQTL SNVs, indicating they are potentially in linkage disequilibrium. (Details in Data S17G–H.) (F) Overall effect of TEs on chromatin. The genomic regions neighboring the TE insertions show reduced chromatin accessibility more often than those of the non-TE insertions. (Details in Data S18 and STAR Methods “SVs” Section.)
Figure 3.
Figure 3.. Aspects of Application 1: Decorating ENCODE Elements with EN-TEx Tissue & AS Information
(A) Workflow decorating cCREs with EN-TEx data. The workflow starts with the master list of 0.9M cCREs from ENCODE, which have no tissue-specific information. Representative numbers from spleen are shown along the flowchart. (Details in Figure S5.) (B) Tissue specificity and conservation of annotations. The tissue specificity of an annotation category is the fraction of the cCREs observed in the category active in only a single tissue. A smaller value indicates that the category members are more ubiquitous. Conservation score is determined by the fraction of rare variants in the genomic regions of an annotation category. Stars indicate statistically significant differences. (Details in in Data S22 and STAR Methods “Tissue Specificity” Section.) (C) Correlation between tissue specificity and conservation for active and repressed cCREs. Repressed cCREs with methylation show increased significance. (D) Comparing the tissue distribution of AS and non-AS proximal active cCREs. (Top) Non-AS categories show a “U-shaped” trend, whereas (Bottom) AS categories have an “L-shaped” one. Fraction of Elements is described in the STAR Methods “Tissue Specificity” Section. (E)AS events occurring in 1 or 2 assays and their relationship to purifying selection. AS events are for chromatin accessibility (Hi-C, DNAse-seq and ATAC-seq), histone modification (H), methylation (M). The change in conservation between an AS category and the corresponding non-AS one is shown as the log ratio of their conservation scores (from B). This ratio is negative for AS events in one assay and positive for AS events in two assays, suggesting that an AS SNV with multiple events is more conserved. (F)Consistency of AS imbalance across tissues. The heatmap shows the direction of the allelic imbalance across the most ubiquitous AS cCREs (in individual 3). The imbalance direction is consistent across tissues; however, a few tissue-specific cCREs show directional flips. (Details in Data S22G.)
Figure 4.
Figure 4.. Aspects of Applications 1 and 2: Relating Decorations and AS SNVs to GWAS & eQTL Loci
(A) Schematic showing the inter-relationship of AS activity, GWAS SNPs and eQTLs. (B) Higher GWAS enrichment for AS elements compared to the corresponding non-AS ones. Top left shows one tissue and one trait, compared to the Roadmap Project. Bottom left shows an extension to many traits for one tissue, and right shows many tissues for one trait. (Details in Data S25 and STAR Methods “Decoration Enrichments” Section.) (C) QTL enrichment for decorated cCREs. Colored dots show the enrichment for each tissue (GTEx colors, Figure 1A and Data S2I). Each bar shows the median enrichment over all tissues for a given annotation subset. As a reference, median enrichment of Roadmap “Enh” and “TssA” annotations are shown as dashed and dotted lines, respectively. The enrichments for the liver are highlighted. Robustness is estimated by resampling genetic variants, providing a range of enrichments shown with whiskers (Details in Data S24 and STAR Methods “Decoration Enrichments” Section.) (D) Compatibility between AS gene expression, AS binding in the upstream promoter, and eQTL effect. eQTL effect is measured by the beta coefficient, and for AS, the imbalance ratio is plotted. (Details in Figure S5C–D; all correlations are statistically significant.)
Figure 5.
Figure 5.. Aspects of Application 2: Modeling eQTLs in Hard-to-obtain Tissues
(A) Schema of the transferQTL model. For a catalog of eQTLs active in a source tissue (donor), we transfer them to another tissue (target) by leveraging the chromatin in the target and other features. (Details in Figure S6C.) For several representative target tissues the balanced accuracy is shown for transferring skin eQTLs. (B) Performance of the model. The X-axis indicates the tissues used as the donors (GTEx coloring), and the Y-axis indicates the average performance (balanced accuracy) across the target tissues. The whiskers indicate variation across targets (standard deviations). (Details in Data S28CD.) (C) Performance decomposition. For the confusion matrix resulting from applying the model to known GTEx eQTLs, we plotted the distribution of mean p-values on each subset. (D) External validation. We validated our transferred eQTLs against four eQTLs catalogs other than GTEx: pancreas (PNCREAS), skeletal muscle (GASMED), suprapubic skin (SKINNS), and lower-leg skin (SKINS). The Y axis corresponds to the sensitivity of the prediction (TP / (TP + FN)). (Details in the STAR Methods “transferQTL Model” Section.) (E) Large-scale application. We applied the model to a set of ~1.5 M eQTLs from blood (as donor). We were able to transfer a large proportion of these to EN-TEx target tissues. The plot shows the five tissues with the largest fractions transferred. (Details in Data S28F–G.) (F) Importance of the features in the model. We computed the correlation between 15 selected features and the model’s probability of classifying donor-tissue eQTLs as eQTLs in the target tissue. The bar plot shows, for each feature, the strongest correlation observed across all 756 donor-target tissue pairs. (Details in Data S29A.) (G) Schematic showing how two simple rules help predict eQTLs in a target tissue. To summarize F, we have found that two observations help define transferQTL. As an example, we show the results obtained when transferring eQTLs from testis (donor) to thyroid (target). (Details in STAR Methods “transferQTL Model” Section and Data S29B.)
Figure 6.
Figure 6.. Aspects of Application 3: Highlighting “Sensitive” TF Motifs
(A) TF Motifs ranked by enrichment of AS SNVs. We calculated the enrichment of AS SNVs for each TF using 2-by-2 contingency tables, with representative ones shown in the figure. For the representative TFs we also show a motif logo (and, for FOXO3, the location of the overlapping AS or non-AS SNVs). In the scatter plot, the dots correspond to TF motifs, which are ranked by AS enrichment. Colors indicate different histone modifications. (Details in Data S30 and STAR Methods “Sensitive Motifs” Section.) (B) TF motif ranking is correlated with conservation of the motif regions. (Details in STAR Methods “Sensitive Motifs” Section.) (C) Schematic of a statistical model predicting AS promoter activity. The model predicts whether a promoter exhibits AS H3K27ac activity. Motifs of ranked TFs (colored short lines) were used as features of the model in addition to AS expression ratio. Right-hand-side bar charts show feature weights and the overall performance of the model, in comparison to Roadmap. Model performance is dominated by the motifs, with only marginal improvement from adding AS expression imbalance. (Details in the STAR Methods “AS Promoter” Section.)
Figure 7.
Figure 7.. Aspects of Application 3: Deep-learning Model Predicting AS Activity from Nucleotide Sequence.
(For all sub-panels, details are in Figure S7, Data S32, and STAR Methods “Transformer Model” Section.) (A) Schematic of the sequence-based predictive model. A transformer model was trained on the flanking regions (128 bp) of accessible SNVs to predict whether or not they are AS. The attention score (magenta lines) reflects the weights the model attaches to different nucleotide positions in the input sequences. (B) Average performance of models predicting AS activity. As a reference, the CTCF model was compared to simple logistic regression models with the only information being (1) CTCF-motifs overlapping the SNV or (2) CTCF-motifs in a neighborhood around the SNV. For the H3K27ac model, the prediction was also validated against external data from Roadmap. (C) Performance of a tissue-specific model for CTCF. Adding epigenomic features only marginally improved the performance over just sequence features. (D) Attention patterns learned by the model. Those in the flanking regions of a selected CTCF AS SNV (magenta) show strong consistency with motif enrichment (gray). The central peak surrounding the SNV contains a CTCF motif, highlighted in red. (E) Average attention pattern of sequence-based models for various assays. (F) Motif enrichment surrounding the AS CTCF SNV agrees with the average attention pattern in E.

Comment in

  • Epigenomes get personal.
    Koch L. Koch L. Nat Rev Genet. 2023 Jun;24(6):346. doi: 10.1038/s41576-023-00604-x. Nat Rev Genet. 2023. PMID: 37055612 No abstract available.

References

    1. Collins FS, Green ED, Guttmacher AE, Guyer MS, and Institute USNHGR (2003). A vision for the future of genomics research. Nature 422, 835–847. 10.1038/nature01626. - DOI - PubMed
    1. Venter JC, Adams MD, Myers EW, Li PW, Mural RJ, Sutton GG, Smith HO, Yandell M, Evans CA, Holt RA, et al. (2001). The sequence of the human genome. Science 291, 1304–1351. 10.1126/science.1058040. - DOI - PubMed
    1. Stephens ZD, Lee SY, Faghri F, Campbell RH, Zhai C, Efron MJ, Iyer R, Schatz MC, Sinha S, and Robinson GE (2015). Big Data: Astronomical or Genomical? PLoS Biol 13, e1002195. 10.1371/journal.pbio.1002195. - DOI - PMC - PubMed
    1. Nurk S, Koren S, Rhie A, Rautiainen M, Bzikadze AV, Mikheenko A, Vollger MR, Altemose N, Uralsky L, Gershman A, et al. (2022). The complete sequence of a human genome. Science 376, 44–53. 10.1126/science.abj6987. - DOI - PMC - PubMed
    1. Genomes Project C, Auton A, Brooks LD, Durbin RM, Garrison EP, Kang HM, Korbel JO, Marchini JL, McCarthy S, McVean GA, and Abecasis GR (2015). A global reference for human genetic variation. Nature 526, 68–74. 10.1038/nature15393. - DOI - PMC - PubMed

Publication types

LinkOut - more resources