. 2023 Apr 24;33(8):1459-1471.e3.
doi: 10.1016/j.cub.2023.03.018. Epub 2023 Mar 30.

Proprioception gates visual object fixation in flying flies

Affiliations

Proprioception gates visual object fixation in flying flies

Martha Rimniceanu et al. Curr Biol. .

Abstract

Visual object tracking in animals as diverse as felines, frogs, and fish supports behaviors including predation, predator avoidance, and landscape navigation. Decades of experimental results show that a rigidly body-fixed tethered fly in a "virtual reality" visual flight simulator steers to follow the motion of a vertical bar, thereby "fixating" it on visual midline. This behavior likely reflects a desire to seek natural features such as plant stalks and has inspired algorithms for visual object tracking predicated on robust responses to bar velocity, particularly near visual midline. Using a modified flight simulator equipped with a magnetic pivot to allow frictionless turns about the yaw axis, we discovered that bar fixation as well as smooth steering responses to bar velocity are attenuated or eliminated in yaw-free conditions. Body-fixed Drosophila melanogaster respond to bar oscillation on a stationary ground with frequency-matched wing kinematics and fixate the bar on midline. Yaw-free flies respond to the same stimulus by ignoring the bar and maintaining their original heading. These differences are driven by proprioceptive signals, rather than visual signals, as artificially "clamping" a bar in the periphery of a yaw-free fly has no effect. When presented with a bar and ground oscillating at different frequencies, a yaw-free fly follows the frequency of the ground only, whereas a body-fixed fly robustly steers at the frequencies of both the bar and ground. Our findings support a model in which proprioceptive feedback promote active damping of high-gain optomotor responses to object motion.

Keywords: feature detection; fly vision; navigation; optomotor.


Conflict of interest statement

Declaration of interests The authors declare no competing interests.

Figures

Figure 1.
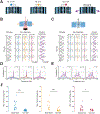
Figure 1.. Sensory feedback conditions vary across rigid and magnetic tethering paradigms.
A. (left) Conceptual block diagram of signal flow in the visual and proprioceptive modalities. Flight behavior generates feedback within sensory pathways. These channels can be opened or closed in different experimental paradigms. (right) Visual sensory feedback is primarily relayed through the eyes while proprioceptive feedback is relayed through multiple sensory structures covering the entire body, such as wings, halteres and aristae of the antennae. B. In a rigid tether arena, the fly’s body is fixed to a stationary pin, the fly is illuminated with infrared light from above and wing steering kinematics are measured using a photodiode below. The difference in wing beat amplitude across the two wings (ΔWBA) is representative of steering torque, and can be coupled with variable gain to control the velocity of visual patterns such as a textured “motion-defined” bar on the LED display (outlined in dotted white line). In this condition the visual feedback channel is artificially closed but the proprioceptive feedback channel remains open since the fly’s body is stationary. C. In a magnetic tether arena (top), the fly’s body is glued to a magnetic pin suspended between magnetic north and south poles. The fly’s body is free to rotate in the yaw plane and orient toward visual cues. In this condition, the proprioceptive and visual feedback channels are both closed in the yaw plane of motion (bottom). The fly’s instantaneous angular heading in the 360° arena is recorded with a high speed camera from below the animal.
Figure 2.
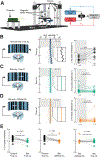
Figure 2.. Active bar fixation is body-state dependent.
Comparison of body-fixed artificial closed loop conditions in which steering effort of the stationary fly moves the bar (left panels) and yaw-free closed loop experiments in which steering effort moves the fly (right panels). A. (left) Cartoon of body-fixed experimental paradigm. (middle) Constant velocity trajectory of a motion-defined bar. (right) Example space-time plot of bar and ground motion as seen from the fly’s visual midline. B. Similar to A for a fly in a yaw-free paradigm. C. Body-fixed artificial closed loop bar fixation for a bar starting on visual midline. (left) Example traces of bar position for 3 trials each (same color) from 3 flies (3 colors). (middle) Heatmap plots (N = 19, flies, n = 97 trials) of bar position. Colormap indicates the probability of the bar occupying each bin (1ms x 5°). (right, top) Normalized probability histograms are computed from the first (yellow bracket) and last (blue bracket) 0.5 s of each trial. Dotted line indicates visual midline. (right, bottom) The summed probability of flies placing the bar within 30° of the frontal (0°) or lateral (−60° or 60°) angular position bin at the start (yellow) and end (blue) of the trial. Each dot is an individual fly sum. * = p<0.05; ** = p < 0.01; *** = p < 0.001. D. (right) Yaw-free example traces of bar position relative to visual midline in 3 trials (same color) from 3 individual flies (3 colors), presented with a bar oscillating on midline. Saccades are indicated by black arrowheads. (middle) Heatmap plots (N = 24, n = 106 trials) for bar starting on midline (bins 10 ms x 5°). (left, top) Normalized probability histograms at the start and end of trials. E. Same as C for a bar starting 60° to the left of midline (N = 19, flies, n = 71 trials). The probability of flies placing the bar in the 0° bin increases from the start to the end of the trial (Kruskal-Wallis test). F. Same as D with a bar starting 60° to the left of the fly (N = 24, n = 99 trials) G. Same as C for a bar starting 60° to the right of midline (N = 19, flies, n = 104 trials). H. Same as D with a bar starting 60° to the right of the fly (N = 24, n = 80 trials). Note that the probability of flies placing the bar in the 0° bin at the end of the trial is not significantly higher than at the start. See also Figure S1.
Figure 3.
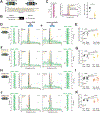
Figure 3.. Smooth bar tracking dynamics are body-state dependent.
A. Depictions of motion-defined bars oscillating about different azimuthal positions (blue = 60° left of midline; yellow = midline; red = 60° right of midline) and randomly textured large-field ground stimulus (purple). B. Open-loop responses of body-fixed flies (N = 16) to bars at three azimuthal positions as indicated. Data were high-pass filtered in order to remove slow DC steering offsets. Note that bar-elicited steering responses are ~60% the amplitude of ground-elicited responses. Shaded envelopes around solid traces represent standard deviation of mean population responses. Gray bands highlight alternate stimulus cycles. The zero ΔWBA position is indicated by a dotted gray line. C. Closed-loop responses of yaw-free flies (N = 20) to the same stimuli as B. Saccades are eliminated from these traces to isolate inter-saccadic bouts in which the bar is in a near-constant position relative to the fly’s body axis. D. Body-fixed (FFTs) of steering responses in B, color coded for bar position. E. Same as D but for yaw-free conditions. F. Ratio of bar responses to ground responses, compared between body state conditions, color coded for bar position. Each circle represents an individual fly. Unpaired two-sample t-tests were performed with * = p<0.05; ** = p < 0.01; *** = p < 0.001. See also Fig S2.
Figure 4.
Figure 4.. Manipulating visual feedback dynamics does not influence smooth object tracking dynamics.
A. Setup for a modified magnetic tether arena in which computer controlled visual stimuli are projected onto a cube surrounding the fly on all sides. Live video tracking allows for “visual clamp” conditions that maintain an image at a fixed position relative to the fly’s major body axis. Thus, proprioceptive feedback is intact, but visual feedback is perturbed. B. (left) In true closed loop yaw-free conditions, a leftward steering effort produced by the fly (red arrow) will generate rightward image motion relative to the body axis (black arrow). (middle) Like Figure 3, constant velocity ground oscillation (blue trace) elicits smooth optomotor movements of the body. Each trial starts with a stationary phase (gray shaded box). (right) Paired dot plot of FFT magnitude for 2-second periods before and after stimulus motion onset. Each dot represents an individual fly’s mean response. Paired Student’s t-tests were performed. C. (left) Responses to movement of a 30° bar, in true visual and proprioceptive closed loop conditions. Middle and right panels are the same as in B. D. (left) Under visual clamp conditions, leftward steering effort produced by the fly results in a matched leftward displacement of the bar such that the position of the bar remains constant. Middle and right panels are the same as in B. Insets in B,C,D (center) zoom in on the population mean. E. Comparison of responses before and after motion onset across all three experimental conditions. Each circle represents an individual fly. See also Figure S3.
Figure 5.
Figure 5.. Body-fixing increases amplitude and variance of wing and head movements.
A. An actuated gripper modifies the magnetic tether to rapidly switch between body states. Video registers the fly’s heading (magenta vector). Head and wing steering kinematics are extracted (blue, green frames). B. (top row) Example traces of one yaw-free trial across 3 individuals. The stimulus is a 10 s sinusoidal ground oscillation indicated in light gray. Black arrowheads indicate body saccades, observed in wing and head traces. (bottom row) Upon closing the gripper on the same animals, the body angle is fixed in place. C. Mean head dynamics amplitude (left) and variance (right) for 374 yaw-free trials and 175 body-fixed trials in N = 34 flies. Each dot represents a single trial. Unpaired student’s t-tests were performed with * = p<0.05; ** = p < 0.01; *** = p < 0.001. D. Mean amplitude of Left minus Right wing beat amplitude (left) and variance (right) for 383 yaw-free trials and 171 body-fixed trials in N =35 flies. Response amplitude represents the averaged absolute value throughout the trial. Variance was similarly computed across the length of each trial. Each dot represents one trial. See also Figure S4.
Figure 6.
Figure 6.. Body-fixing increases the wing steering bar response gain.
A. (top) Motion-defined bar or dark bar stimuli are oscillated within an oscillating ground. (bottom) Partial stimulus traces for ground oscillating at 2.3 Hz (black) and bar oscillating at 2.7 Hz (yellow), with 15°amplitude. Note that stimuli move in and out of phase. B. Systems identification framework where the two sinusoidal stimuli are inputs to the central nervous system (CNS) and the fly’s steering response is the sole output. C. (left) Body movement response for N = 18 flies to compound bar/ground stimuli. Magenta line represents mean body angular position, shaded envelope represents standard deviation. (middle) FFT plots of the body response (left y-axis, black) overlaid with FFT amplitude of ground and bar stimulus inputs (right y-axis, gray). (right) Gain of body responses to the ground (black) and bar (yellow). Gain in decibels is negative as the amplitude of the response output is smaller than the input. Each point represents an individual fly’s mean response. Nonparametric Wilcoxon Rank-sum tests were performed. D. Population (N=11) wing steering responses in the yaw-free, open gripper condition (left) and body-fixed, gripper closed condition (right). Time domain mean response +/− SD flank FFT plots throughout (green). E. Mean response gain, as in C, for ground (black) and bar (yellow) were compared across body states and stimulus types. F. Same as D but with motion-defined bar and ground oscillation frequencies swapped. G. Same as E but with motion-defined bar and ground oscillation frequencies swapped. H-K. Same as D-G but using a 30° solid dark bar stimulus. See also Figure S4.

Similar articles

Cited by

References

    1. Reichardt W, and Wenking H (1969). Optical detection and fixation of objects by fixed flying flies. Naturwissenschaften, 424. - PubMed
    1. Poggio T, and Reichardt W (1973). A theory of the pattern induced flight orientation of the fly Musca domestica. Kybernetik, 185–203. - PubMed
    1. Reichardt W, Poggio T, and Hausen K (1983). Figure -ground discrimination by relative movement in the visual system of the fly. Biol. Cybern 46, 1–30.
    1. Reiser MB, and Dickinson MH (2010). Drosophila fly straight by fixating objects in the face of expanding optic flow. J. Exp. Biol 213, 1771–1781. - PMC - PubMed
    1. Fox JL, Aptekar JW, Zolotova NM, Shoemaker PA, and Frye MA (2014). Figure - ground discrimination behavior in Drosophila. I. Spatial organization of wing-steering responses. J. Exp. Biol 217, 558–569. - PMC - PubMed

Publication types