. 2023 Apr 10;41(4):776-790.e7.
doi: 10.1016/j.ccell.2023.03.009. Epub 2023 Mar 30.

Lineage tracing reveals clonal progenitors and long-term persistence of tumor-specific T cells during immune checkpoint blockade

Affiliations

Lineage tracing reveals clonal progenitors and long-term persistence of tumor-specific T cells during immune checkpoint blockade

Joy A Pai et al. Cancer Cell. .

Abstract

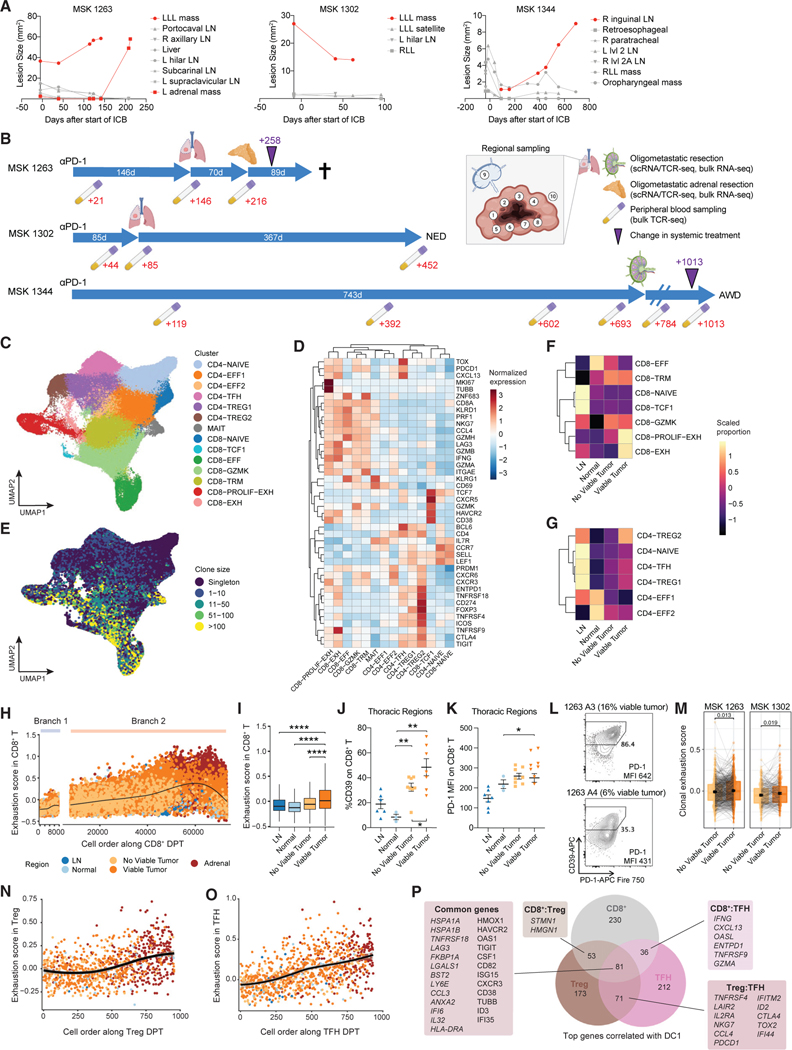
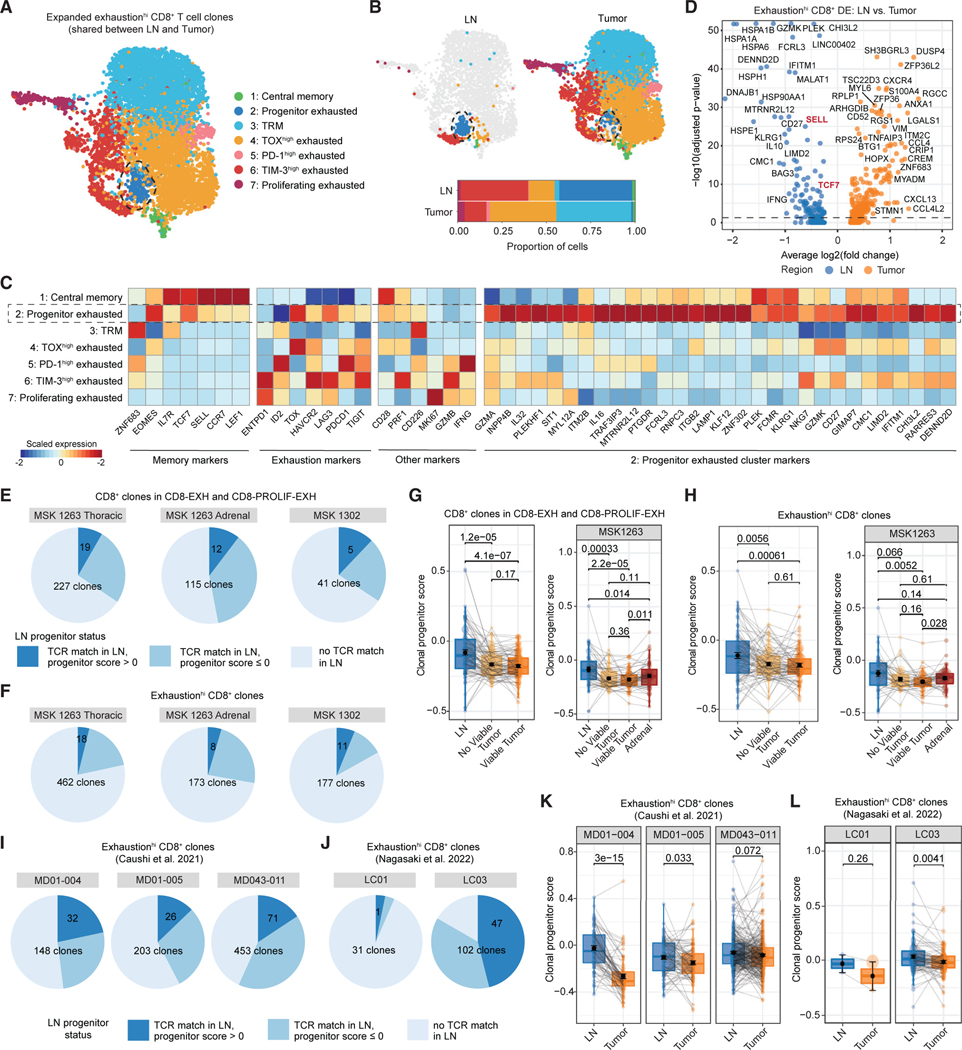
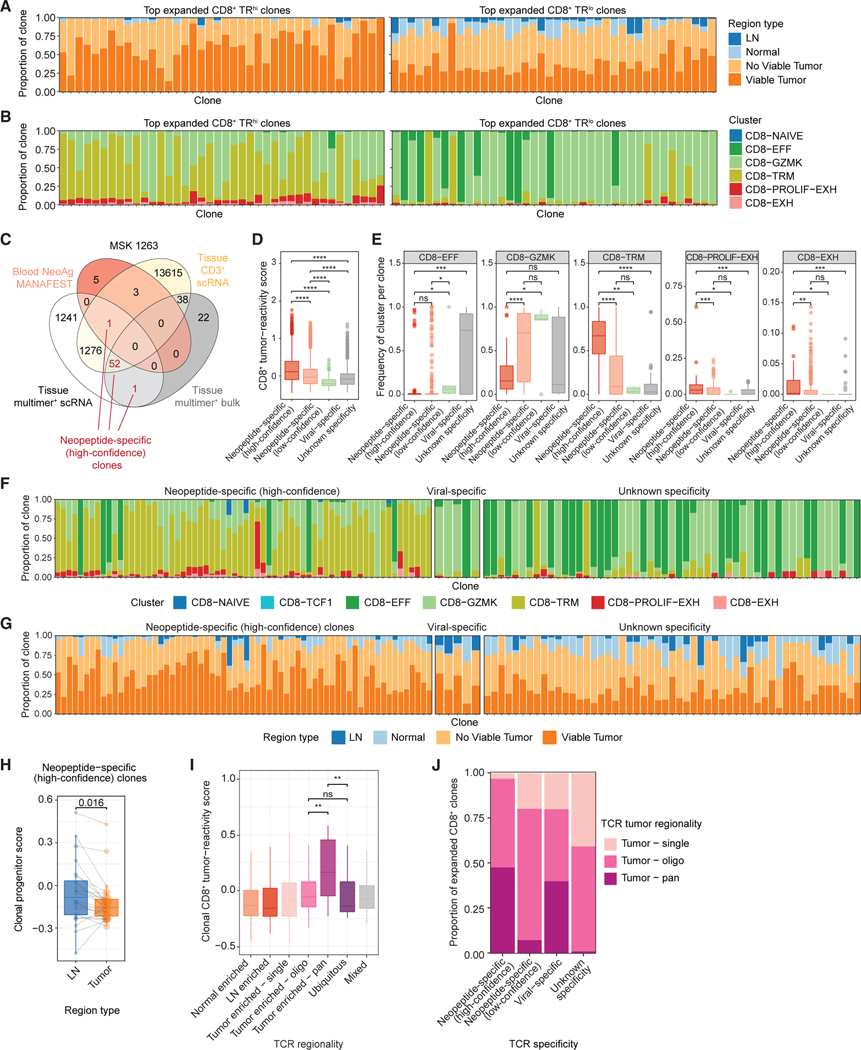
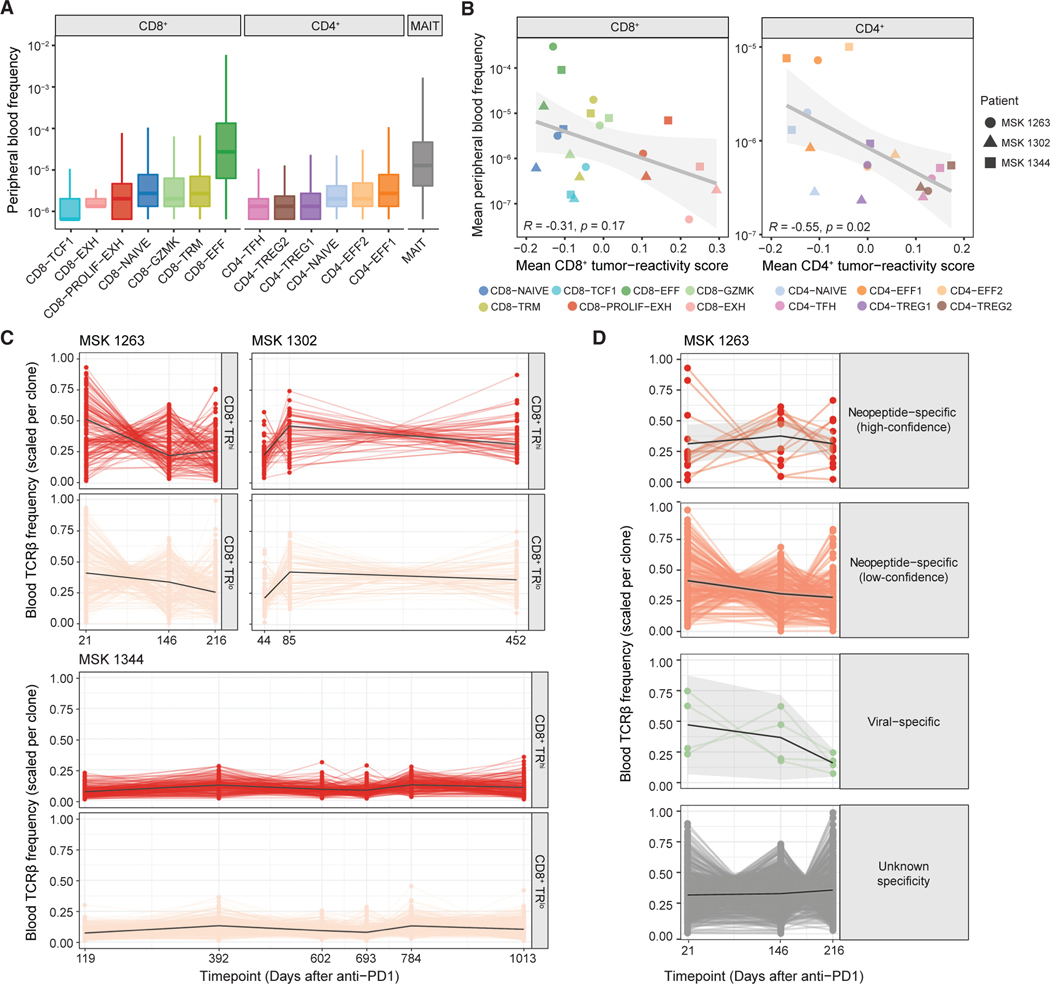
Paired single-cell RNA and T cell receptor sequencing (scRNA/TCR-seq) has allowed for enhanced resolution of clonal T cell dynamics in cancer. Here, we report a scRNA/TCR-seq analysis of 187,650 T cells from 31 tissue regions, including tumor, adjacent normal tissues, and lymph nodes (LN), from three patients with non-small cell lung cancer after immune checkpoint blockade (ICB). Regions with viable cancer cells are enriched for exhausted CD8+ T cells, regulatory CD4+ T cells (Treg), and follicular helper CD4+ T cells (TFH). Tracking T cell clonotypes across tissues, combined with neoantigen specificity assays, reveals that TFH and tumor-specific exhausted CD8+ T cells are clonally linked to TCF7+SELL+ progenitors in tumor draining LNs, and progressive exhaustion trajectories of CD8+ T, Treg, and TFH cells with proximity to the tumor microenvironment. Finally, longitudinal tracking of tumor-specific CD8+ and CD4+ T cell clones reveals persistence in the peripheral blood for years after ICB therapy.

Keywords: TCF-1 progenitor exhausted T cells; exhausted T cells; immune checkpoint blockade; lung cancer; single-cell RNA/TCR sequencing; tumor-specific T cells.


Conflict of interest statement

Declaration of interests M.D.H. reports advisory/consulting fees from Achilles, Adagene, Adicet, AstraZeneca, Blueprint Medicines, Bristol Myers Squibb, Da Volaterra, Eli Lilly, Genentech, Genzyme/Sanofi, Immunai, Instill Bio, Janssen, Mana Therapeutics, Merk, Mirati, Pact Pharma, Regeneron, Roche, and Shattuck Labs; research funding from Bristol Myers Squibb; stock interest with Arcus, Factorial, Immunai, and Shattuck Labs; a patent filed by Memorial Sloan Kettering related to the use of tumor mutation burden to predict response to immunotherapy (PCT/US2015/062208), which has received licensing fees from Personal Genome Diagnostics (PGDx); after the completion of this work, M.D.H .began as an employee (and equity holder) at AstraZeneca. J.D.W. has Equity in Apricity, Arsenal IO, Ascentage, Beigene, Imvaq, Linneaus, Georgiamune, Maverick, Tizona Pharmaceuticals, and Trieza. J.D.W. is a co-inventor on the following patent application: Xenogeneic (Canine) DNA vaccines, myeloid-derived suppressor cell (MDSC) assay, anti-PD1 antibody, anti-CTLA4 antibodies, anti-GITR antibodies and methods of use thereof, Newcastle disease viruses for cancer therapy, and prediction of responsiveness to treatment with immunomodulatory therapeutics and method of monitoring abscopal effects during such treatment. J.D.W. and T.M. are co-inventors on patent applications related to CD40 and in situ vaccination (PCT/US2016/045970). T.M. is a consultant for Immunos Therapeutics and Pfizer. T.M. is a cofounder of and equity holder in IMVAQ Therapeutics. T.M. receives research funding from Bristol-Myers Squibb, Surface Oncology, Kyn Therapeutics, Infinity Pharmaceuticals, Peregrine Pharmaceuticals, Adaptive Biotechnologies, Leap Therapeutics, and Aprea Therapeutics. T.M. is an inventor on patent applications related to work on oncolytic viral therapy, alpha virus–based vaccine, neoantigen modeling, CD40, GITR, OX40, PD-1, and CTLA-4. C.M.R. has consulted regarding oncology drug development with AbbVie, Amgen, Ascentage, AstraZeneca, BMS, Celgene, Daiichi Sankyo, Genentech/Roche, Ipsen, Loxo, and PharmaMar and is on the scientific advisory boards of Elucida, Bridge, and Harpoon. A.T.S. is a founder of Immunai and Cartography Biosciences and receives research funding from Allogene Therapeutics and Merck Research Laboratories. The remaining authors declare no competing interests.

Figures

Figure 1.
Figure 1.. Exhausted CD8+, Treg, and TFH cells are enriched in proximity to viable cancer cells
(A) Quantification of surface area of individuals lesions on radiographical studies over time in three patients. Red lines indicate lesions that were resected and analyzed in this study. (B) Schematic of time interval from start of anti-PD-1 therapy to the time of resections and clinical outcome across the three patients. Timeline of associated peripheral blood collections are indicated in red text below. Purple triangle indicates a change in systemic therapy from anti-PD-1 monotherapy. Cross indicates patient death. AWD, alive with disease; NED, no evidence of disease. (C) Uniform manifold approximation and projection (UMAP) of cell clusters obtained from scRNA/TCR-seq of sorted CD3+ T cells, which are further defined in (D). (D) Heat map of differentially expressed genes found in each T cell cluster. (E) UMAP overlaid with TCRαβ clone size as assessed from scTCR-seq data. (F and G) Proportion of cells from each region type in each CD8+ (F) and CD4+ (G) T cell cluster. Heatmap colors show proportions scaled per cluster. (H) Scatter plot of exhaustion scores among CD8+ T cells ordered along diffusion pseudotime (DPT), colored by anatomical region. (I) Box and whisker plot of exhaustion score per cell in the indicated region types. Statistical testing by two-sided t test (****p < 0.0001). (J and K) Flow cytometric quantification of %CD39 (J) or PD-1 MFI (K) on CD8+ T cells across the indicated region types. Statistical testing by two-sided t test (**p < 0.01). Error bars represent standard error of the mean. For (I–K), only thoracic resection regions from MSK 1263 and 1302 were included in this analysis due to concomitant availability of adjacent normal, no viable tumor, viable tumor, and LN regions. (L) CD39 and PD-1 flow cytometry plots from two adrenal regions involved with tumor in MSK 1263 gated on CD8+ T cells. (M) Paired box and whisker plots of average exhaustion score per clonotype that is matched between regions without viable tumor and regions with viable tumor. Statistical testing by paired two-sided t test. Error bars represent standard error of the mean. (N–O) Scatter plot of exhaustion scores among Treg (N) or TFH (O) cells ordered along DPT. Points are colored by region type as in (H). (P) Comparison and overlap of top genes correlated with DC1 (top 20th percentile) for CD8+, Treg, and TFH. Numbers indicate the number of genes in each set. Select genes in each category are shown. All box and whisker plots are defined as follows: center line, median; box, interquartile range; upper whisker limit, maximum without outliers; lower whisker limit; minimum without outliers; points, outliers. See also Figures S1–S6, Data S1, and Table S1.
Figure 2.
Figure 2.. Intratumoral CD8+ T cells can be found in a TCF-1+ CD62L+ progenitor exhausted state in the regional LN
(A) Uniform manifold approximation and projection (UMAP) of re-clustered cells from CD8+ T cell clones with high exhaustion scores (exhaustionhi) that were expanded (more than 2 cells) and found in both LN and tumor regions. Cells are colored according to phenotype cluster. (B) UMAP of re-clustered cells from (A) split by region type: LN (left), tumor (right). Bar plots of phenotypic cluster distribution among cells from LN or tumor regions (bottom). (C) Heat map showing expression of select memory, exhaustion, and progenitor exhausted cluster markers among the clusters from (A). (D) Volcano plot of differentially expressed genes between clone-matched cells in the LN and tumor from exhaustionhi CD8+ T cell clones. (E and F) Pie chart of CD8+ T cell clones in the CD8-EXH and CD8-PROLIF-EXH clusters (E) or exhaustionhi clones (F) in the tumor that could be matched to a clonotype in the LN (medium blue and dark blue, “TCR match in LN”). Dark blue slice indicates that the matched clone could be found with a progenitor score of greater than 0 in the LN. (G) Paired box and whisker plots of average progenitor score per CD8+ T cell clone in the CD8-EXH and CD8-PROLIF-EXH clusters in thoracic regions of MSK 1263 and 1302 (left) or adrenal regions of MSK 1263 (right) that is matched among the LN, regions without viable tumor, and regions with viable tumor. Statistical testing by paired two-sided t test. Error bars represent standard error of the mean. (H) Paired box and whisker plots of average progenitor score per exhaustionhi CD8+ T cell clone in thoracic regions of MSK 1263 and 1302 (left) or adrenal regions of MSK 1263 (right) that is matched among the LN, regions without viable tumor, and regions with viable tumor. Statistical testing by paired two-sided t test. Error bars represent standard error of the mean. (I and J) Pie chart of exhaustionhi CD8+ T cell clones in two external datasets that could be matched to a clonotype in the LN (medium blue and dark blue, “TCR match in LN”). Dark blue slice indicates that the matched clone could be found with a progenitor score of greater than 0 in the LN. (K and L) Paired box and whisker plot of average progenitor score per clone that is matched among the LN and tumor regions in five separate patients from two external datasets. Statistical testing by paired two-sided t test. Error bars represent standard error of the mean. All box and whisker plots are defined as follows: center line, median; box, interquartile range; upper whisker limit, maximum without outliers; lower whisker limit; minimum without outliers; points, outliers. See also Figure S7 and Table S2.
Figure 3.
Figure 3.. Phenotypic and regional enrichment of tumor-specific CD8+ T cell clones
(A) Bar plots of the proportion of cells in the indicated region type among the top 40 most expanded TRhi (left) or TRlo (right) CD8+ clones. (B) Bar plots of the proportion of cells in the indicated phenotype clusters among the top 40 most expanded TRhi (left) or TRlo (right) CD8+ clones. (C) Venn diagram of overlap between TCRβ sequences from MSK 1263 identified by empirical tumor-specific methods and the tissue sorted CD3+ scRNA/TCR-seq dataset (yellow). Numbers indicate the number of TCRβ sequences in each intersection. Numbers colored in red represent TCRβ clones identified by at least two empirical methods (designated as high-confidence neopeptide-specific clones). (D) Box and whisker plot of tumor-reactivity scores among CD8+ T cells with the indicated TCR specificity. (E) Box and whisker plots of the proportion of cells in clones within each specificity belonging to the indicated CD8+ T cell clusters. Each point represents one TCR clone. Statistical testing by two-sided Wilcoxon-test (*p < 0.05, **p < 0.01, ***p < 0.001, ****p < 0.0001). (F and G) Bar plots of the proportion of cells in the indicated phenotype cluster (F) or region type (G) among the top most expanded high-confidence neopeptide-specific clones (left), viral-specific clones (middle), or clones with unknown specificity (right). (H) Paired box and whisker plot of average progenitor scores per high-confidence neopeptide-specific clone in MSK 1263 that is matched among the LN and tumor regions. Statistical testing by paired two-sided t test. (I) Box and whisker plots of gene signature scores for CD8+ tumor-reactivity among clones with the indicated TCR regional pattern. (J) Bar plots of the proportion of clones with each TCR specificity colored by TCR tumor regional pattern. All box and whisker plots are defined as follows: center line, median; box, interquartile range; upper whisker limit, maximum without outliers; lower whisker limit; minimum without outliers; points, outliers. See also Figures S8–S11 and Table S3.
Figure 4.
Figure 4.. Peripheral persistence of tumor-specific CD8+ T cell clones
(A) Circulating frequency of clonotypes with the indicated CD4+, CD8+, or mucosal-associated invariant T (MAIT) phenotypes designated by tissue scRNA/TCR-seq in MSK 1263, 1302, and 1344. Each clonotype was counted once based on majority phenotype. Box and whisker plots are defined as follows: center line, median; box, interquartile range; upper whisker limit, maximum without outliers; lower whisker limit; minimum without outliers. (B) Spearman correlation of mean tumor-reactivity score and peripheral blood frequency per CD8+ (left) or CD4+ (right) T cell cluster. (C) Circulating frequency over time of TRhi (top) and TRlo (bottom) CD8+ clones from patients MSK 1263, MSK 1302, and MSK 1344. (D) Circulating frequency over time of CD8+ T cell clones with the indicated empirical antigen specificity from patient MSK 1263. See also Figures S9–S11.

Comment in

References

    1. Yost KE, Chang HY, and Satpathy AT (2021). Recruiting T cells in cancer immunotherapy. Science 372, 130–131. 10.1126/science.abd1329. - DOI - PubMed
    1. Spitzer MH, Carmi Y, Reticker-Flynn NE, Kwek SS, Madhireddy D, Martins MM, Gherardini PF, Prestwood TR, Chabon J, Bendall SC, et al. (2017). Systemic immunity is required for effective cancer immunotherapy. Cell 168, 487–502.e15. 10.1016/j.cell.2016.12.022. - DOI - PMC - PubMed
    1. Pai JA, and Satpathy AT (2021). High-throughput and single-cell T cell receptor sequencing technologies. Nat. Methods 18, 881–892. 10.1038/s41592-021-01201-8. - DOI - PMC - PubMed
    1. Yost KE, Satpathy AT, Wells DK, Qi Y, Wang C, Kageyama R, McNamara KL, Granja JM, Sarin KY, Brown RA, et al. (2019). Clonal replacement of tumor-specific T cells following PD-1 blockade. Nat. Med. 25, 1251–1259. 10.1038/s41591-019-0522-3. - DOI - PMC - PubMed
    1. Zheng L, Qin S, Si W, Wang A, Xing B, Gao R, Ren X, Wang L, Wu X, Zhang J, et al. (2021). Pan-cancer single-cell landscape of tumor-infiltrating T cells. Science 374, abe6474. 10.1126/science.abe6474. - DOI - PubMed

Publication types

MeSH terms

Substances