. 2023 Jul;152(1):56-67.
doi: 10.1016/j.jaci.2023.03.021. Epub 2023 Mar 29.

Type 2 inflammation reduces SARS-CoV-2 replication in the airway epithelium in allergic asthma through functional alteration of ciliated epithelial cells

Affiliations

Type 2 inflammation reduces SARS-CoV-2 replication in the airway epithelium in allergic asthma through functional alteration of ciliated epithelial cells

Naresh Doni Jayavelu et al. J Allergy Clin Immunol. 2023 Jul.

Abstract

Background: Despite well-known susceptibilities to other respiratory viral infections, individuals with allergic asthma have shown reduced susceptibility to severe coronavirus disease 2019 (COVID-19).

Objective: We sought to identify mechanisms whereby type 2 inflammation in the airway protects against severe acute respiratory syndrome coronavirus 2 (SARS-CoV-2) by using bronchial airway epithelial cells (AECs) from aeroallergen-sensitized children with asthma and healthy nonsensitized children.

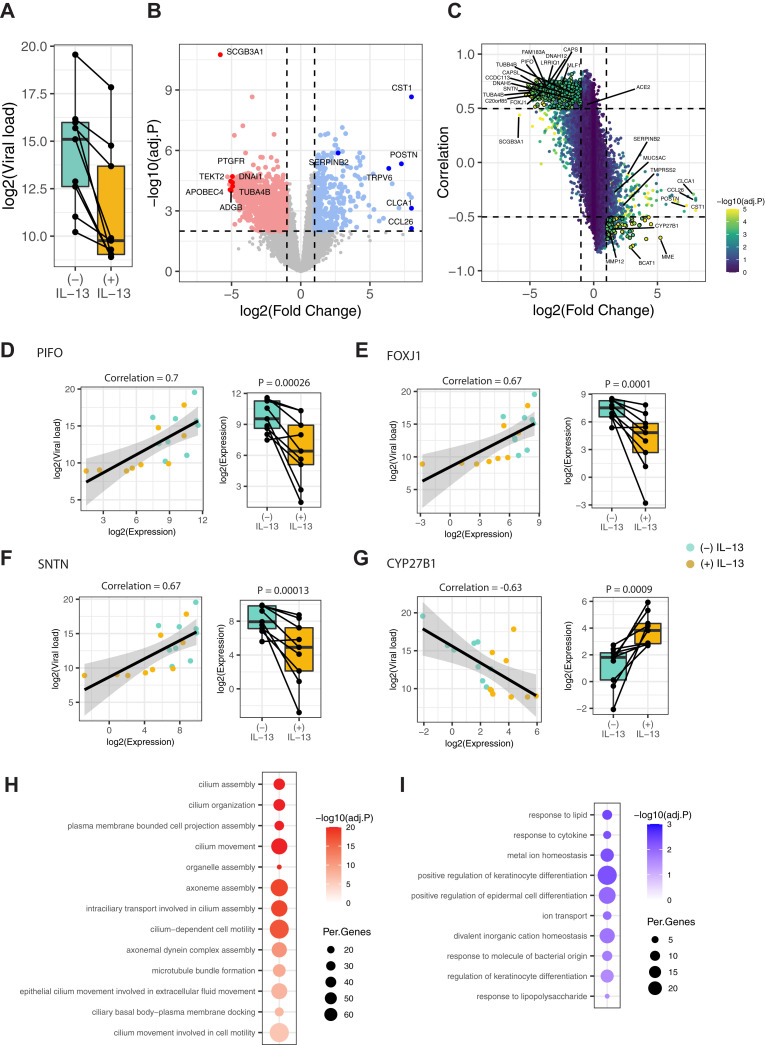
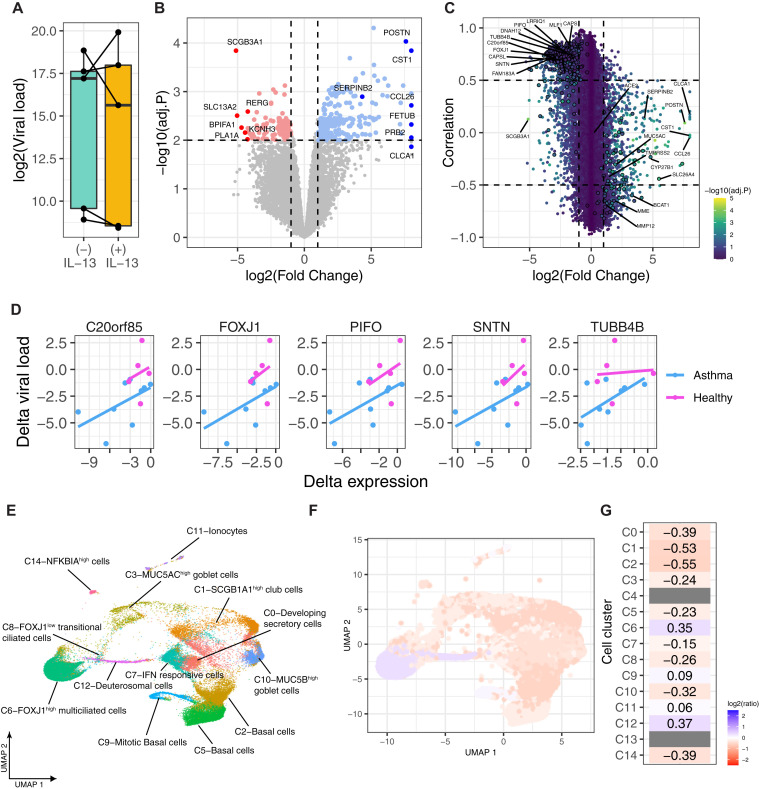
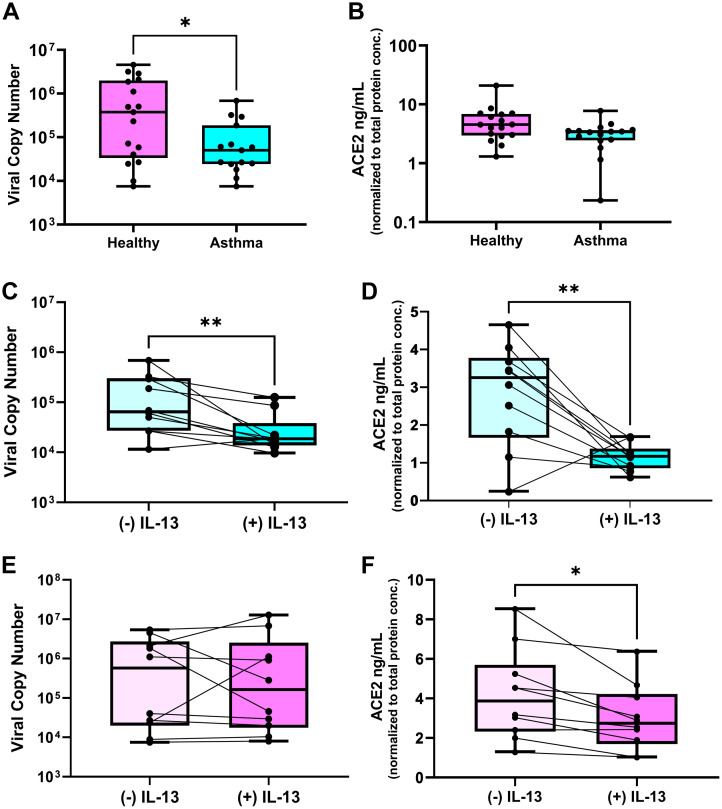
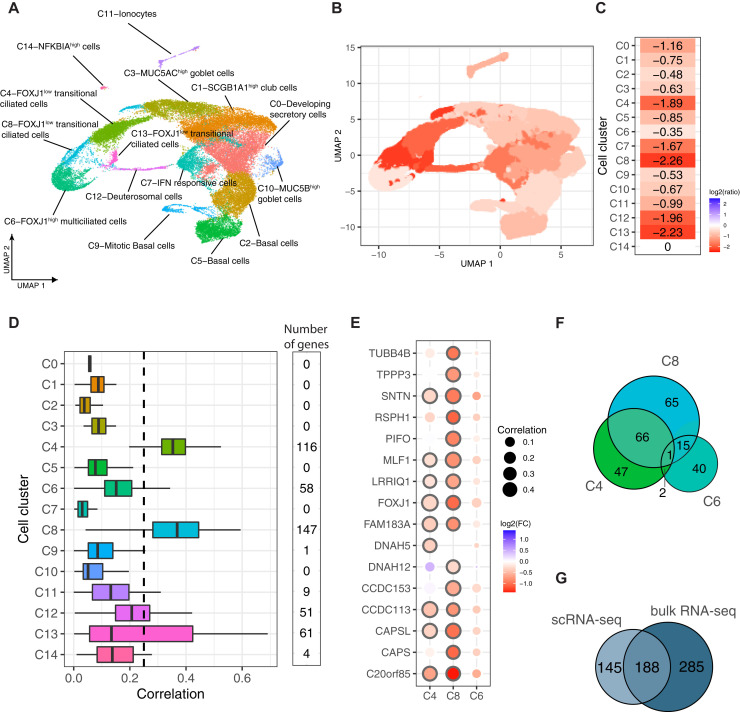
Methods: We measured SARS-CoV-2 replication and ACE2 protein and performed bulk and single-cell RNA sequencing of ex vivo infected AEC samples with SARS-CoV-2 infection and with or without IL-13 treatment.

Results: We observed that viral replication was lower in AECs from children with allergic asthma than those from in healthy nonsensitized children and that IL-13 treatment reduced viral replication only in children with allergic asthma and not in healthy children. Lower viral transcript levels were associated with a downregulation of functional pathways of the ciliated epithelium related to differentiation as well as cilia and axoneme production and function, rather than lower ACE2 expression or increases in goblet cells or mucus secretion pathways. Moreover, single-cell RNA sequencing identified specific subsets of relatively undifferentiated ciliated epithelium (which are common in allergic asthma and highly responsive to IL-13) that directly accounted for impaired viral replication.

Conclusion: Our results identify a novel mechanism of innate protection against SARS-CoV-2 in allergic asthma that provides important molecular and clinical insights during the ongoing COVID-19 pandemic.

Keywords: COVID-19; IL-13; SARS-CoV-2; airway epithelial cells; asthma; children; epithelium.


Figures

Fig 2
Fig 2
Bulk transcriptomics demonstrates that IL-13 stimulation reduces SARS-CoV-2 replication in AECs from children with allergic asthma in parallel with downregulation of ciliated epithelial cell pathways. A, Boxplot showing the viral load assessed by bulk mRNA sequencing in AECs from children with allergic asthma stimulated without or with IL-13 and infected with SARS-CoV-2. Lines connecting the dots denote samples from the same donor. B, Volcano plot showing the differentially upregulated and downregulated genes by IL-13 stimulation. Significantly (FDR < 0.01) upregulated (log2FC > 1) and downregulated genes (log2FC > –1) are denoted by blue and red color points, respectively. Select top-ranked genes by log2FC are highlighted. C, Scatter plot showing the association between viral load and IL-13–induced differential gene expression. The x-axis represents the change in expression due to IL-13 stimulation, and the y-axis represents the correlation to viral load. The color of the point shows the statistical significance of differential expression [–log10(adjusted P [adj.P])]. Genes significantly differentially expressed (FDR < 0.001) and highly correlated with viral load (Pearson correlation coefficient > 0.5 or < –0.5) are highlighted by larger point size and bolded border. Select ciliary and type 2 specific genes are highlighted. D-G, Examples of genes showing significant association of viral load and expression (scatter plots) and significant differential expression with IL-13 stimulation (box plots). H, Enriched GO terms for the 473 genes showing positive association between viral load and expression and downregulated by IL-13 stimulation. The size of each dot denotes the percentage of genes, and the intensity of color denotes statistical significance as –log10(adj.P). I, Enriched GO terms for the 74 genes showing negative association between viral load and expression and upregulated by IL-13 stimulation. The size of each dot denotes the percentage of genes, and the intensity of color denotes statistical significance as –log10(adj.P).
Fig 4
Fig 4
IL-13 stimulation has a variable effect on SARS-CoV-2 replication in healthy nonsensitized children. A, Boxplot showing the differences in viral load between healthy nonsensitized children infected with SARS-CoV-2 and those stimulated without or with IL-13. Lines connecting the dots denote samples from the same donor. B, Volcano plot showing the differentially upregulated and downregulated genes by IL-13 stimulation. Significantly (FDR < 0.01) upregulated (log2FC > 1) and downregulated genes (log2FC < –1) are denoted by blue and red color points, respectively. Select top-ranked genes by log2FC are highlighted. C, Scatter plot showing the association between viral load and expression of genes. Each point denotes a gene, and the color of the point shows the statistical significance from differential expression analysis in terms of –log10(adjusted P [adj.P]), and top-ranked genes are highlighted by larger point size and a circle around the points. Select ciliary and type 2–specific genes are highlighted in the same way as in Fig 2, C. D, Examples of select ciliated marker genes association between Δ viral load (difference in viral load between IL-13–stimulated and unstimulated) and Δ expression (difference in expression between IL-13–stimulated and unstimulated) in children with allergic asthma and healthy nonsensitized donors. E, Annotation of cells from scRNA-seq data generated from healthy nonsensitized children by using cells from children with allergic asthma as a reference to map cells onto the allergic asthma UMAP space. F and G, Cell type–specific differences in viral load as the ratio of viral load in the IL-13–stimulated to that in the unstimulated condition on a log2 scale are shown on the allergic asthma UMAP space (F) and cluster-level summary on the heatmap (G).
Fig 1
Fig 1
SARS-CoV-2 replication in AECs from healthy nonsensitized children and children with allergic asthma and effect of IL-13 stimulation on ACE2 and SARS-CoV-2 replication. A, Boxplot showing SARS-CoV-2 copy number measured by qPCR 96 hours after infection in bronchial AEC cultures from healthy nonsensitized children (pink) and children with allergic asthma (light blue) (∗P = .04). B, Boxplot showing SARS-CoV-2 viral entry factor and ACE2 protein abundance in parallel uninfected AEC cultures from healthy nonsensitized children (pink) and children with allergic asthma (light blue) (P = .06). C, Boxplot showing viral copy number in cultures from children with allergic asthma infected with SARS-CoV-2 without and with IL-13 (10 ng/mL) treatment (∗∗P < .01). D, Boxplot showing ACE2 protein abundance in cultures from children with allergic asthma infected with SARS-CoV-2 without and with IL-13 (10 ng/mL) treatment (∗∗P < .01). E, Boxplot showing viral copy number in cultures from healthy nonsensitized infected with SARS-CoV-2 without and with IL-13 (10 ng/mL) treatment. F, Boxplot showing ACE2 protein abundance in cultures from healthy nonsensitized infected with SARS-CoV-2 without and with IL-13 (10 ng/mL) treatment (∗P < .05).
Fig 3
Fig 3
IL-13 stimulation decreases viral replication through specific effects on clusters of relatively undifferentiated ciliated epithelial cells common in AECs from children with allergic asthma. A, UMAP clustering and visualization of scRNA-seq data from AECs from 2 children with allergic asthma stimulated with or without IL-13 and infected with SARS-CoV-2. Cell clusters are labeled based on highly expressed marker genes of airway epithelial cell types. B and C, Cell type–specific differences in viral load are presented as the ratio of viral load in the IL-13–stimulated condition to that in the unstimulated condition on a log2 scale shown in each cell cluster on the UMAP (B) and summary of the magnitude of change in viral load due to IL-13 stimulation in each cluster (C). D, Boxplot showing the distribution of single-cell–level correlations between viral load and expression of cell cluster genes; the numbers of significant genes with a Pearson correlation greater than 0.25 are noted. E, Dot plot showing the degree of differential expression in the IL-13–stimulated condition versus in the unstimulated condition and the correlation to viral load for ciliated cell marker genes in 3 ciliated cell clusters (C4, C8, and C13 represent relatively undifferentiated ciliated cell clusters, whereas C6 represents the terminally differentiated multiciliated cell cluster). F, Venn diagram showing the overlap of genes correlated with viral load within 3 ciliated cell clusters. G, Venn diagram showing the overlap of genes positively associated with viral load from bulk RNA-seq data and cell cluster–specific genes positively associated with viral load from scRNA-seq data.

References

    1. Johns Hopkins Coronavirus Resource Center homepage Johns Hopkins University. https://coronavirus.jhu.edu/ Available at:
    1. O’Driscoll M., Ribeiro Dos Santos G., Wang L., Cummings D.A.T., Azman A.S., Paireau J., et al. Age-specific mortality and immunity patterns of SARS-CoV-2. Nature. 2021;590:140–145. - PubMed
    1. Lai C.C., Liu Y.H., Wang C.Y., Wang Y.H., Hsueh S.C., Yen M.Y., et al. Asymptomatic carrier state, acute respiratory disease, and pneumonia due to severe acute respiratory syndrome coronavirus 2 (SARS-CoV-2): facts and myths. J Microbiol Immunol Infect. 2020;52:404–412. - PMC - PubMed
    1. Schultze J.L., Aschenbrenner A.C. COVID-19 and the human innate immune system. Cell. 2021;184:1671–1692. - PMC - PubMed
    1. Degarege A., Naveed Z., Kabayundo J., Brett-Major D. Heterogeneity and risk of bias in studies examining risk factors for severe illness and death in COVID-19: a systematic review and meta-analysis. Pathogens. 2022;11:563. - PMC - PubMed

Publication types