

Evaluating equity in performance of an electronic health record-based 6-month mortality risk model to trigger palliative care consultation: a retrospective model validation analysis
- PMID: 37001995
- PMCID: PMC10898860
- DOI: 10.1136/bmjqs-2022-015173
Evaluating equity in performance of an electronic health record-based 6-month mortality risk model to trigger palliative care consultation: a retrospective model validation analysis
Abstract
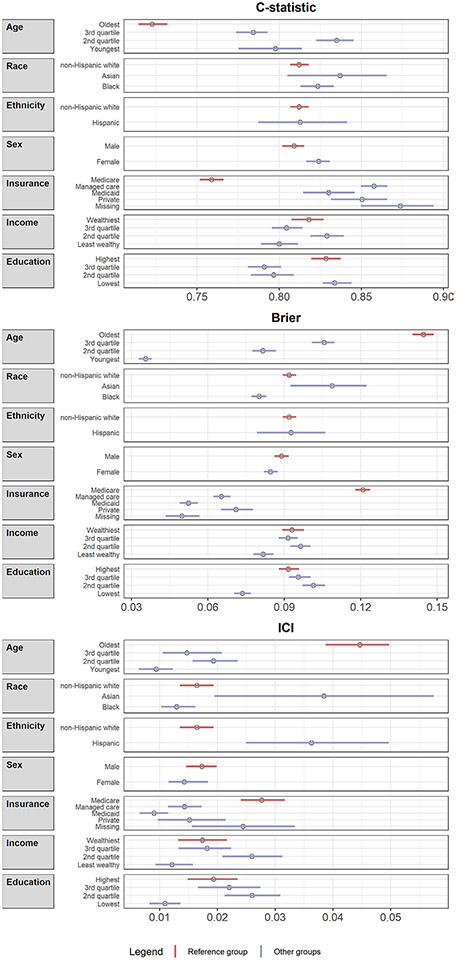
Objective: Evaluate predictive performance of an electronic health record (EHR)-based, inpatient 6-month mortality risk model developed to trigger palliative care consultation among patient groups stratified by age, race, ethnicity, insurance and socioeconomic status (SES), which may vary due to social forces (eg, racism) that shape health, healthcare and health data.
Design: Retrospective evaluation of prediction model.
Setting: Three urban hospitals within a single health system.
Participants: All patients ≥18 years admitted between 1 January and 31 December 2017, excluding observation, obstetric, rehabilitation and hospice (n=58 464 encounters, 41 327 patients).
Main outcome measures: General performance metrics (c-statistic, integrated calibration index (ICI), Brier Score) and additional measures relevant to health equity (accuracy, false positive rate (FPR), false negative rate (FNR)).
Results: For black versus non-Hispanic white patients, the model's accuracy was higher (0.051, 95% CI 0.044 to 0.059), FPR lower (-0.060, 95% CI -0.067 to -0.052) and FNR higher (0.049, 95% CI 0.023 to 0.078). A similar pattern was observed among patients who were Hispanic, younger, with Medicaid/missing insurance, or living in low SES zip codes. No consistent differences emerged in c-statistic, ICI or Brier Score. Younger age had the second-largest effect size in the mortality prediction model, and there were large standardised group differences in age (eg, 0.32 for non-Hispanic white versus black patients), suggesting age may contribute to systematic differences in the predicted probabilities between groups.
Conclusions: An EHR-based mortality risk model was less likely to identify some marginalised patients as potentially benefiting from palliative care, with younger age pinpointed as a possible mechanism. Evaluating predictive performance is a critical preliminary step in addressing algorithmic inequities in healthcare, which must also include evaluating clinical impact, and governance and regulatory structures for oversight, monitoring and accountability.
Keywords: decision support, computerized; evaluation methodology; information technology.
© Author(s) (or their employer(s)) 2023. No commercial re-use. See rights and permissions. Published by BMJ.
Conflict of interest statement
Competing interests: None declared.
Figures


Comment in
-
Clinical decision-making and algorithmic inequality.BMJ Qual Saf. 2023 Sep;32(9):495-497. doi: 10.1136/bmjqs-2022-015874. Epub 2023 Jun 8. BMJ Qual Saf. 2023. PMID: 37290916 No abstract available.
References
-
- Matheny ME, Whicher D, Thadaney Israni S. Artificial intelligence in health care: a report from the National Academy of medicine. JAMA 2020;323:509–10. - PubMed
-
- Grand View Research. Artificial intelligence in healthcare market size, share & trends analysis report by component (hardware, software, services), by application, by region, competitive insights, and segment forecasts, 2019-2025. grandviewresearch.com, 2019: 120. Available: http://repositorio.unan.edu.ni/2986/1/5624.pdf
Publication types
MeSH terms
Grants and funding
LinkOut - more resources
Full Text Sources
Medical