. 2023 Mar 31;14(1):1806.
doi: 10.1038/s41467-023-37386-z.

Age-dependent Pdgfrβ signaling drives adipocyte progenitor dysfunction to alter the beige adipogenic niche in male mice

Affiliations

Age-dependent Pdgfrβ signaling drives adipocyte progenitor dysfunction to alter the beige adipogenic niche in male mice

Abigail M Benvie et al. Nat Commun. .

Abstract

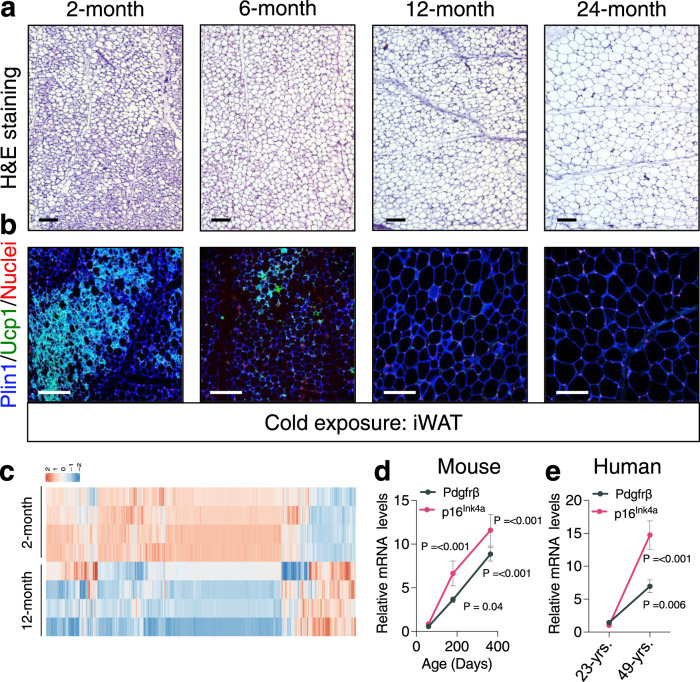
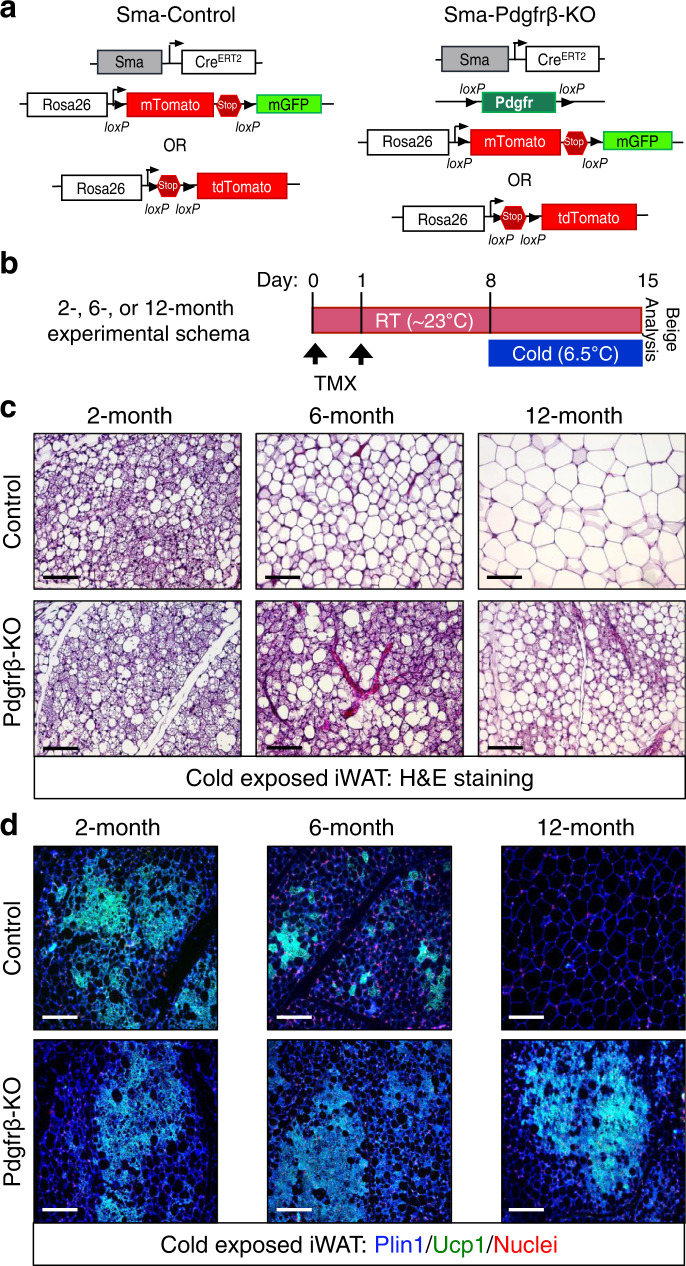
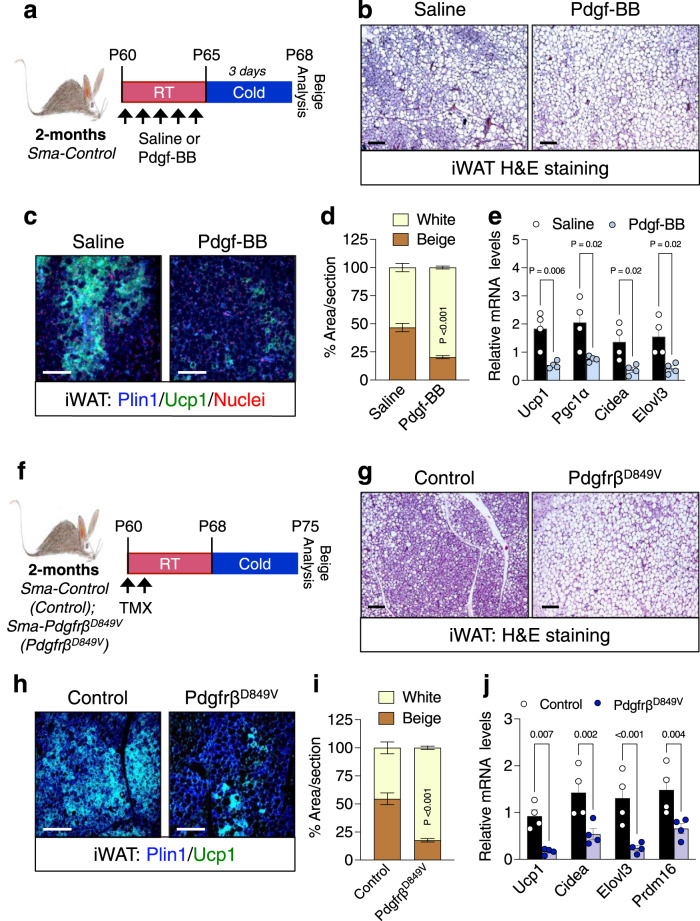
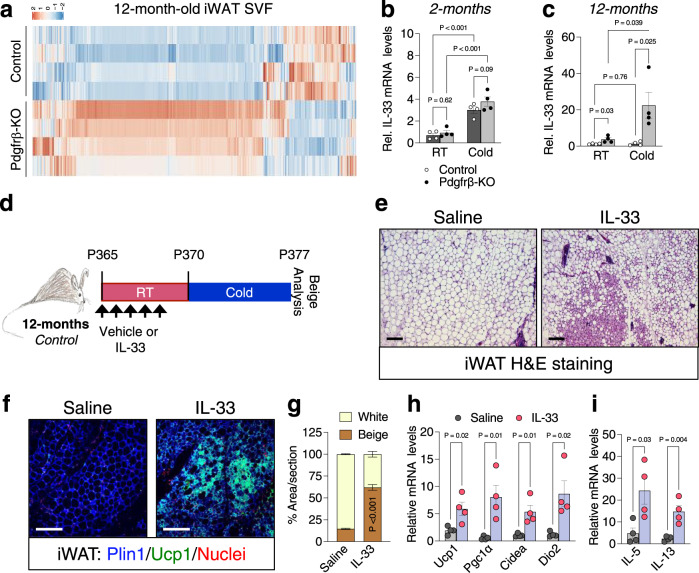
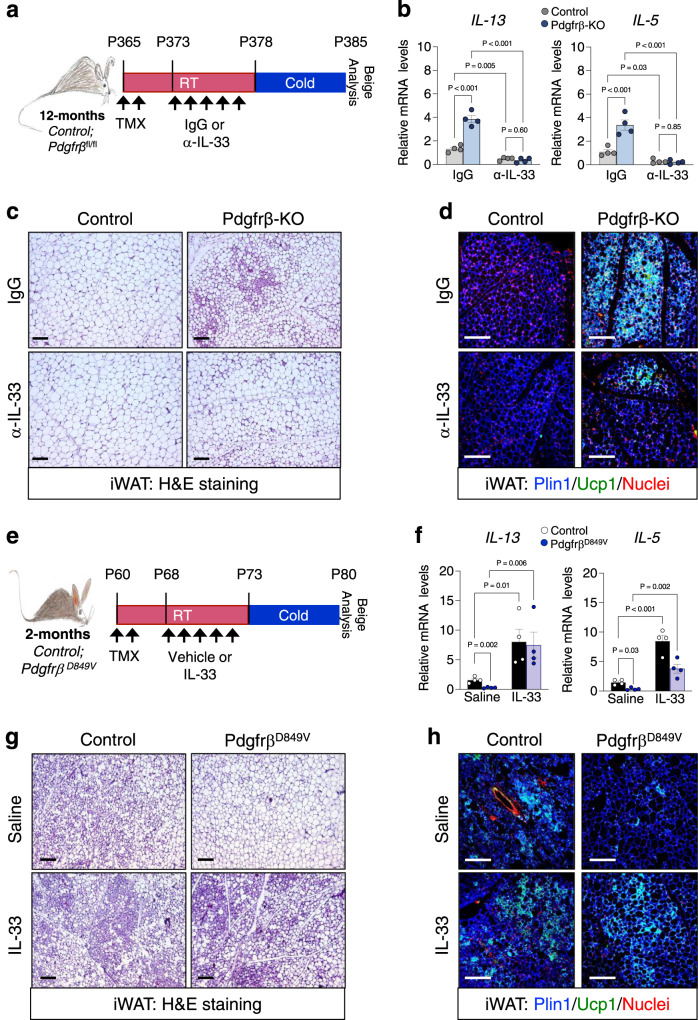
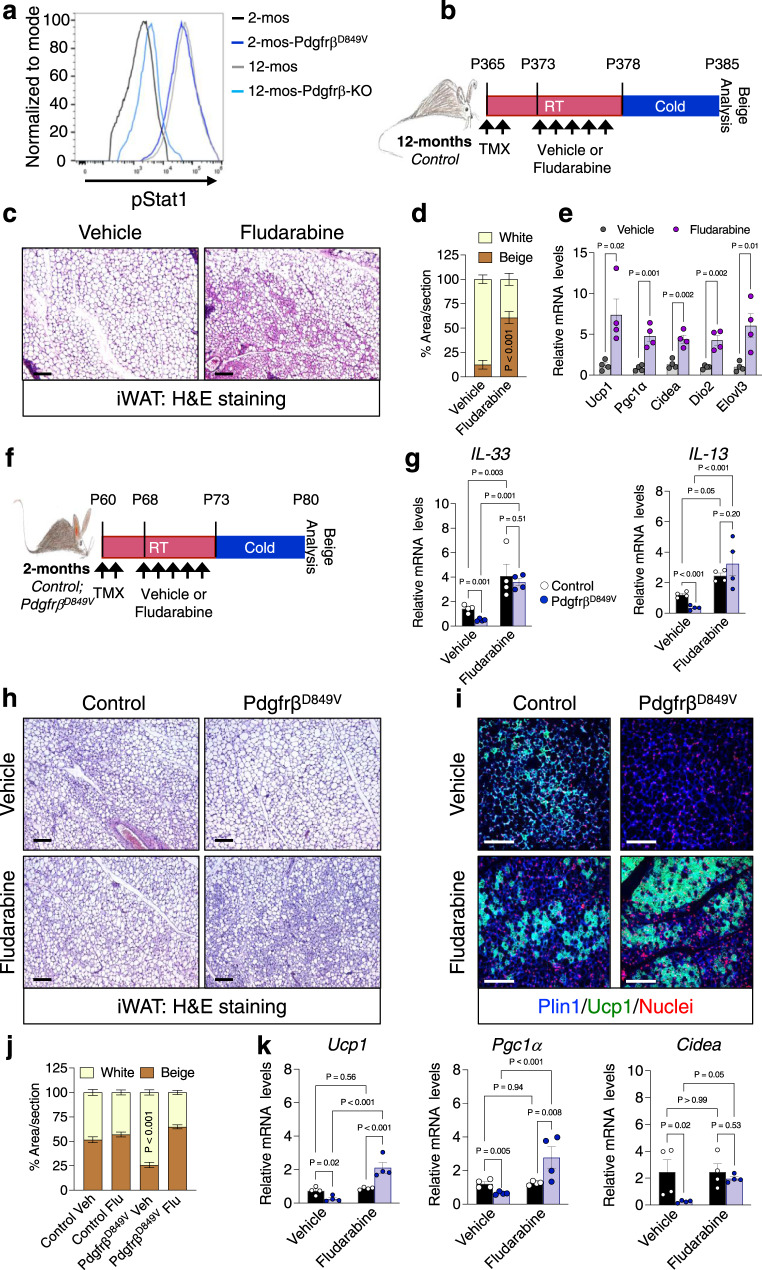
Perivascular adipocyte progenitor cells (APCs) can generate cold temperature-induced thermogenic beige adipocytes within white adipose tissue (WAT), an effect that could counteract excess fat mass and metabolic pathologies. Yet, the ability to generate beige adipocytes declines with age, creating a key challenge for their therapeutic potential. Here we show that ageing beige APCs overexpress platelet derived growth factor receptor beta (Pdgfrβ) to prevent beige adipogenesis. We show that genetically deleting Pdgfrβ, in adult male mice, restores beige adipocyte generation whereas activating Pdgfrβ in juvenile mice blocks beige fat formation. Mechanistically, we find that Stat1 phosphorylation mediates Pdgfrβ beige APC signaling to suppress IL-33 induction, which dampens immunological genes such as IL-13 and IL-5. Moreover, pharmacologically targeting Pdgfrβ signaling restores beige adipocyte development by rejuvenating the immunological niche. Thus, targeting Pdgfrβ signaling could be a strategy to restore WAT immune cell function to stimulate beige fat in adult mammals.


Conflict of interest statement

The authors declare no competing interests.

Figures

Fig. 1
Fig. 1. Ageing is associated with diminished beige fat development and Pdgfrβ upregulation.
a, b Representative H&E staining (a) and perilipin (Plin1; blue) and Ucp1 (green) immunostaining (b) of dorsolumbar iWAT sections from cold exposed (6.5 °C for 7 days) 2-, 6-, 12-, and 24-month-old C57BL6/J-129SV male mice (×10; ×20 magnification, scale bars 100 µm). c Heatmap of gene expression profiles comparing iWAT SVF from 2- and 12-month-old male mice maintained at RT. d, e mRNA levels of Pdgfrβ and p16Ink4a gene expression in FACS isolated iWAT Sma+ beige APCs at denoted ages (d) or from vicenarian and quadragenarian human WAT SVF (e) (n = 4 mice or humans/group). Data are presented as mean values ± SEM. Data were analyzed by two-tailed Student’s t-test. Source data are provided within the Source Data file. The full list of genes and normalized counts for the gene expression analysis can be found in Supplementary Data 1 and 2.
Fig. 2
Fig. 2. Loss of Pdgfrβ restores beige adipocyte development in ageing mice.
a Allelic schematic for generating Sma-Control and Sma-Pdgfrβ-KO mouse models. The Sma-CreERT2 mouse model was combined with either R26-tdTomato(RFP) or R26-mTmG serving as the control model. The control model (Sma-CreERT2; R26-tdTomato(RFP)) was then combined with the Pdgfrβfl/fl conditional mouse model to create Sma-Pdgfrβ-KO mice. In the presence of TMX, the reporter will be turned on while the Pdgfrβ allele will be excised. b Experimental schema: Sma-Control (Control) and Sma-Pdgfrβ-KO (Pdgfrβ-KO) mice littermates were aged matched until 2, 6, or 12 months of age and then administered one dose of TMX for 2 consecutive days. Mice were randomized to RT or cold exposure for 7 days (n = 10–15 mice/group). c, d Representative H&E staining (c) and Plin1 (blue) and Ucp1 (green) immunostaining (d) from cold exposed mice described in (b) (×20 magnification, scale bars 100 µm).
Fig. 3
Fig. 3. Activating Pdgfrβ signaling blocks beige fat formation in 2-month-old mice.
a Experimental schema: 2-month-old Sma-Control male mice were administered one dose of vehicle (1X PBS) or Pdgf-BB (25 ng/mouse) for 5 consecutive days by IP injection; subsequently, cold challenged for 3 days (Vehicle n = 8; Pdgf-BB n = 10). b Representative H&E staining of dorsolumbar iWAT sections from cold exposed mice described in (a) (×10 magnification, scale bars 100 µm). c Representative Plin1 (blue) and Ucp1 (green) immunostaining of dorsolumbar iWAT sections from mice described in (a) (×20 magnification, scale bars 100 µm). d Quantification of beige and white adipocyte area per section (n = 3 images/mouse from 3 mice) from immunostained images in (c). e mRNA levels of denoted thermogenic gene expression within dorsolumbar iWAT depots from cold exposed mice described in (a) (n = 4 mice/group). f Experimental schema: 2-month-old TMX-induced Sma-Control and Sma-PdgfrβD849V male mice were cold temperature challenged for 7 days. g Representative H&E staining of dorsolumbar iWAT sections from cold exposed male mice described in (f) (×10 magnification, scale bars 100 µm) (Images representative of 3 independent experiments). h Representative Plin1 (blue) and Ucp1 (green) immunostaining from dorsolumbar iWAT sections from mice described in (f) (×20 magnification, scale bars 100 µm). i Quantification of beige and white adipocyte area per section (n = 3 images/mouse; 3 mice/group) from immunostained images in (h). j mRNA levels of thermogenic gene expression within dorsolumbar iWAT depots from cold exposed male mice (n = 4 mice/group). Data are presented as mean values ± SEM. Data were analyzed by two-tailed Student’s t-test. Source data are provided within the Source data file.
Fig. 4
Fig. 4. IL-33 is mediated by Pdgfrβ signaling to regulate beige fat development.
a Heatmap of gene expression profiles comparing the SVF from iWAT depots from 12-month-old Sma-Control and Sma-Pdgfrβ-KO male mice maintained at RT. b, c mRNA expression of IL-33 within iWAT depots of 2- (b) and 12-month-old (c) Sma-Control and Sma-Pdgfrβ-KO mutant mice maintained at RT or cold exposed (2 days) (n = 4 mice/group). d Experimental schema: TMX-induced aged Sma-Control male mice were administered one dose of vehicle (0.1% BSA in 1x PBS) or IL-33 (12 µg/kg) for 5 consecutive days and subsequently cold exposed for 2 or 7 days. e Representative images of H&E staining of dorsolumbar iWAT sections from mice described in (d) (×10 magnification, scale bar 100 µm) (Images representative of 2 independent experiments). f Representative images of Plin1 (blue) and Ucp1 (green) immunostaining of iWAT sections from mice described in (d) (×20 magnification, scale bar 100 µm). g Quantification of beige and white adipocyte area per section (n = 3 images/mouse; 3 mice/group) from immunostained images in (f). h mRNA levels of thermogenic gene expression within iWAT depots of cold exposed mice described in (a) (n = 4 mice/group). i mRNA levels of IL-13 and IL-5 within iWAT depots from 2-day cold exposed mice described in (d) (n = 4 mice/group). Data are presented as mean values ± SEM. Data was analyzed by two-tailed Student’s t-test or two-way ANOVA for multiple comparisons. Source data are provided within the Source data file. The full list of genes and normalized counts for the gene expression analysis can be found in Supplementary Data 3.
Fig. 5
Fig. 5. Pdgfrβ-KO induced beige fat development is mediated by IL-33.
a Experimental schema: TMX-induced 12-month-old Sma-Control and Sma-Pdgfrβ-KO male mice were administered one dose of mouse IgG (1 µg/mouse) or α-IL-33 (1 µg/mouse) antibodies for 5 consecutive days and subsequently cold exposed for 2 or 7 days. b mRNA levels of IL-13 and IL-5 within iWAT depots from 2-day cold exposed mice described in (f) (n = 4 mice/group). c Representative H&E staining of dorsolumbar iWAT sections from 7-day cold exposed mice described in (a) (×10 magnification, scale bars 100 µm). d Representative Plin1 (blue) and Ucp1 (green) immunostaining from iWAT sections from 7-day cold exposed mice described in (a) (×20 magnification, scale bars 100 µm) (Images representative of 2 independent experiments). e Experimental schema: 2-month-old TMX-induced Sma-Control and Sma-PdgfrβD849V were administered one dose of vehicle (0.1%BSA in 1xPBS) or recombinant murine IL-33 (12 µg/kg) for 5 consecutive days and subsequently cold exposed for 2 or 7 days. f mRNA levels of IL-13 and IL-5 within iWAT depots from 2-day cold exposed mice described in (e) (n = 4 mice/group). g Representative H&E staining of dorsolumbar iWAT sections from vehicle or IL-33 treated PdgfrβD849V 7-day cold exposed mice as described in (e) (×10 magnification, scale bars 100 µm). h Representative of Plin1 (blue) and Ucp1 (green) immunostaining of dorsolumbar iWAT sections from Control and PdgfrβD849V 7-day cold exposed mice (×20 magnification, scale bars 100 µm) (Images representative of 2 independent experiments). Data are presented as mean values ± SEM. Data were analyzed by two-tailed Student’s t-test or two-way ANOVA for multiple comparisons. Source data are provided within the Source data file.
Fig. 6
Fig. 6. Stat1 phosphorylation mediates Pdgfrβ induced beige adipogenic failure.
a Sma-mGFP+ cells were FACS isolated from 2-month-old TMX-induced Sma-Control and Sma-PdgfrβD849V or from 12-month-old TMX-induced Sma-Control and Sma-Pdgfrβ-KO mice and examined for phosphorylated Stat1 by flow cytometry. b Experimental schema: 12-month-old TMX-induced Sma-Control mice were administered one dose of vehicle (5% DMSO) or fludarabine (3 mg/kg) for 5 consecutive days and subsequently cold challenged for 2 or 7 days. c Representative H&E staining of dorsolumbar iWAT sections from 7-day cold exposed mice described in (b) (×10 magnification, scale bars 100 µm). d Quantification of beige and white adipocyte area per section (n = 3 images/mouse; 3 mice/group) from immunostained images (Supplementary Fig. 8d). e mRNA levels of denoted thermogenic genes within dorsolumbar iWAT depots from mice described in (b) after 7 days of cold exposure (n = 4 mice/group). f Experimental schema: 2-month-old TMX-induced Sma-Control and Sma-PdgfrβD849V male mice were administered one dose of vehicle (5% DMSO) or fludarabine (3 mg/kg) for 5 consecutive days and subsequently cold exposed for 2 or 7 days. g mRNA levels of IL-33 and IL-13 markers within iWAT depots from 2-day cold exposed mice described in (f) (n = 4 mice/group). h, i Representative images of H&E staining (h) and Plin1 (blue) and Ucp1 (green) immunostaining (i) of dorsolumbar iWAT sections from cold exposed mice described in (f) (×10 and ×20 magnification, scale bars 100 µm) (Images representative of 2 independent experiments). j Quantification of beige and white adipocyte area per section (n = 3 images/mouse; 3 mice/group) from immunostained images in (i). k mRNA levels of denoted thermogenic gene expression within iWAT depots from mice described in (f) (n = 4 mice/group). Data are presented as mean values ± SEM. Data were analyzed by two-tailed Student’s t-test or two-way ANOVA for multiple comparisons. Source data are provided within the Source data file.
Fig. 7
Fig. 7. Pharmacologically blocking Pdgfrβ restores beige adipogenesis.
a Experimental schema: 12-month-old TMX-induced Sma-Control male mice were administered one dose of vehicle (5% DMSO), imatinib (5 mg/kg), or SU16f (2 mg/kg) for 5 consecutive days and subsequently cold challenged for 2 or 7 days (n = 8 mice/group). bd Representative H&E staining (b), Ucp1-IHC (c), and Plin1 (blue) and Ucp1 (green) immunostaining (d) of dorsolumbar iWAT sections from 7-day cold exposed mice described in (a) (×10 or ×20 magnification, scale bars 100 µm). e mRNA levels of denoted thermogenic gene expression within dorsolumbar iWAT depots from mice described in (a) (n = 4 mice/group). f Sma-mGFP+ cells were FACS isolated from mice described in (a) prior to cold exposure. Representative flow cytometric histogram plot of Sma+ beige APCs examined for phosphorylated Stat1. g mRNA levels of IL-33 and IL-13 within iWAT depots from 2-day cold exposed mice described in (a) (n = 3 mice/group). Data are presented as mean values ± SEM. Data were analyzed by two-tailed Student’s t-test. Source data are provided within the Source data file.

References

    1. Kennedy BK, et al. Geroscience: linking aging to chronic disease. Cell. 2014;159:709–713. doi: 10.1016/j.cell.2014.10.039. - DOI - PMC - PubMed
    1. Kusminski CM, Bickel PE, Scherer PE. Targeting adipose tissue in the treatment of obesity-associated diabetes. Nat. Rev. Drug Disco. 2016;15:639–660. doi: 10.1038/nrd.2016.75. - DOI - PubMed
    1. Vishvanath L, Gupta RK. Contribution of adipogenesis to healthy adipose tissue expansion in obesity. J. Clin. Invest. 2019;129:4022–4031. doi: 10.1172/JCI129191. - DOI - PMC - PubMed
    1. Spiegelman BM, Flier JS. Obesity and the regulation of energy balance. Cell. 2001;104:531–543. doi: 10.1016/S0092-8674(01)00240-9. - DOI - PubMed
    1. Ahima RS. Connecting obesity, aging and diabetes. Nat. Med. 2009;15:996–997. doi: 10.1038/nm0909-996. - DOI - PubMed

Publication types

Substances