. 2023 Mar 31;14(1):1794.
doi: 10.1038/s41467-023-37515-8.

Smad3 is essential for polarization of tumor-associated neutrophils in non-small cell lung carcinoma

Affiliations

Smad3 is essential for polarization of tumor-associated neutrophils in non-small cell lung carcinoma

Jeff Yat-Fai Chung et al. Nat Commun. .

Abstract

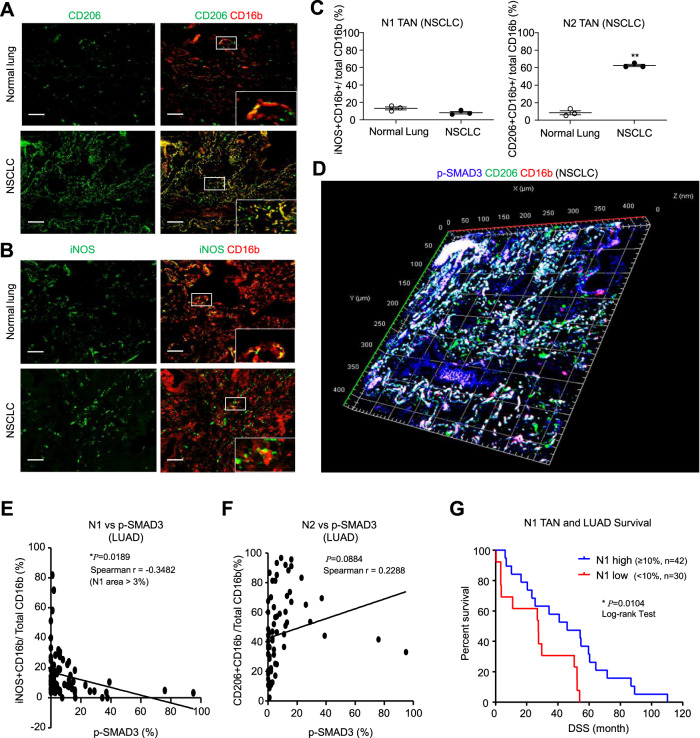
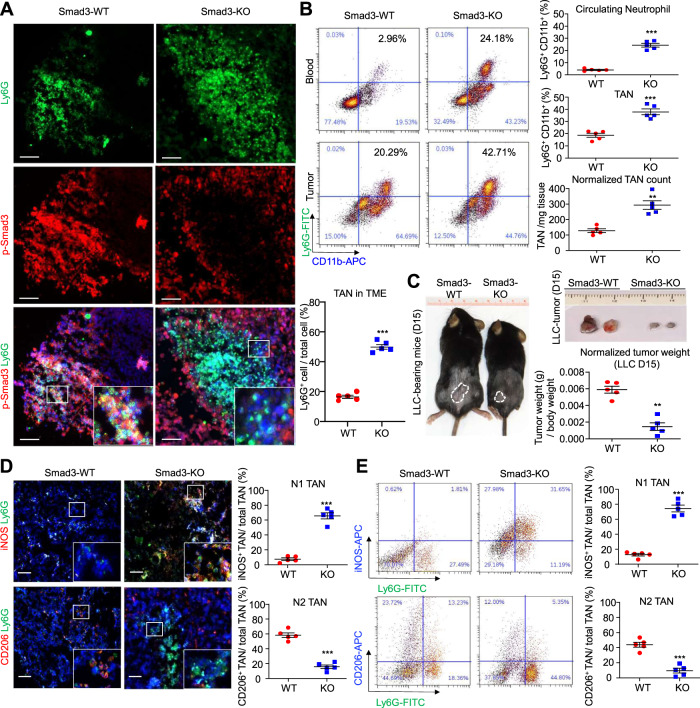
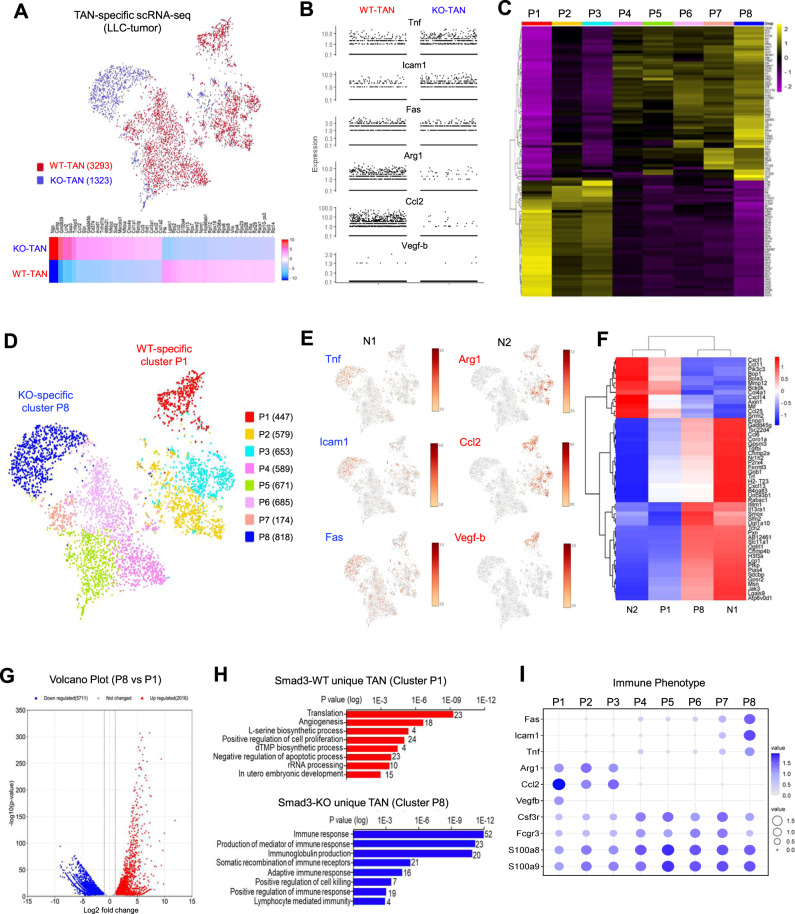
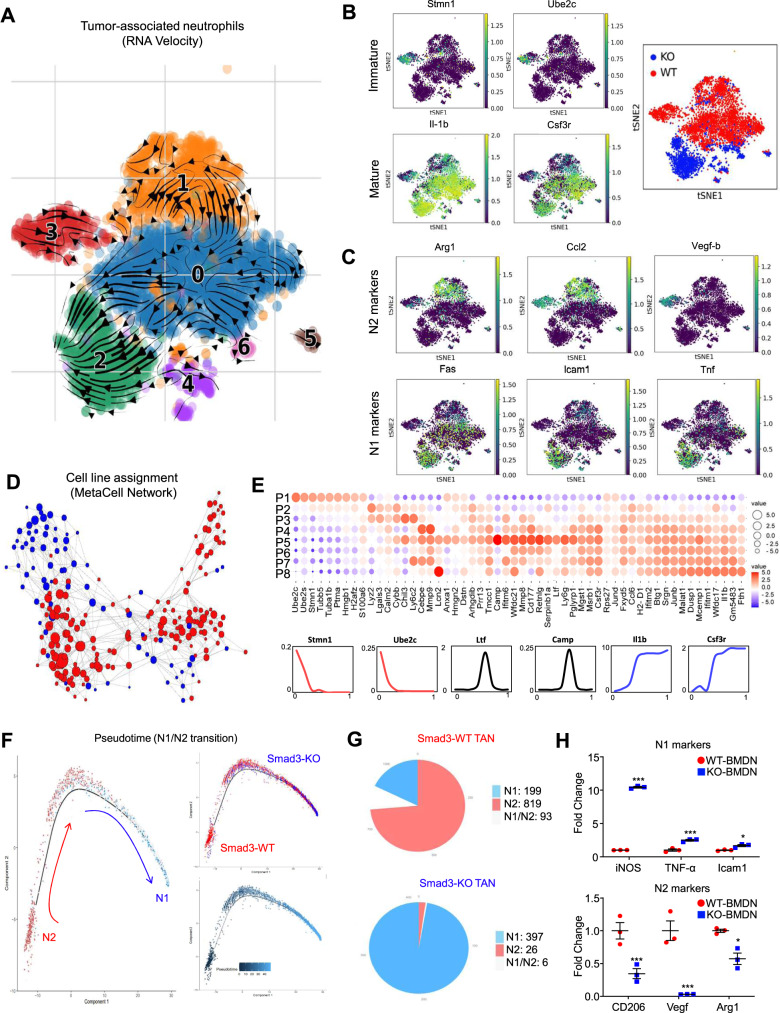
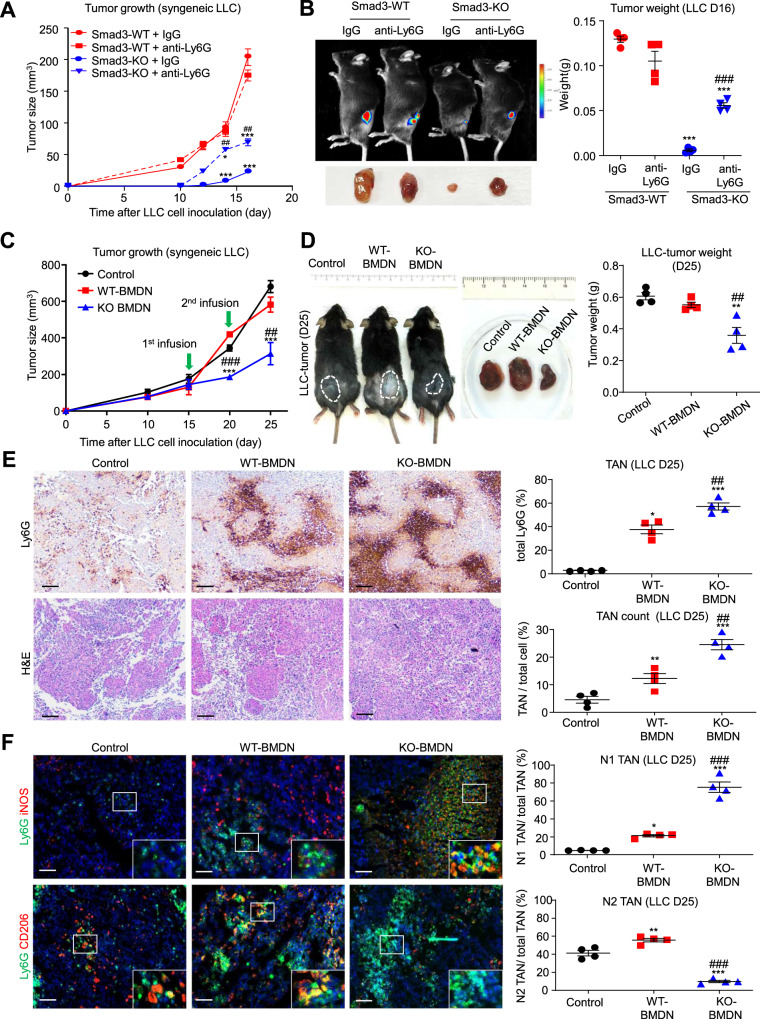
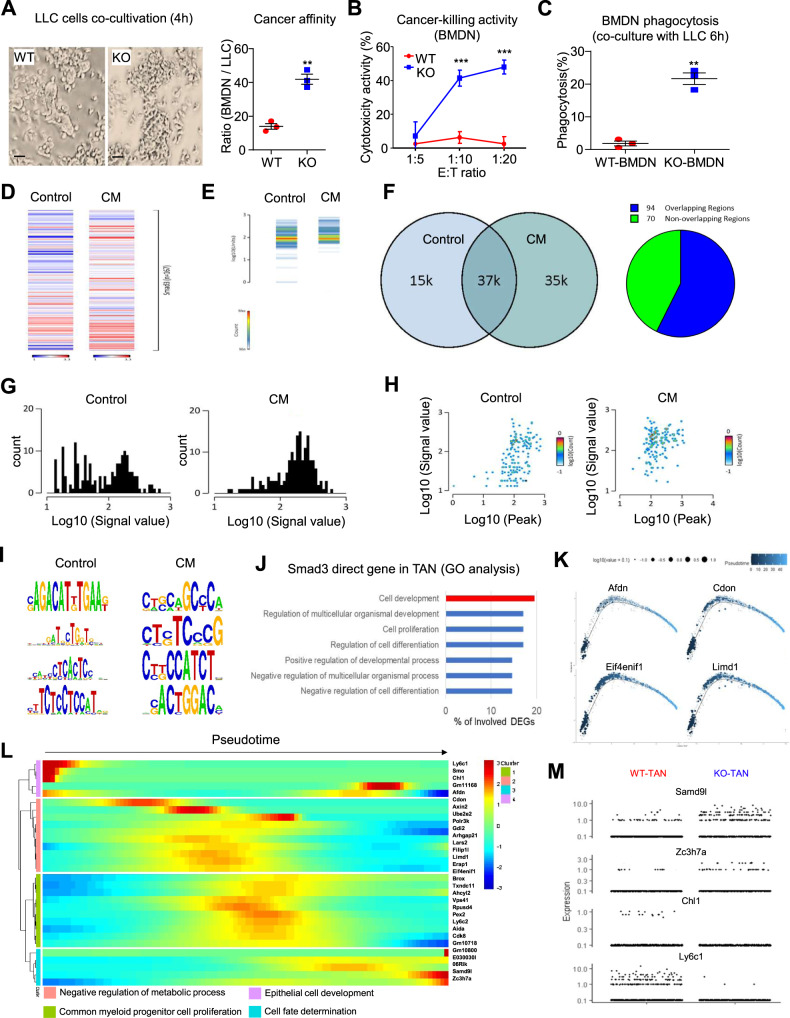
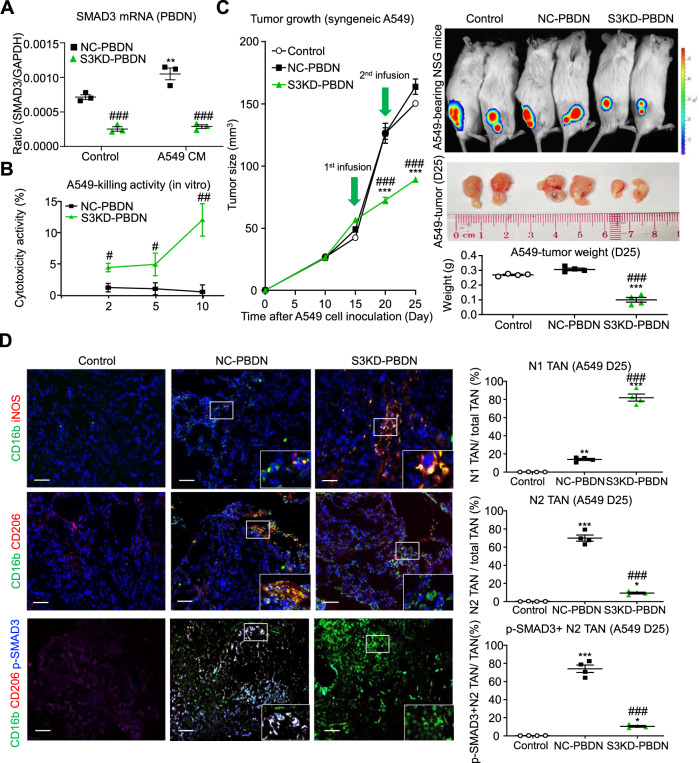
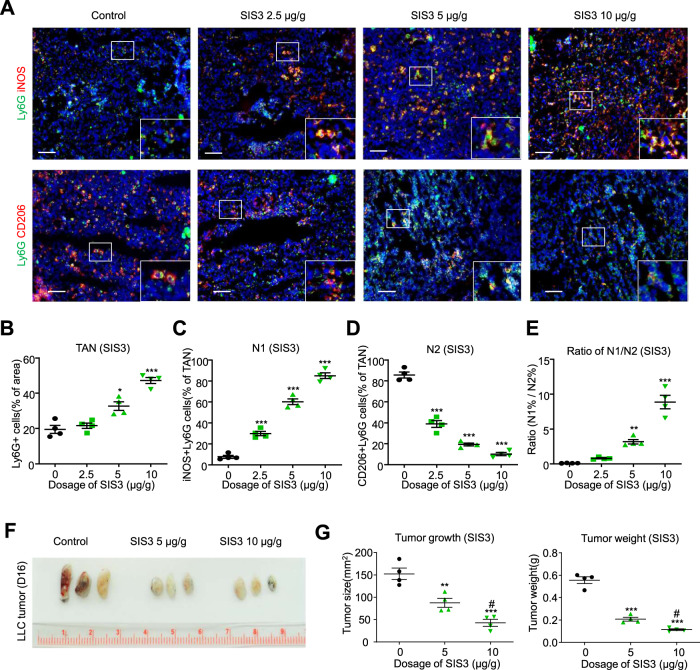
Neutrophils are dynamic with their phenotype and function shaped by the microenvironment, such as the N1 antitumor and N2 pro-tumor states within the tumor microenvironment (TME), but its regulation remains undefined. Here we examine TGF-β1/Smad3 signaling in tumor-associated neutrophils (TANs) in non-small cell lung carcinoma (NSCLC) patients. Smad3 activation in N2 TANs is negatively correlate with the N1 population and patient survival. In experimental lung carcinoma, TANs switch from a predominant N2 state in wild-type mice to an N1 state in Smad3-KO mice which associate with enhanced neutrophil infiltration and tumor regression. Neutrophil depletion abrogates the N1 anticancer phenotype in Smad3-KO mice, while adoptive transfer of Smad3-KO neutrophils reproduces this protective effect in wild-type mice. Single-cell analysis uncovers a TAN subset showing a mature N1 phenotype in Smad3-KO TME, whereas wild-type TANs mainly retain an immature N2 state due to Smad3. Mechanistically, TME-induced Smad3 target genes related to cell fate determination to preserve the N2 state of TAN. Importantly, genetic deletion and pharmaceutical inhibition of Smad3 enhance the anticancer capacity of neutrophils against NSCLC via promoting their N1 maturation. Thus, our work suggests that Smad3 signaling in neutrophils may represent a therapeutic target for cancer immunotherapy.


Conflict of interest statement

The authors declare no competing interests.

Figures

Fig. 1
Fig. 1. SMAD3 activation is negatively associated with an N1 phenotype in NSCLC.
AC Confocal imaging and quantification show a marked accumulation of N2 TANs (CD206+CD16b+ cells) in NSCLC compared to adjacent normal lung tissue, which contrasts with the small population of N1 TANs (iNOS+CD16b+ cells) (**P < 0.01 vs. normal lung; two-tailed t-test). D Three-dimensional confocal image showing SMAD3 activation (p-SMAD3, blue) in many N2 TANs (CD206+CD16b+ cells) in NSCLC. Correlation analysis shows that Smad3 activation (E) has a negative correlation with the proportion of N1 TANs (F) but does not correlate with the proportion of N2 TANs (Pearson correlation two-tailed test). G A low proportion of N1 TANs are significantly associated with higher patient mortality in NSCLC (log-rank (Mantel–Cox) test). Scale bar, 50 μm. AD Data represents mean ± SEM of three patients/group. EG Data based on a cohort of 72 patients. The exact P values of normal lung vs. NSCLC tissue are 1C. P = 0.0655(N1 TAN) and P = 0.004(N2 TAN). Source data are provided as a Source Data file.
Fig. 2
Fig. 2. Smad3 deficiency increases the proportion of N1 TANs in LLC tumors.
A Confocal imaging and B flow cytometry, show an increase in Ly6G+ neutrophils in the circulation and in the TME of LLC-bearing Smad3-KO mice compared to wild-type (Smad3-WT) controls (**P < 0.01, ***P < 0.001 vs. Smad3-WT, two-tailed t-test). C Smad3-KO mice show smaller tumors compared to Smad3-WT controls on day 15 (**P < 0.01 vs. WT, two-tailed t-test). D Immunofluorescence and E flow cytometric analysis showed a low proportion of N1 (iNOS+Ly6G+) and a high proportion of N2 (CD206+ Ly6G+) phenotype TANs in Smad3-WT mice, which is reversed in Smad3-KO mice which show a high abundance of N1 and a low abundance of N2 TANs (***P < 0.01 vs. WT, two-tailed t-test). Scale bars, 50 μm. AE Data represents mean ± SEM of five mice/group. The exact P values of WT vs. KO are 2A. P = 0.0002(TAN in TME), 2B. P = 0.002(Circulating Neutrophil), P = 0.0004(TAN), P = 0.0078(Normalized TAN count). 2C. P = 0.0011. 2D. P = 0.0003(N1 TAN), P = 0.0002(N2 TAN). 2E. P = 0.0002(N1 TAN), P = 0.0005(N2 TAN). Source data are provided as a Source Data file.
Fig. 3
Fig. 3. Transcriptome analysis showing that Smad3 regulates N1/N2 polarization in TANs.
TANs (Ly6G+CD11b+ cells) sorted from LLC tumors in Smad3-WT and Smad3-KO mice (pooled from eight tumors /group) underwent scRNA-seq. A t-SNE plot and heatmap of the filtered scRNA-seq dataset show distinct transcriptome profiles of TANs from Smad3-WT (red) and Smad3-KO (blue) mice. B Expression plot shows Smad3-KO TANs predominantly express markers of an N1 phenotype (Tnf, Icam1, and Fas), whereas Smad3-WT TANs predominantly express markers of an N2 phenotype (Arg1, Ccl2, and Vegf-b). C Heatmap and D t-SNE plot showing the top 100 differential expressed genes (DEGs) and the relationship amongst eight clusters (P1 to P8) of Smad3-WT and -KO TANs unbiasedly grouped using the Louvain method. E t-SNE plots show enrichment of N2 markers (Arg1, Ccl2, and Vegf-b) in the Smad3-WT-specific P1 cluster and enrichment of N1 markers (Tnf, Icam1, and Fas) in the Smad3-KO-specific P8 cluster. F Heatmap analysis further indicates that P1 and P8 clusters share transcriptome signatures with N2 and N1 TANs, respectively, as defined by ref. . G Volcano plot shows the distinct transcriptome profile of P8 compared to P1 (statistical significance calculated by Loupe Cell Browser). H GO analysis of upregulated differentially expressed genes (DEGs) extracted from Smad3-WT (P1) and Smad3-KO (P8) specific clusters reveals that Smad3-KO TANs acquired anticancer functions via cell killing and immune responses, compared to Smad3-WT TANs which exhibit a protumor phenotype with functions of angiogenesis and positive regulation of cell proliferation. (Benjamini–Hochberg–corrected two-tailed t-test). I Dot plot visualizing the switch of N1 and N2 marker expression across clusters P1–P8, suggesting a regulatory role of Smad3 in the phenotypic shift of TANs.
Fig. 4
Fig. 4. Transcriptome analysis shows a derivation of TAN development in N1/N2 TANs.
A The arrows in the diffusion plot of RNA velocity analysis of the TAN dataset from Fig. 3A indicates that the Smad3-KO N1 population (cluster 2, green) is derived from the Smad3-WT N2 (cluster 3, red) as shown by: B expression of neutrophil maturation markers, C expression of N1/N2 markers, and D the cell line assignment (k-NN) MetaCell network graph showing the developmental relationship between Smad3-WT and KO TAN from Fig. 3A. E Dot plot showing the transcription gradient of neutrophil development gene expression from immature P1 to the mature P8 cluster. The size and color of the circles represent the value of log2 fold change and the direction of change in expression, respectively, of neutrophil development genes (lower panel) in each cluster. F Pseudotime analysis of the TAN scRNA-seq dataset clearly visualized an extended trajectory of the Smad-WT N2 (Ccl2+) phenotype towards the Smad3-WT N1 (Tnf+) phenotype within the LLC tumor, where G Smad3-KO TANs (397/429 cells = 92.5%) preserved an N1 phenotype compared to Smad3-WT cells (199/1111 cells = 17.9%). H RT-PCR analysis of BMDN stimulated LLC conditioned medium shows increased fold change of N1 markers (iNOS, Tnf-α, and Icam1) in Smad3-KO neutrophils, while Smad3-WT neutrophils showed increased levels of N2 markers (CD206, Vegf, and Arg1) (*P < 0.05, ***P < 0.001 vs. WT-BMDN, n = 3 independent samples, one-way ANOVA). H Data represents mean ± SEM from three independent experiments. The exact P values of WT-BMDN vs. KO-BMDN are 4H. P = 0.0001 (iNOS), P = 0.0001(Tnf-α), P = 0.0149(Icam1), P = 0.001(CD206), P = 0.0001(Vegf), and P = 0.0211(Arg1). Source data are provided as a Source Data file.
Fig. 5
Fig. 5. Silencing of Smad3 enhances the antitumor activity of TANs in vivo.
A, B Smad3-WT and Smad3-KO mice were treated with anti-Ly6G or control IgG beginning 3 days before inoculation with LLC cells and killed on day 16 and analysed for; A tumor size, and B tumor weight (*P < 0.05, ***P < 0.001 vs. IgG-treated Smad3-WT mice; ##P < 0.01, ###P < 0.001 vs. IgG-treated Smad3-KO mice; one-way ANOVA). CF Adoptive transfer of Smad3-knockout (KO-BMDN), but not wild-type BMDNs (WT-BMDN), on days 15 and 20 significantly inhibited the growth of LLC tumors in Smad3-WT mice as shown by: C tumor size, and D tumor weight, on day 25. E Immunohistochemistry and H&E staining shows that adoptive transfer of WT-BMDNs increases the proportion of neutrophils within the TME in LLC tumors, while the transfer of KO-BMDN resulted in an even greater proportion of neutrophils in the TME. F Immunostaining shows that the transfer of WT-BMDN did not affect the proportions of N1 and N2 TANs in the TME, whereas the transfer of KO-BMDN caused a substantial change in the proportion of N1 and N2 TANs. (*P < 0.05, **P < 0.01, ***P < 0.001 vs. Control, ##P < 0.01, ###P < 0.001 vs. WT-BMDN, one-way ANOVA). Scale bars, 50 μm. AF Data represents mean ± SEM of 4 mice/group. The exact P values of IgG- vs. anti-Ly6G-treatment are 5A. P = 0.0001 (IgG KO vs. IgG WT, D14), P = 0.0122 (anti-Ly6G KO vs. IgG WT, D14), P = 0.0049 (anti-Ly6G KO vs. IgG KO, D14), P = 0.0001 (IgG KO vs. IgG WT, D16), P = 0. 0001 (anti-Ly6G KO vs IgG WT, D16), P = 0.0085 (anti-Ly6G KO vs. IgG KO, D16), 5B. P = 0.0001 (IgG KO vs IgG WT), P = 0.0001 (anti-Ly6G KO vs. IgG WT), and P = 0.0003 (anti-Ly6G KO vs. IgG KO). Exact P values of BMDN adoptive transfer are 5C. P = 0.0001 (KO-BMDN vs. WT-BMDN, D20), P = 0.0001 (KO-BMDN vs. Control, D20), P = 0.007 (KO-BMDN vs. WT-BMDN, D25), P = 0.0009 (KO-BMDN vs. Control, D25). 5D. P = 0.0068 (KO-BMDN vs. WT-BMDN), P = 0.0014 (KO-BMDN vs. Control), 5E. P = 0.0013 (KO-BMDN vs. WT-BMDN, Ly6G), P = 0.0001 (KO-BMDN vs. Control, Ly6G), P = 0.0226 (WT-BMDN vs. Control, Ly6G), P = 0.0018 (KO-BMDN vs. WT-BMDN,H&E), P = 0.0001 (KO-BMDN vs. Control, H&E), P = 0.0001 (WT-BMDN vs. Control, H&E). 5F. P = 0.0001 (KO-BMDN vs. WT-BMDN,N1 TAN), P = 0.0001 (KO-BMDN vs. Control, N1 TAN), P = 0.0205 (WT-BMDN vs. Control, N1 TAN), P = 0.0001 (KO-BMDN vs. WT-BMDN, N2 TAN), P = 0.0001 (KO-BMDN vs. Control, N2 TAN), P = 0.0039 (WT-BMDN vs. Control, N2 TAN). Source data are provided as a Source Data file.
Fig. 6
Fig. 6. Smad3 regulates the development of TANs at the genomic level.
AC Smad3-WT and Smad3-KO-BMDN were co-cultured with LLC cells and assayed for; A binding of BMDN to LLC cells, B killing of LLC cells at different ratios of BMDN to LLC cells, and C phagocytosis of Dil-labeled LLC cells (**P < 0.01, ***P < 0.001 vs. WT-BMDN, n = 3 independent samples, two-tailed t-test) respectively. DJ Smad3-WT-BMDN (pooled from 4 mice /group) were cultured with 10% LLC-CM or normal media (control) for 2 h and analysed by Smad3-specific ChIP-seq. A substantial change in Smad3 binding to the genome was evident in BMDN stimulated by LLC-CM as shown by; D, E heatmap analysis, F overlap region chart, G enrichment plot, H correlation plot, and I binding motif analysis. J Gene ontology (GO) annotation reveals Smad3 directly regulates genes associated with cell development and differentiation in BMDNs stimulated with LLC-CM. Expression profiles of Smad3 target genes (K) related to neutrophil development (Afdn, Cdon, Elf4enif1, and Limd1) (statistical significance calculated from Monocle package) and L their functional annotation along the developmental pathway TANs (as in Fig. 3I). M Expression plot of N1 (Smad9l and Zc3h7a) and N2 (Chl1 and Ly6c1) Smad3 target genes in Smad3-WT and Smad3-KO TANs. Scale bar, 50 μm. AC Data represents mean ± SEM from three independent experiments. The exact P values of WT-BMDN vs. KO-BMDN are 6A. P = 0.0021. 6B. P = 0.0001(1:10), P = 0.0001(1:20). 6C. P = 0.003. Source data are provided as a Source Data file.
Fig. 7
Fig. 7. Neutrophil-specific silencing of SMAD3 enhances an N1 phenotype in NSCLC.
A RT-PCR analysis showing that transfection of human PBDN with SMAD3 siRNA (S3KD-PBDN), but not with nonsense control siRNA (NC-PBDN), suppresses basal (control) and A549 conditioned medium (A549 CM) stimulated to increase in SMAD3 expression (**P < 0.01 vs. Control, ###P < 0.001 vs. NC-PBDN, n = 3 independent samples, one-way ANOVA). B Co-culture studies show enhanced cytotoxicity of S3KD-PBDN towards the human NSCLC cell line A549 (**P < 0.01, ***P < 0.001, n = 3 independent samples, two-tailed t-test). C, D NSG immunocompromised mice were inoculated with A549 cells and then received injections of human NC-PBDN or S3KD-PBDN on days 15 and 20 and then killed on day 25. C Adoptive transfer of S3KD-PBDN caused a significant reduction in tumor size and weight, which was not apparent with a transfer of NC-PBDN (***P < 0.001 vs. untreated A549 tumors (Control), ###P < 0.001 vs. NC-PBDN, one-way ANOVA). D Immunostaining for human neutrophil markers showed that adoptive transfer of NC-PBDN resulted in a high proportion of TANs exhibiting an N2 phenotype (CD206+ CD16b+ cells), whereas transfer of S3KD-PBDN resulted in a high proportion of TANs exhibiting an N1 phenotype (iNOS+ CD16b+ cells). Furthermore, p-SMAD3 staining was seen in a high proportion of N2, but not in N1 TANs. (*P < 0.05, **P < 0.01, ***P < 0.001 vs. untreated A549 tumors (Control), ###P < 0.001 vs. NC-PBDN, one-way ANOVA) Scale bars, 50 μm. A, B Data represents mean ± SEM from three independent experiments. C, D Data represents mean ± SEM of 4 mice/group. The exact P values of NC-PBDN vs. S3KD-PBDN are 7A. P = 0.001 (Control), P = 0.0001(A549 CM-treated), P = 0.007 (NC-PBDN, Control vs. A549 CM-treated). 7B. P = 0.017 (1:2), P = 0.0157 (1:5), P = 0.0077 (1:10). Exact P values of PBDN treatment are 7C. P = 0.0002 (S3KD-PBDN vs. NC-PBDN, D20), P = 0.0002 (S3KD-PBDN vs Control, D20), P = 0.0001 (S3KD-PBDN vs. NC-PBDN, D25), P = 0.0001 (S3KD-PBDN vs. Control, D25), P = 0.0001 (S3KD-PBDN vs. NC-PBDN, tumor weight), P = 0.0001 (S3KD-PBDN vs. Control, tumor weight). 7D. P = 0.0001 (S3KD-PBDN vs. NC-PBDN, N1 TAN), P = 0.0001 (S3KD-PBDN vs. Control, N1 TAN), P = 0.0068 (NC-PBDN vs. Control, N1 TAN), P = 0.0001 (S3KD-PBDN vs. NC-PBDN, N2 TAN), P = 0.0404 (S3KD-PBDN vs. Control, N2 TAN), P = 0.0001 (NC-PBDN vs. Control, N2 TAN), P = 0.0001 (S3KD-PBDN vs. NC-PBDN, SMAD3 + N2 TAN), P = 0.0398 (S3KD-PBDN vs. Control, SMAD3 + N2 TAN), P = 0.0001 (NC-PBDN vs. Control, SMAD3 + N2 TAN). Source data are provided as a Source Data file.
Fig. 8
Fig. 8. Pharmaceutical inhibition of Smad3 promotes an N1 phenotype and suppresses tumor growth.
On day 7, after inoculation with LLC cells, Smad3-WT mice received daily administration of different doses of the Smad3 inhibitor, SIS3, or vehicle, until mice were killed on day 16. Immunostaining shows that SIS3 treatment increased the proportion of neutrophils (Ly6G+ cells) within the TME (A, B), increased the proportion of N1 (iNOS+ Ly6G+) TANs (C), decreased the proportion of N2 (CD206+ Ly6G+) TANs (D), changed the ratio of the N1/N2 phenotype in TANs (E), and suppressed LLC tumor growth and weight (F, G). (*P < 0.05, **P < 0.01, ***P < 0.001 vs. vehicle control, #P < 0.05, ##P < 0.01 vs. SIS3 5 μg/g, one-way ANOVA). Scale bars, 50 μm. AG Data represents mean ± SEM of 4 mice/group. The exact P values of treatment vs. control are 8B. P = 0.016 (SIS3 5 μg/g vs. vehicle), P = 0.0001 (SIS3 10 μg/g vs. vehicle), 8C. P = 0.0001 (SIS3 2.5, 5, 10 μg/g vs. vehicle). 8D. P = 0.0001 (SIS3 2.5, 5, 10 μg/g vs. vehicle). 8E. P = 0.029 (SIS3 5 μg/g vs. vehicle), P = 0.0001 (SIS3 10 μg/g vs. vehicle). 8G. P = 0.0042 (SIS3 5 μg/g vs. vehicle, tumor size), P = 0.0001 (SIS3 10 μg/g vs. vehicle, tumor size), P = 0.0335 (SIS3 5 μg/g vs. SIS3 10 μg/g, tumor size), P = 0.0042 (SIS3 5 μg/g vs. vehicle, tumor weight), P = 0.0001 (SIS3 10 μg/g vs. vehicle, tumor weight), P = 0.0273 (SIS3 5 μg/g vs. SIS3 10 μg/g, tumor weight). Source data are provided as a Source Data file.

References

    1. Kong X, et al. Cancer drug addiction is relayed by an ERK2-dependent phenotype switch. Nature. 2017;550:270–274. doi: 10.1038/nature24037. - DOI - PMC - PubMed
    1. Bray F, et al. Global cancer statistics 2018: GLOBOCAN estimates of incidence and mortality worldwide for 36 cancers in 185 countries. CA Cancer J. Clin. 2018;68:394–424. doi: 10.3322/caac.21492. - DOI - PubMed
    1. Boyero L, et al. Primary and acquired resistance to immunotherapy in lung cancer: unveiling the mechanisms underlying of immune checkpoint blockade therapy. Cancers. 2020;12:3729. doi: 10.3390/cancers12123729. - DOI - PMC - PubMed
    1. Yarchoan M, Hopkins A, Jaffee EM. Tumor mutational burden and response rate to PD-1 inhibition. N. Engl. J. Med. 2017;377:2500–2501. doi: 10.1056/NEJMc1713444. - DOI - PMC - PubMed
    1. Schreiber RD, Old LJ, Smyth MJ. Cancer immunoediting: integrating immunity’s roles in cancer suppression and promotion. Science. 2011;331:1565–1570. doi: 10.1126/science.1203486. - DOI - PubMed

Publication types