. 2023 Mar 31;14(1):1793.
doi: 10.1038/s41467-023-37468-y.

Within-host genetic diversity of SARS-CoV-2 lineages in unvaccinated and vaccinated individuals

Affiliations

Within-host genetic diversity of SARS-CoV-2 lineages in unvaccinated and vaccinated individuals

Haogao Gu et al. Nat Commun. .

Abstract

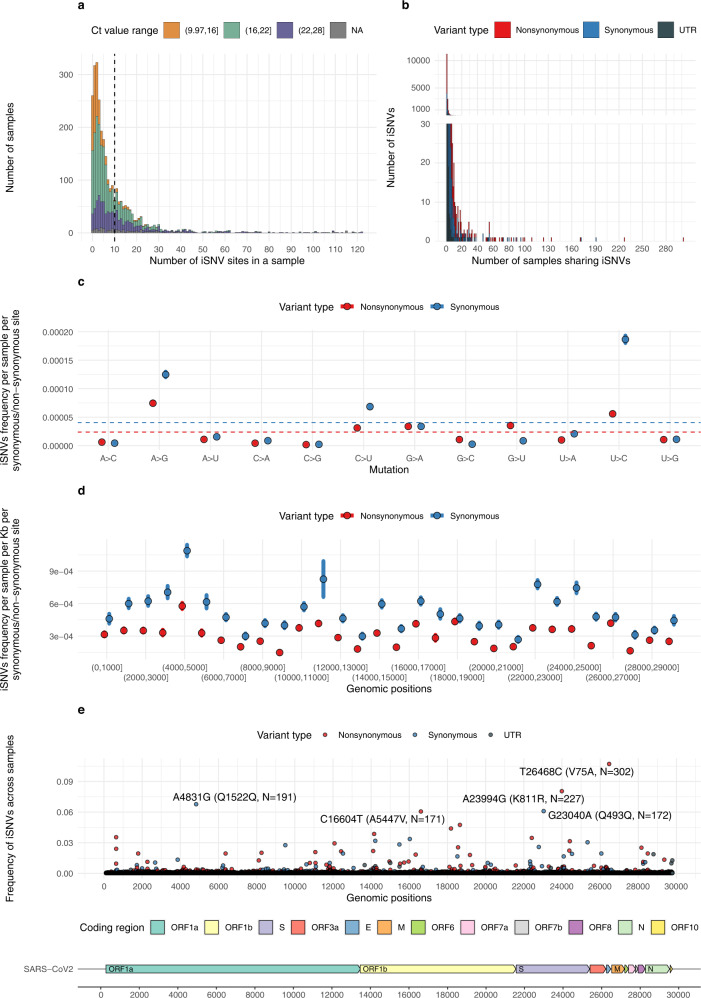
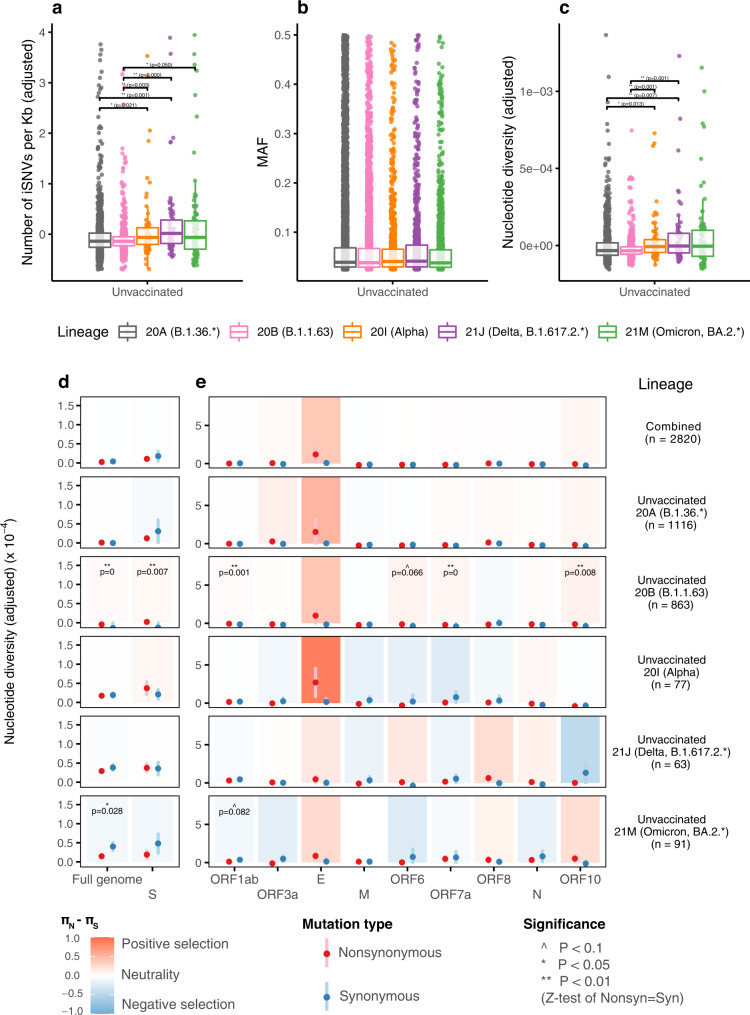
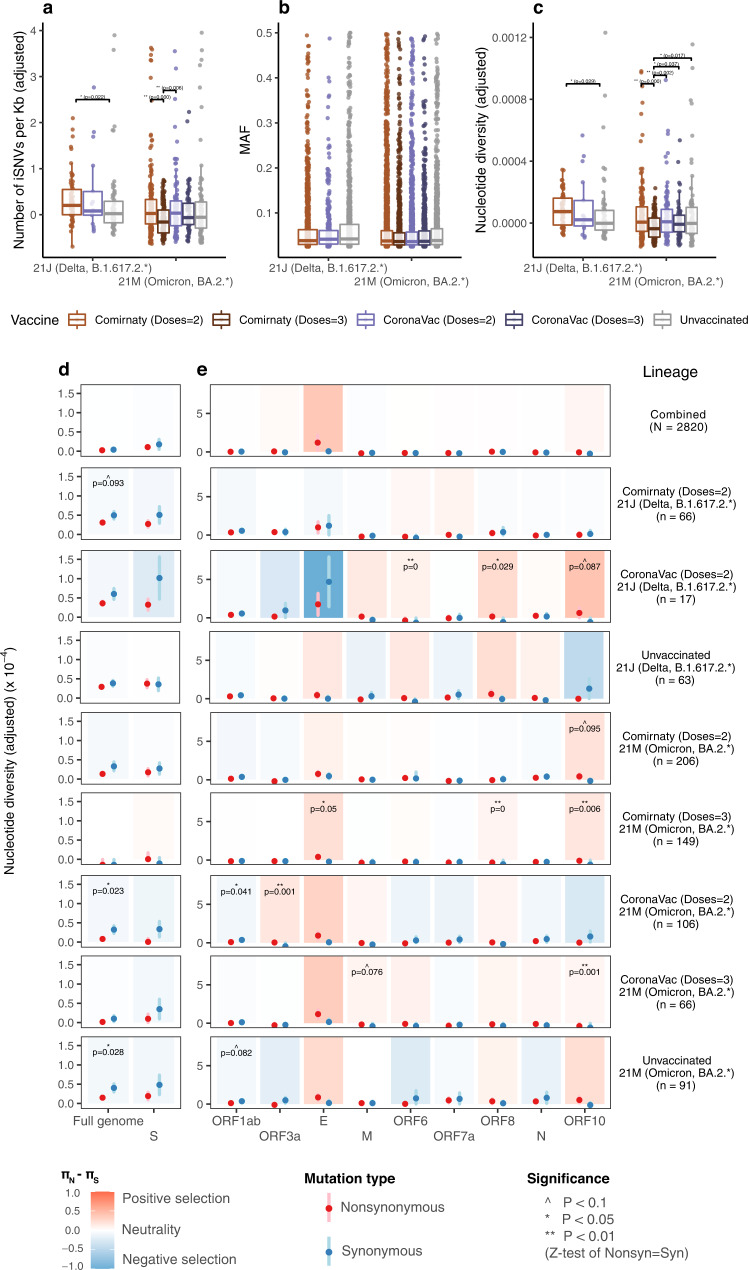
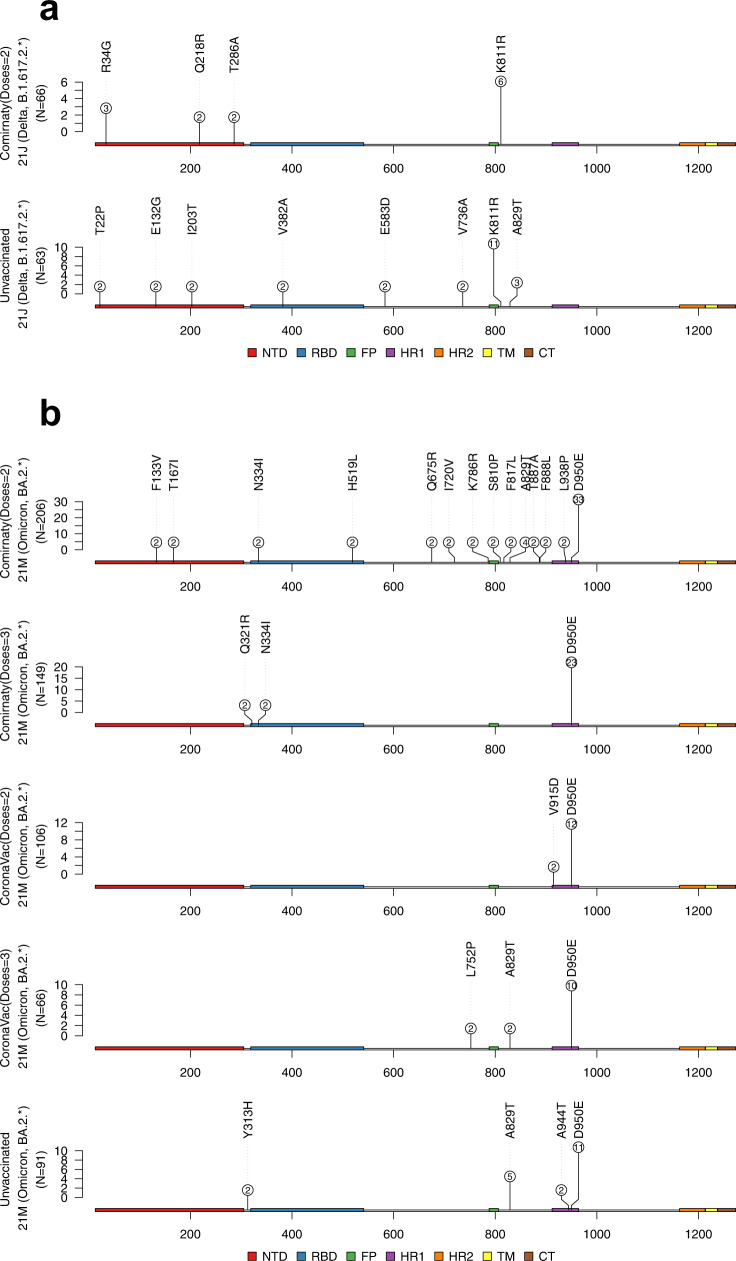
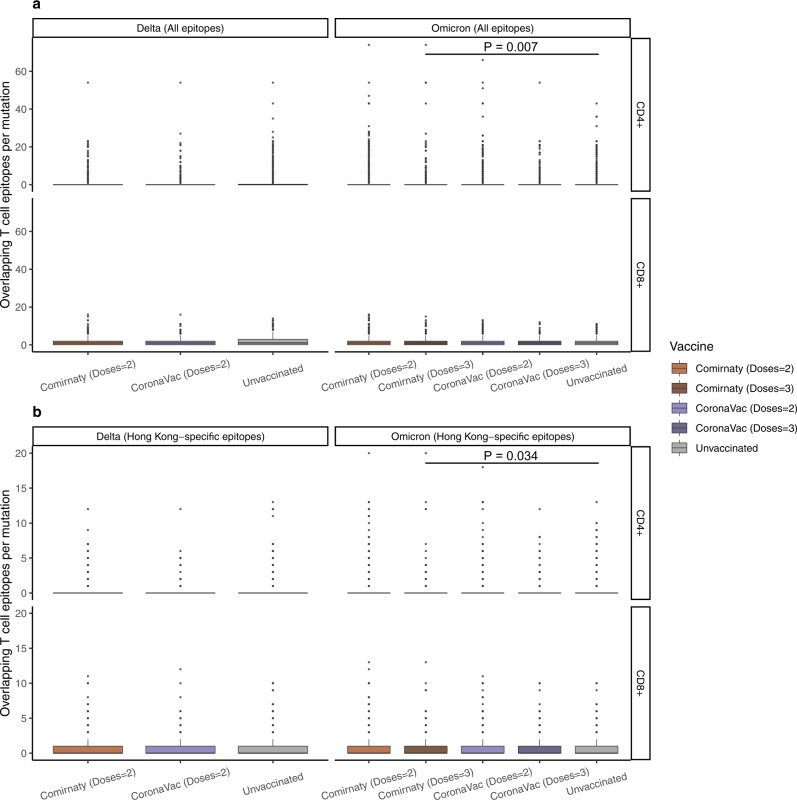
Viral and host factors can shape SARS-CoV-2 evolution. However, little is known about lineage-specific and vaccination-specific mutations that occur within individuals. Here, we analysed deep sequencing data from 2,820 SARS-CoV-2 respiratory samples with different viral lineages to describe the patterns of within-host diversity under different conditions, including vaccine-breakthrough infections. In unvaccinated individuals, variant of Concern (VOC) Alpha, Delta, and Omicron respiratory samples were found to have higher within-host diversity and were under neutral to purifying selection at the full genome level compared to non-VOC SARS-CoV-2. Breakthrough infections in 2-dose or 3-dose Comirnaty and CoronaVac vaccinated individuals did not increase levels of non-synonymous mutations and did not change the direction of selection pressure. Vaccine-induced antibody or T cell responses did not appear to have significant impact on within-host SARS-CoV-2 sequence diversification. Our findings suggest that vaccination does not increase exploration of SARS-CoV-2 protein sequence space and may not facilitate emergence of viral variants.


Conflict of interest statement

The authors declare no competing interests.

Figures

Fig. 1
Fig. 1. Statistics of within-host mutations in SARS-CoV-2 samples.
a Distribution of number of iSNV site(s) in each sample, colored by ranges of Ct values. The dashed line shows the mean value of the distribution. b Distribution of number of sample(s) sharing iSNVs (e.g., if the iSNV identified in one sample was not shared with any other sample, then the number of samples sharing that iSNV equals to one (x = 1), and so on), colored by variant types, where UTR stands for untranslated region. c Distribution of the frequency of iSNVs per sample per synonymous and per non-synonymous site (dS and dN) for different types of mutations, colored by variant types. The dashed lines show the average frequency of synonymous and non-synonymous iSNVs among all types of mutations. The points and error bars show mean and standard deviation values based on 10,000 bootstrap replicates at mutation level. d Distribution of the frequency of iSNVs per sample per Kb for synonymous and non-synonymous site (dS per Kb and dN per Kb) in different genomic regions of 1Kb length, colored by variant types. The points and error bars show mean and standard deviation values based on 10,000 bootstrap replicates at mutation level. e Distribution of high-frequency mutations shared by multiple samples, colored by variant types. Coding regions of the SARS-CoV-2 genome, based on the reference genome (GenBank: MN908947.3), are shown at the bottom of the figure. Source data are provided as a Source Data file.
Fig. 2
Fig. 2. Comparison of within-host mutation profiles between unvaccinated VOC and unvaccinated non-VOC samples.
a–c Full genome incidence of iSNVs (adjusted number of iSNVs per Kb), abundance of iSNVs (minor allele frequencies, MAF), and adjusted nucleotide diversity (π) of different samples. For all box plots, the bold horizontal line inside the box shows the median, the upper and lower edges of the box indicate the first and the third quartiles, and whiskers extend to span a 1.5 interquartile range from the edges. Pairwise comparisons between groups were performed by two-sided two-sample Wilcoxon tests; the pairs with Benjamini-Hochberg (BH) corrected P value 0.01 and 0.05 are labelled with “**” and “*” respectively. d–e Full-genome and gene-specific within-host nonsynonymous nucleotide diversity (πN) and synonymous nucleotide diversity (πS) in samples from different groups. The points and error bars show the mean and standard deviation values under 10,000 bootstrap replicates at codon level. Significance was evaluated using two-sided Z-tests of the null hypothesis that πNπS=0 (10,000 bootstrap replicates, codon unit); P-value 0.01, 0.05 and 0.10are labelled with “**”, “*” and “^”, respectively. The number of biologically independent samples in each group are shown in Supplementary Table 5. Source data are provided as a Source Data file.
Fig. 3
Fig. 3. Comparison of within-host mutation profiles between vaccinated and unvaccinated Delta and Omicron samples.
ac Full-genome incidence of iSNVs (adjusted number of iSNVs per Kb), abundance of iSNVs (minor allele frequencies, MAF) and adjusted nucleotide diversity (π) of different samples. For all box plots, the bold horizontal line inside the box shows the median, the upper and lower edges of the box indicate the first and the third quartiles, and whiskers extend to span a 1.5 interquartile range from the edges. Pairwise comparisons between groups were performed by the two-sided two-sample Wilcoxon test; the pairs with Benjamini-Hochberg (BH) corrected P value 0.01 and 0.05 are labelled with “**” and “*” respectively. de Full-genome and gene-specific within-host nonsynonymous nucleotide diversity (πN) and synonymous nucleotide diversity (πS) in samples from different groups. The points and error bars showed the mean and standard deviation values under 10,000 bootstrap replicates at codon level. Significance was evaluated using two-sided Z-tests of the null hypothesis that πNπS=0 (10,000 bootstrap replicates, codon unit); P-value 0.01, 0.05 and 0.10were labelled with “**”, “*” and “^”, respectively. The number of biologically independent samples in each group are shown in Supplementary Table 5. Source data are provided as a Source Data file.
Fig. 4
Fig. 4. Recurrent spike mutations identified in unvaccinated and vaccinated Delta and Omicron samples.
The numbers in each circle represent the number of mutations identified in samples in respective groups. a Identified within-host mutations in Delta samples (the data for group CoronaVac (Doses=2) 21 J (Delta, B.1.617.2.*) is not available as no recurrent mutation was found in this group). b Identified within-host mutations in Omicron samples. Source data are provided as a Source Data file.
Fig. 5
Fig. 5. Overlapping known SARS-CoV-2 CD8+ and CD4+ T cell epitopes per mutation in unvaccinated and vaccinated Delta and Omicron samples.
a Analysis based on all known SARS-CoV-2 T cell epitopes. b Analysis based on T cell epitopes associated with HLA alleles prevalent in the Hong Kong population. Pairwise comparisons within groups were performed by the two-sided two-sample Wilcoxon test. For all box plots, the bold horizontal line inside the box shows the median, the upper and lower edges of the box indicate the first and the third quartiles, and whiskers extend to span a 1.5 interquartile range from the edges. The sample size of data in each group are shown in Supplementary Fig. 6 and 9. Source data are provided as a Source Data file.

Update of

References

    1. Mathieu, E. et al. Coronavirus pandemic (COVID-19). Our world in data. Published online at OurWorldInData.org. Retrieved from: https://ourworldindata.org/covid-vaccinations [Online Resource] (2020).
    1. Pulliam JRC, et al. Increased risk of SARS-CoV-2 reinfection associated with emergence of Omicron in South Africa. Science. 2022;376:eabn4947. doi: 10.1126/science.abn4947. - DOI - PMC - PubMed
    1. Lipsitch M, Krammer F, Regev-Yochay G, Lustig Y, Balicer RD. SARS-CoV-2 breakthrough infections in vaccinated individuals: measurement, causes and impact. Nat. Rev. Immunol. 2022;22:57–65. doi: 10.1038/s41577-021-00662-4. - DOI - PMC - PubMed
    1. McCallum M, et al. Structural basis of SARS-CoV-2 Omicron immune evasion and receptor engagement. Science. 2022;375:864–868. doi: 10.1126/science.abn8652. - DOI - PMC - PubMed
    1. Arora P, et al. Comparable neutralisation evasion of SARS-CoV-2 omicron subvariants BA.1, BA.2, and BA.3. Lancet Infect. Dis. 2022;22:766–767. doi: 10.1016/S1473-3099(22)00224-9. - DOI - PMC - PubMed

Publication types