. 2023 Mar 31;14(1):1820.
doi: 10.1038/s41467-023-37527-4.

Single-cell analysis of peripheral blood from high-altitude pulmonary hypertension patients identifies a distinct monocyte phenotype

Affiliations

Single-cell analysis of peripheral blood from high-altitude pulmonary hypertension patients identifies a distinct monocyte phenotype

Xin-Hua Wu et al. Nat Commun. .

Abstract

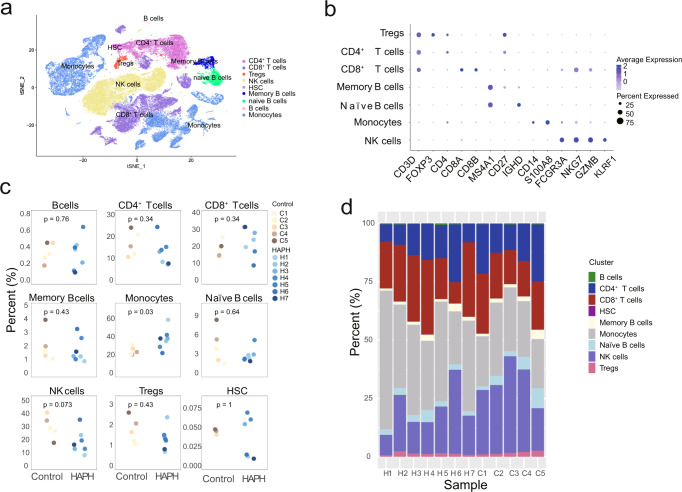
Immune and inflammatory responses have an important function in the pathophysiology of pulmonary hypertension (PH). However, little is known about the immune landscape in peripheral circulation in patients with high-altitude pulmonary hypertension (HAPH). We apply single-cell transcriptomics to characterize the monocytes that are significantly enriched in the peripheral blood mononuclear cells (PBMC) of HAPH patients. We discover an increase in C1 (non-classical) and C2 (intermediate) monocytes in PBMCs and a decrease in hypoxia-inducible transcription factor-1α (HIF-1α) in all monocyte subsets associated with HAPH. In addition, we demonstrate that similar immune adaptations may exist in HAPH and PH. Overall, we characterize an immune cell atlas of the peripheral blood in HAPH patients. Our data provide evidence that specific monocyte subsets and HIF-1α downregulation might be implicated in the pathogenesis of HAPH.


Conflict of interest statement

The authors declare no competing interests.

Figures

Fig. 1
Fig. 1. Flowchart of study design.
In total, 11 patients with sPAP ≥40 mmHg and 15 controls who lived at the ≥2900 m altitude, 6 PH cases living at 45 m altitude were enrolled. scRNA-seq analysis was performed comparing between 7 HAPH and 5 controls, and also between 7 HAPH and 6 PH, followed by validation carried out among 6 PH, 11 HAPH and 10 controls with FACS analysis. PH pulmonary hypertension, HAPH high-altitude pulmonary hypertension, sPAP systolic pulmonary artery pressure, scRNA-seq single-cell RNA sequencing, FACS fluorescence-activated cell sorting.
Fig. 2
Fig. 2. Differential immune cell composition in the circulation of patients with HAPH.
a t-SNE plot of the main immune cell subsets. b Dot plot depicting the percentages and average expressions of the canonical genes associated with each main immune cell cluster. c Boxplots comparing the percentages of indicated cell types in PBMCs between HAPH patients (n = 7) and control participants (n = 5). The two-sided p values from the Wilcoxon rank-sum test were shown. d Proportions of each cell type in HAPH patients (n = 7) and control participants (n = 5). HAPH high-altitude pulmonary hypertension, t-SNE t-distributed stochastic neighbor embedding, PBMCs peripheral blood mononuclear cells.
Fig. 3
Fig. 3. Expansion of monocyte clusters in circulation system of patients with HAPH.
a t-SNE plot of all monocytes collected in the present study. b t-SNE plot of all monocytes and the sub-clusters with cells colored based upon canonical gene markers of monocytes. clusters 0 (C0) represented as classical monocytes, C1 as non-classical monocytes and C2 as intermediate monocytes. c Heatmap displaying the scaled expression values of discriminative gene sets from all monocytes in PBMCs between HAPH and controls. The top 50 marker genes in each subgroup were shown. d Violin plots indicating the expression of genes in each monocyte cluster in PBMCs from both HAPH and controls. e Proportions of each monocyte cluster in each sample as indicated. f Boxplots comparing the percentages of each monocyte cluster in PBMCs between HAPH patients (n = 7) and control participants (n = 5). The two-sided p values from the Wilcoxon rank-sum test were shown. g Gating strategy of Monocytes by flow cytometry. h The comparison of the proportion of each monocyte subsets in PBMCs between HAPH patients (n = 11) and controls (n = 10) assessed by flow cytometry. (*p < 0.05; Unpaired t test was utilized as appropriate. Data were presented as mean ± SD). HAPH high-altitude pulmonary hypertension, t-SNE t-distributed stochastic neighbor embedding, PBMCs peripheral blood mononuclear cells.
Fig. 4
Fig. 4. Differential biological pathways in each monocyte cluster between HAPH patients and controls.
Gene Ontology analysis (biological process) of the DEGs in C0 (a), C1 (b) and C2 (c) monocytes between the HAPH and control samples. d Boxplot showing the mean pathway signature score of each monocyte subset from each group. ***p  <  0.001; ****p  <  0.0001; using unpaired Wilcox rank sum test. HAPH high-altitude pulmonary hypertension, DEGs differentially expressed genes.
Fig. 5
Fig. 5. Gene-function validation in hypoxic PH mice.
C57BL/6 mice exposed to hypoxia (10% O2) for 4 weeks exhibited higher RVSP (a) and RVHI (b) compared to that of mice in normoxia (21% O2) (n = 10 for per group, ***p < 0.001; Student’s t test. Data were presented as mean ± SD). c Representative images of hematoxylin and eosin (H&E) staining of lung tissues from mice under normoxic or hypoxic condition. Scale bars, 20 μm. d Assessment of pulmonary vascular remodeling by determination of the ratio of the media cross-sectional area to the total vessel cross-sectional area in each group (n = 10 for per group, ***p < 0.001; Student’s t test. Data were presented as mean ± SD). e The expression of Prf1, Spon2, Tbx21, Cd28 and Cd3e in lung tissues of the mice under normoxic or hypoxic condition at mRNA levels (n = 7–8 for per group, *p < 0.05, **p < 0.01; Student’s t test. Data were presented as mean ± SD). fi Representative images of immunoblottings and the quantification of the expression of Cd28 (g), Spon2 (h) and Tbx21 (i) in lung tissues of the control mice and hypoxic PH mice at protein levels (n = 8 for per group, **p < 0.01, ***p < 0.001; Student’s t test. Data were presented as mean ± SD). j Immunoblottings for the expression of Cd28, Tbx21 and Spon2 in RAW264.7 monocytes/macrophages in response to CoCl2 (150 μmol/L) or vehicle for 24 h. k Immunoblottings for the expression of CD28, TBX21 and SPON2 in THP-1 monocytes in response to CoCl2 (150 μmol/L) or vehicle for 24 h. l Quantification of the expression of Cd28 (CD28), Tbx21 (TBX21) and Spon2 (SPON2) in RAW264.7 and THP-1 cells (n = 4 for per group, *p < 0.05, **p < 0.01; Student’s t test. Data were presented as mean ± SD). m Representative images of immunoblottings of Jurkat Clone E6-1 cells transfected with CD28 siRNA (siCD28) or control siRNA (siControl). n Viability of human PASMCs co-cultured with or without CD28-silencing or control Jurkat cells for 48 h (n = 5 for per group, *p < 0.05, **p < 0.01; one-way ANOVA, Tukey’s post-hoc test. Data were presented as mean ± SD). PH pulmonary hypertension, RVSP right ventricular systolic pressure, RVHI right ventricular hypertrophy index, PASMCs pulmonary arterial smooth muscle cells. Prf1 Perforin 1, Spon2, Spondin 2, Tbx21 t-box transcription factor 21.
Fig. 6
Fig. 6. Comparison of the expression of HIF-1α and VEGF1 in immune cell population between HAPH and controls.
Box plots displaying the expression of HIF-1α in HAPH patients relative to that in controls in indicated cell population (a: all cells, b: NK cells, c: B cells, d: T cells, and e: monocytes). **p  <  0.01; n.s. not significant by unpaired two-sided t test. f Box plots showing the comparison of the expression of HIF-1α in each monocyte cluster between HAPH patients (n = 7) and controls (n = 5). gi Box plots showing the comparison of the expression of VEGFA in each monocyte cluster between HAPH patients (n = 7) and controls (n = 5). HIF-1α hypoxia-inducible factor-1α, VEGF vascular endothelial growth factor, HAPH high-altitude pulmonary hypertension, NK cells natural killer cells.
Fig. 7
Fig. 7. Immune cell composition in the circulation system of patients with PH and its comparison with those in HAPH.
a t-SNE plot of the main immune cell subsets in PBMCs from patients with PH (n = 6). b Dot plot depicting the percentages and average expressions of the canonical genes associated with each main immune cell cluster in PBMCs from patients with PH (n = 6). c Boxplots comparing the percentages of each main cell type in PBMCs between HAPH (n = 7) and PH (n = 6) patients. The two-sided p values from the Wilcoxon rank-sum test were shown. d Proportions of each cell type in each sample as indicated. (eg) The proportion of T cells, NK cells and C0, C1, C2 monocyte subsets in PBMCs from HAPH (n = 11) and PH (n = 6) patients as analyzed by flow cytometry (*p < 0.05; Unpaired t test was utilized as appropriate. Data were presented as mean ± SD). PH pulmonary hypertension, HAPH high-altitude pulmonary hypertension, t-SNE t-distributed stochastic neighbor embedding, PBMCs peripheral blood mononuclear cells.

References

    1. Douschan P, et al. Mild elevation of pulmonary arterial pressure as a predictor of mortality. Am. J. Respir. Crit. Care Med. 2018;197:509–516. doi: 10.1164/rccm.201706-1215OC. - DOI - PubMed
    1. Humbert M, et al. 2022 ESC/ERS Guidelines for the diagnosis and treatment of pulmonary hypertension. Eur. Heart J. 2022;43:3618–3731. doi: 10.1093/eurheartj/ehac237. - DOI - PubMed
    1. Iranmehr A, et al. Novel insight into the genetic basis of high-altitude pulmonary hypertension in Kyrgyz highlanders. Eur. J. Hum. Genet. 2019;27:150–159. doi: 10.1038/s41431-018-0270-8. - DOI - PMC - PubMed
    1. Xu XQ, Jing ZC. High-altitude pulmonary hypertension. Eur. Respir. Rev. 2009;18:13–17. doi: 10.1183/09059180.00011104. - DOI - PubMed
    1. Galie N, et al. Risk stratification and medical therapy of pulmonary arterial hypertension. Eur. Respir. J. 2019;53:1801889. doi: 10.1183/13993003.01889-2018. - DOI - PMC - PubMed

Publication types

Supplementary concepts